All good log browsers provide tools to narrow down the log entries they display. Without those, it would be easy to waste all day wandering through tens of thousands of entries. One common tool provided by macOS, directly and in the log command tool, is filtering using predicates. Although LogUI provides easy access to simple predicates, to get the best from them, it’s worth digging a little deeper, as I do here.
Instant predicates
LogUI’s instant predicates filter log entries according to any of four basic predicate types:
subsystem, such as com.apple.sharing, the field shown in yellow in log extracts;
eventMessage, the text message listed in white/black at the end of each entry;
processImagePath, such as mediaanalysisd, shown in blue, the name of the process making that entry;
senderImagePath, such as libxpc.dylib, shown in red, the name of the process sending that entry.
These are quick to enter in the text box to the right of the popup menu in the window’s toolbar, but in many circumstances can prove too broad, and need narrowing down further. In other situations, you want to browse entries from two subsystems, or using a combination of criteria. The best way to do that is to write a short predicate. For single use, you can do that in the one-off predicate editor using the Set button.
When you want to reuse that, you can add it to the predicate popup menu using Settings Predicate (currently a bit kludgy).
Predicates
macOS can use predicates in other situations, most commonly for Spotlight search. If you’re interested in those, see Apple’s Predicate Programming Guide. Here I’ll describe predicates as they’re more commonly used to filter log entries, as they’re usually much simpler.
Each simple predicate consist of three parts:
the name of one of the fields in a log entry, such as subsystem or eventMessage. This sets where the filter looks in each entry;
an operator, which might be == for ‘equals’ exactly, or for text is commonly CONTAINS[c] for case-insensitive contains;
text or a numeric value to look for, such as “error” or 513. Only those entries equalling or containing (or whatever the operator means) this in the specified field will then be returned from the log and displayed.
Here are some basic examples.
eventMessage CONTAINS[c] "error"
entries will only be those with the text error in their message field.
subsystem == "com.apple.duetactivityscheduler"
entries will all have that text, ignoring case, but only that text, as the name of their subsystem.
subsystem CONTAINS[c] "com.apple.xpc"
entries will have any subsystem containing that text, which also includes com.apple.xpc.activity.
Fields
Although you can use any of the fields shown in LogUI (and some that aren’t), the most commonly used are, in order as they are shown in LogUI’s window:
eventType (red) – matches the type of event, such as logEvent (1024), traceEvent (768), activityCreateEvent (513), or activityTransitionEvent (514). Can be given as characters (case-sensitive) without quotation marks, or using the digits given in parentheses. Use these only with the operators == or !=, as they are treated as numbers rather than text.
category (green) – this matches the category, and varies according to subsystem. This is given as text in quotation marks, and is normally lower-case.
messageType (white/black) – matches the type of message for logEvent and traceEvent, and includes default (0), release (0), info (1), debug (2), error (16), and fault (17). Can be given as characters (case-sensitive) without quotation marks, or digits as shown in parentheses. Use these only with the operators == or !=, as they are treated as numbers rather than text.
senderImagePath (red) – this matches the text pattern in the name of the sender, which might be the name of a library, extension, or executable.
processImagePath (blue) – this matches the text pattern in the name of the process that originated the event.
subsystem (yellow) – this matches the subsystem specifier, e.g. com.apple.TimeMachine, given as text in quotation marks. You may find it best to use CONTAINS[c] rather than ==, to allow for differences in case and extended subsystem specifiers.
eventMessage (white/black) – for this, you specify a text pattern, or text, within the message, given as text in quotation marks.
Operators
The following comparisons and other operators are available:
== (two equals signs) for equality
!= or <> for inequality
>= or => for greater than or equal to
<= or =< for less than or equal to
> for greater than
< for less than
AND or && for logical and
OR or || for logical or
NOT or ! for logical not
BEGINSWITH, CONTAINS, ENDSWITH, LIKE, MATCHES for string comparisons, using regex expressions when desired; strings can be compared with case insensitivity and diacritic insensitivity by appending [cd] to the operator, e.g. CONTAINS[c] means case-insensitive comparison
FALSE, TRUE, NULL have their expected literal meanings.
There are others as well, but you’ll seldom use them to filter log entries.
Building complex predicates
To see the scheduling and dispatch of background activities by DAS-CTS, you need to look at log extracts showing both their entries. Use the predicate subsystem == "com.apple.duetactivityscheduler" OR subsystem CONTAINS "com.apple.xpc"
to do that. The first part of it includes those entries from DAS, and the second includes those for XPC and its relatives that run CTS. Using an OR between the two parts combines both sets of entries in the one extract.
To see the reports posted by XProtect Remediator, you need to look at those entries made by its subsystem that have the right category, using the predicate subsystem == "com.apple.XProtectFramework.PluginAPI" AND category == "XPEvent.structured"
Using the AND operator ensures that the only entries shown come from that one subsystem, and they are given just that category.
Time Machine involves a combination of different subsystems and messages. To get a good overview of relevant entries, you can use subsystem == "com.apple.TimeMachine" OR
(subsystem == "com.apple.duetactivityscheduler" AND eventMessage CONTAINS[c] "Rescoring all") OR
(subsystem == "com.apple.xpc.activity" AND eventMessage CONTAINS[c] "com.apple.backupd-auto") OR
eventMessage CONTAINS[c] "backup" OR
eventMessage CONTAINS[c] "Time Machine" OR eventMessage CONTAINS[c] "TimeMachine"
I’ve broken this down into separate lines, but you shouldn’t do that in the predicate. Taking it line by line it becomes simpler to understand. Use parentheses () to group each part of the predicate carefully as shown.
You can see other examples in the Help book for my free utility Mints: the Further Information pages towards the end give each of the predicates that Mints uses for its log extracts.
Quick summary
[field name] [operator] [text or numeric value]
common field names: senderImagePath, processImagePath, subsystem, eventMessage
By anyone’s standards, the macOS log contains a great many entries, and being able to filter out the noise is essential. This is accomplished by applying predicates to determine which entries are extracted and shown in a log browser like LogUI. However, using predicates requires knowledge about the log and its entries, and forms the greatest barrier for most users. This new version of LogUI improves features to help you use predicates to make the log more accessible.
This all happens in the toolbar of its browser window.
The section at the left of the lower row of tools now provides two methods to apply your own predicates: a one-off predicate editor, and an editor for custom entries in its popup menu.
One-off predicates
Click on the Set button to open the one-off predicate editor.
Here you can compose and paste in your own custom predicates that will extract only the log entries that you’re interested in. In this example, only entries whose subsystem is com.apple.duetactivityscheduler, or contains com.apple.xpc, will be gathered and displayed. Those tell you what’s going on with DAS and CTS scheduling and dispatch of background activities.
LogUI keeps that one-off predicate, even after a restart, as it’s automatically written to its preference file.
Once you’ve clicked Save, selecting the [ … ] item in the predicate menu will apply that predicate to each log extract you obtain.
There’s also an additional standard predicate using the senderImagePath.
Custom menu predicates
Predicates listed in that menu below blowhole are custom predicates saved to LogUI’s preferences using its new Predicate tab in its Settings. This editor is very basic at the moment, and its use a little awkward. This is because SwiftUI much prefers menu contents to be static, so adding items to the predicate menu doesn’t go down too well. This editor allows you to add one predicate at a time, in plain text format.
Click on the Append button here and there’ll be a new predicate named XProtect Remediator with the predicate shown. You can only add one new predicate, then need to quit the app before adding another. I’m sorry that’s so laborious, but once you have set up your custom predicates you can return to using LogUI fully.
The Settings General pane now contains a button to Reset Predicates back to their defaults.
Predicates
A basic predicate is composed of a log field name, like subsystem, followed by an operator such as == (equals) or CONTAINS[c] (case-insensitive contains), and a filter term, usually a string like "com.apple.xpc". So the predicate subsystem CONTAINS[c] "com.apple.xpc"
will return all log entries with their subsystem containing the text com.apple.xpc. You can combine those basic elements into a more selective predicate using combinators such as AND and OR, so subsystem == "com.apple.duetactivityscheduler" OR subsystem CONTAINS|c] "com.apple.xpc"
returns entries with a subsystem of preciselycom.apple.duetactivityscheduler together with those whose subsystem contains the text com.apple.xpc.
Some years ago I wrote a primer here, and you’ll find some useful predicates in the Further Information section in the Help book for Mints. I’ll be writing more here to help you get the best out of LogUI.
There are a couple of oddities with predicates. SwiftUI tends to like using typographic double-quotation marks, but the macOS predicate builder doesn’t accept them as a substitute for straight marks. So LogUI changes all styled marks to straight ones automatically for you, to ensure those shouldn’t cause a problem. However, when it encounters errors it can behave erratically; while I’m trying to make this more robust, I apologise in advance if using a broken predicate upsets LogUI. It’s worth being careful to check your predicates before trying to use them.
LogUI version 1.0 build 37 is now available from here: logui137
My next task is to improve editing and saving predicates to its preferences, to make them accessible as menu customisations.
This week’s new features in my lightweight log browser LogUI tackle two important areas: initial checks to confirm that the app can access the log, and improving the filtering of log entries using predicates.
LogUI has three key requirements:
that the Mac is running macOS 14.6 or later, as enforced by macOS;
that it’s run from an admin account, as that has the privileges required to access the log;
that there are log records it can access in the path /var/db/diagnostics, as without those it hasn’t got anything to work with.
LogUI 1.0 build 31 now contains code to check the latter two, run soon after launch. If either fails, you’ll see an informative alert, and the app will quit when you click to dismiss that.
LogUI now has internal features to support a wide range of filters that can be applied when fetching log entries. These are an essential means of reducing the number of entries displayed, and of focussing your attention on what’s important.
This is reflected in its Settings, which now refer to Text rather than a Subsystem. The window toolbar now has a Predicate popup menu, and its text box is labelled text rather than Subsystem.
This menu offers the following options:
none, which applies no filtering and displays all log entries;
subsystem, which uses the text entered as the name of the subsystem whose entries are to be displayed, as in the previous builds;
eventMessage, which shows only those log entries whose message contains the text entered;
processImagePath, which shows only entries whose process name (or path) contains the text entered;
[Edit], which in future will open an on-the-fly predicate editor, but currently doesn’t filter;
TimeMachineBasic to blowhole, which use set predicates to display log entries for those features. The first two are different levels of detail for Time Machine backups, error finds entries with that word in their message, kernel finds entries with the kernel as their process, and blowhole finds entries made by my command tool for writing entries in the log.
Text entered is not case-sensitive.
Although it’s currently possible to change and extend those, that involves delicate surgery to LogUI’s preferences Property List, and I don’t intend you to hack that just yet. The next features will provide a proper editor in LogUI’s Settings, and the on-the-fly editor accessed through this menu.
Otherwise LogUI should work just the same as the last build. These new features are documented in its Help book, a separate copy of which is supplied in its Zip archive.
LogUI 1.0 build 31 is now available from here: logui131 and I will shortly be giving it an entry in my log browser Product Page, to make it easier to access. I’m also looking at building an auto-update mechanism into it.
Please let me know how you get on with this, and whether it proves useful to you. Enjoy!
If you ever need to understand what’s going on in your Mac, reading its log is essential. However much you might stare at Activity Monitor, read source code or disassemble components of macOS, what you can see in the log tells you what has really happened. Whether it’s a bug or an unexpected event, it’s the only way to look back and discover what went on.
For most, Console isn’t the right tool. It only offers the options of viewing its live stream, or making an archive of the whole log and wading through that when you need to look at an event in the past. Although my log browser Ulbow gives much better access, for many it’s still a daunting task. I’ve now switched almost entirely to using my new lightweight log browser, LogUI, and here explain how you can use it. Although it’s currently an early release with limited features, you should find it ideal for getting started.
LogUI 1.0 build 27 is available from here: logui127
This comes as a Zip archive, so unZip it, and move the LogUI app to another folder before running it for the first time; your main Applications folder is fine, and almost anywhere will do nicely. Alongside it is a copy of the PDF Help file that’s also inside the app, so you can refer to it when you’re not running LogUI. As the two are identical, you can trash the separate copy if you’re happy to use that inside the app.
Before opening LogUI, generate an event that you can examine in the log. One starter might be launching an app. Try to do this when your Mac is otherwise quiet and unoccupied: if Activity Monitor shows it’s busy with lots of background tasks, then the log could be filling with noise, when what you want most is peace. For the sake of simplicity, time this on an even minute, and make a mental note of that time to the second.
As soon as you’ve done that, open LogUI and you’ll be greeted by its window, with its toolbar ready for you to set up and get your first log extract. That should be set as follows:
Start to the current date, hour and minutes. As those are set to the time you open the window, they should already be close to the time of the event. Just after the stepper control is the seconds setting. If the event occurred a moment after the seconds changed to 00, that makes a convenient time to start your log extract.
Period set to around 5 seconds. This value can be floating point decimal, so might be 2.5 seconds for a smaller log extract.
Max entries set to 1000 to start with.
Show Signpostsnot ticked.
Full Fields ticked.
Subsystem empty.
Then click on Get Log to see the log extract for that period.
In my case, a five second period overfilled the 1000 I had set in Max entries. Scrolling to the foot of the extract showed that had been reached in less than two seconds, so I increased Max entries to 10000 and clicked Get Log again.
There are now over 5,000 entries in the extract, but they scroll smoothly enough to let me look around them.
The best way of reducing the number of entries to make them more understandable is to add a Subsystem as a filter. In this case, as I’ve launched an app, I can get most useful information from LaunchServices, by entering com.apple.launchservices
into Subsystem. I also reduce the number of fields shown by unticking the Full Fields box, letting me concentrate on the messages. You can toggle Full Fields without having to get log entries again, as it only affects the fields within those entries that are shown in the window. Then click on Get Log again.
Scrolling down through the 358 entries remaining, I quickly reach one with a message field reading LAUNCH: translocate to <private> from <private>
Although we could do without the privacy censorship here, it’s easy to work out that the app I just launched underwent app translocation, and that’s confirmed a little further down when LaunchServices gives its full path.
If you want a copy of the text from one or more selected entries, use the Copy command (Command-C), then paste it into any text editor. That doesn’t copy all the fields, only those you’re most likely to need elsewhere. For a full copy of that log extract, with colours indicating the fields, click on the Save as RTF button. As with LogUI’s window title, saved files are given default file names containing the start time of that log extract to help you keep them in good order.
This is the same log extract seen in my rich text editor DelightEd.
Finally, open LogUI’s Settings to enter the defaults you want its windows to open with. These match controls in its toolbar. The last of those, Light Mode, enables you to run the whole app in Light Mode if you prefer. For that to work, your Mac will also need to be in Light Mode, and you should tick that box, close the Settings window and quit the app. When you next open it, it should operate in Light Mode. Other changes made to Settings don’t need you to quit the app for them to take effect.
Last week I introduced my new prototype log browser, LogUI, which seems to have been popular with many. As I now use it in preference to its predecessor Ulbow, I’ve spent a little time adding some new and improved features to bring you version 1.0 build 25. Changes include:
support for discontinuous selection of log entries,
support for copying text from selected log entries,
subsystem names are now case-insensitive,
support for Signposts,
window names change to include the start time of each log excerpt,
RTF saved file names change to reflect the start of each log excerpt.
Settings
These now let you set app defaults for displaying full log entries, and for fetching and displaying Signposts.
Browser controls
The only addition to these is the option to Show Signposts. When that’s ticked, Get Log also fetches all Signposts during the set period, and displays them inline with regular log entries.
LogUI now supports all types of log entry:
regular log entries,
Activities, events such as clicks/taps and others,
Boundaries, markers such as the start of the boot process,
Signposts, used to record significant steps and assess performance.
Signposts have their own custom fields, including signpost ID, name, and type, which are displayed when Full Fields are enabled. The only caution with Signposts is that they can outnumber regular log entries, so if you don’t need to see them, it’s better to leave them turned off.
I’m grateful to Joe for asking for the subsystem to be case-insensitive. This means that you can enter com.apple.TimeMachine or com.apple.timemachine as the subsystem and LogUI will display entries with a subsystem name of com.apple.TimeMachine for both. No longer will case trip you up.
Log entries
The biggest changes are in the selection and copying of log entries. You can now select log entries in a browser window. Selections can be multiple continuous using the Shift key modifier, and discontinuous using the Command key modifier. When one or more entries have been selected, you can then copy their text contents using the Copy command or Command-C. Copied text can then be pasted into an app that supports handling of text items in the Clipboard.
Because there are many different fields possible in each entry, copied text consists of a standard set: date level sender process subsystem message each separated by a Tab character.
If you want more fields with colour, save the log excerpt in RTF, open it in an RTF editor and copy from that.
If you’re a developer and are wondering how I have implemented this copy feature for a SwiftUI List, let me know and I’ll explain how I managed to pin this tail on the donkey while I was blindfolded, or how persistent guessing overcame the absence of documentation or example code.
Naming
To distinguish between windows and saved RTF files, LogUI now automatically names and renames its windows and the default file names suggested when saving files. Names are based on the Start date and time of the current log excerpt in that window. To begin with, when there’s no log extract, each new window is named LogUI. When it gains its first extract, the date and time are appended to that, e.g. LogUI 2025_03_03_08-14-00, and a similar default file name is offered. When you obtain a new log excerpt in the same window, those names are updated to reflect the changed Start date and time.
Help book
This has been updated to include all these changes.
LogUI 1.0 build 27 is now available from here: logui127 It still requires a minimum macOS version of 14.6, I’m afraid, because of the SwiftUI features it has to rely on.
Enjoy!
Postscript
I have replaced build 25 with 27. This completes support for Signposts, by including them in saved RTF files. I’ve also taken the opportunity to make a small correction in the Settings dialog, and to add a link to the technical info to the log access source code.
Although I often use my free log browser Ulbow daily, and it serves its purpose well, it’s time to move on with changing macOS and its APIs, and do better. Ulbow still relies on the log command tool to get its log extracts, and its front end is thoroughly AppKit.
Apple introduced the Unified log in macOS Sierra back in 2016, and at that time the only way to access it was using the log command tool, which isn’t among those for which it has provided source code. It wasn’t until Catalina in 2019 that Apple provided an API allowing developers to obtain log entries direct. As that wasn’t retro-fitted, the few apps that access the log couldn’t use that on Macs running Mojave or earlier, limiting its usefulness until relatively recently. When I developed Consolation in 2017, and its successor Ulbow two years later in 2019, I therefore continued to rely on the log command tool to obtain log extracts.
By a curious coincidence, SwiftUI was also first released for macOS in 2019, although it has taken an extraordinarily long time to approach maturity. Over the last couple of years it has improved to the point where some outstanding apps like OmniFocus have now abandoned the older AppKit API in favour of SwiftUI.
Last summer I had a first go at writing a potential replacement for Ulbow using the combination of OSLog to give direct access to log entries, and SwiftUI for its interface. At that time I reached an impasse largely as a result of excessive memory use and a memory leak that I was unable to resolve, and concluded that “Ulbow already performs better than LogUI ever could.”
More recently I have returned to that project and accepted that trying to support older versions of macOS before Sonoma is too great an impediment. Calling on some newer features in SwiftUI I have made better progress and, although not entirely continent in its use of memory, I now have an experimental version that I’m using daily. It appears robust and stable, and shouldn’t run away with all your Mac’s memory. Although it currently lacks key features like Find/Search and the ability to copy text from its browser window, it can store log extracts in rich text format.
Its Settings establish defaults common to all new browser windows:
Subsystem allows you to filter entries by a single predicate for one specified subsystem.
Period lets you set a default period for log excerpts, given in decimal seconds, so you can set 2.5 seconds if you wish.
Max entries is the limit of entries to be fetched and displayed. This can be set as high as 20,000 or even more.
Light Mode will set the app’s windows to Light Mode when you next open the app, if your Mac is also set to run in Light Mode. This allows you to opt out of Dark Mode if you really must.
Window controls let you override the first three of those defaults, and add
Start, a date and time to start the log excerpt.
Full Fields, whether to show all fields or just a shortened selection.
Get Log button to get a log excerpt.
Save as RTF button to write the log excerpt out to a rich text file.
The count of entries in the current excerpt.
The end result is, I think, a considerable improvement on Ulbow, in terms of readability, without sacrificing too much space as in Console’s rigid columns.
This experimental release comes with its own PDF documentation, also accessible within the app as its Help book. I’d be very grateful if you could take it out for a spin and see how robust its log engine is, and whether you prefer its new layout for log entries. You can download a copy from here: logui120
Note that it requires a minimum macOS version of 14.6, to ensure that it doesn’t rob your Mac of memory.
Once its engine is reliable, I will add more features, starting with Search/Find support, and the ability to copy entries from its window.
A kernel panic is completely different from an app crash. When apps suddenly vanish because of a bug or error, everything else should carry on as normal. When your Mac restarts of its own accord, or you find it shut down and have to start it up again, that’s almost certainly a kernel panic, and should be taken seriously.
Kernel panics occur when macOS can’t continue running any more due to severe (software) damage, and its only option is to restart itself in order to resume normal services. When this happens before the login window appears during startup, it normally results in a boot loop, as discussed elsewhere. This article covers the more common situation when a Mac restarts spontaneously and completes login without any further panic occurring.
Virtual machines (VMs) can also suffer kernel panics, as well as causing the host macOS to panic. Those should behave like other panics, although if you’re unlucky the VM might be damaged and unable to restart properly. If that happens, your only option is to try starting that VM up in Recovery, to see if it can be repaired there. If not, and you can’t get it to start up again, you’ll need to trash it and restore its last backup copy.
Save the panic log
Within a minute or so after restarting, a Panic Alert is displayed, inviting you to agree to send the panic log to Apple. Don’t simply agree to that, though, as it’s the only record of what happened. Panic logs used to be saved in /Library/Logs/DiagnosticReports, from where you could open them in Console, but more recently may be found somewhere closer to /var/db/PanicReporter. You therefore need to copy its contents as soon as it appears and before sending it to Apple.
If the alert isn’t already showing the panic log, click on its Report… button, then open a text editor like TextEdit. Copy the whole contents of the panic log into an empty text window and save it somewhere safe before clicking on the button to send the report to Apple. Once you’ve done that, the alert is dismissed and can’t be brought back.
It’s commonly assumed that sending a panic log to Apple means that an engineer will look through it and get back to you with some sort of diagnosis. That isn’t what the report does, though: it’s processed automatically and, while there’s nothing stopping someone at Apple contacting you about it, that simply doesn’t happen. Only by saving a copy of the log could you contact Apple Support and ask for their help. Also consider filing a Feedback report containing a description of what happened and your copy of the panic log, particularly if you have clues as to its cause.
Immediate actions
The three most common reasons for kernel panics are:
hardware (and device firmware) failure or error,
kernel extensions,
conflict with a peripheral.
If you suspect a hardware failure, or wish to rule that out, shut your Mac down once you have captured the panic log, disconnect all non-essential peripherals, and start it up in Diagnostics to run its hardware test routines. If you’re not reassured that all is well, don’t hesitate to get your nearest Apple store or authorised service provider to run their more advanced diagnostics as well.
On Apple silicon Macs, Diagnostics is different in relying on a hidden key combination: start the Mac up in Recovery by holding the Power button, and in the initial Options screen, hold Command-D until the Diagnostics Loader starts. This may require download of the disk image from Apple’s servers before testing can proceed, so a good Wi-Fi connection is important. Once loaded, there’s a hidden option for extended diagnostics that can be triggered by holding the Command-E key combination.
Panics associated with peripherals such as Thunderbolt docks and hubs are best diagnosed by running the Mac without the suspect hardware connected, to test if panics continue. If they do, and you remembered to save panic reports, even if you don’t understand their details you can still compare them to see if they look similar.
Kernel extensions
Third-party kernel extensions are normally found in /Library/Extensions or the app using them, from where macOS stages them into a folder in /Library/StagedExtensions where they’re protected by SIP. Most are only loaded on demand, so the mere presence of an extension there isn’t sufficient evidence to convict it of causing the panics. However, you should become suspicious when a third-party extension is named in the panic log as being part of the chain that may have caused it. Most software that used to rely on kernel extensions has now been updated to use system extensions or another modern replacement, so updating old software could solve the problem.
Tools for working with kernel extensions are detailed in the article on boot loops. If you need to remove a kernel extension, this article explains how to do that. One quick way to disable all third-party kernel extensions on an Apple silicon Mac is to start it up in Recovery, go through to the main Recovery window, open Startup Security Utility from the Utilities menu, disable loading kernel extensions and return it to Full Security.
Modern System Extensions don’t run with the same level of privilege as kernel extensions, so in theory shouldn’t be capable of causing kernel panics. However, experience has shown that the macOS kernel extensions required to support them can prove unstable and cause panics. This should be apparent from careful reading of the panic log.
Reading the panic log
Unlike app crash logs, panic logs are normally relatively brief and to the point. Although they may be non-specific and not help you much, in many cases they contain obvious clues as to what caused the panic. Formats have changed over the years, but the following sections are likely to prove worthwhile examining.
Immediate cause
At the very top, following the first word panic, the log may suggest a cause. This is most common when a memory leak is to blame, such as panic(cpu 8 caller 0xffffff80017729eb): "zalloc: zone map exhausted while allocating from zone kalloc.12288, likely due to memory leak in zone kalloc.48 (6586956000 total bytes, 137228148 elements allocated)"@/AppleInternal/BuildRoot/Library/Caches/com.apple.xbs/Sources/xnu/xnu-6153.141.1/osfmk/kern/zalloc.c:3627
This first tells you which CPU core the panic occurred on. If you have repeated panics, keep a note of these, as they may cast suspicion on a core with a hardware problem.
In other cases, you may not be as lucky, and the cause is just given as an ‘exception’, or panic(cpu 0 caller 0xfffffe002f4e48bc): cannot find IOAESAccelerator
panic(cpu 0 caller 0xfffffe001abd5e94): Kernel data abort
so you’ll need to look for other clues. As the name implies, exceptions are conditions requiring special handling by the operating system. They include page faults, in which something has tried to access an invalid memory address, invalid instruction codes for the processor, and general protection faults which include a wide variety of other bugs. As far as the user is concerned, all exceptions indicate a bug or problem in the code that’s being run.
OS details
You may see a line like OS version: Not set yet
simply indicating that the version hasn’t been recorded yet. When it has, this gives its build number rather than version. Most importantly, you should see a statement of the kernel version running: Kernel version: Darwin Kernel Version 24.2.0: Fri Dec 6 18:57:59 PST 2024; root:xnu-11215.61.5~2/RELEASE_ARM64_VMAPPLE
You can check that against that shown in Software in System Information.
On Apple silicon Macs, you should also see the iBoot version, and the current level of boot security: iBoot version: iBoot-11881.61.3
secure boot?: YES
The latter is important, as running in Secure Boot means that no third-party kernel extensions have been loaded.
Memory leak
If there has been a memory leak, the panic log may well contain a breakdown of system memory zones giving more detailed clues. Zone Name Cur Size Free Size
vm objects 78041088 26795008
… Zone Name Cur Size Free Size
kalloc.32 280834048 3040
kalloc.48 6586956000 4896
kalloc.64 4241453056 5000896
…
Note how the Free Sizes of kalloc.32 and kalloc.48 are very small, and that of kalloc.64 is fairly low too. This is consistent with the kernel running out of memory in one of those zones. Further information may follow: Backtrace suspected of leaking: (outstanding bytes: 288)
Because there’s the suspicion of memory leakage, the panic log also gives a detailed backtrace of where it suspects that leakage is occurring, and details of the kexts involved in that. Note that those may not coincide with any kexts identified earlier as possible culprits.
Panicked task
This may simply be the kernel Panicked task 0xfffffe166cff1f18: 10735 pages, 374 threads: pid 0: kernel_task
or may give more specific information BSD process name corresponding to current thread: WindowServer
Boot args: chunklist-security-epoch=0 -chunklist-no-rev2-dev
or Panicked task 0xfffffe1b55369798: 24964 pages, 8 threads: pid 800: com.apple.Mobile
This is the name of the process running its code at the time, and can be another clue as to where the problem lies.
You may also be given a list of kernel extensions that might be involved: Kernel Extensions in backtrace:
com.apple.filesystems.apfs(1412.141.1)[6DA33D13-4501-3D48-B4D8-0329E6AEC86D]@0xffffff7f84e7d000->0xffffff7f84fa4fff
dependency: com.apple.kec.corecrypto(1.0)[804DD660-F561-3444-A076-05D7A52D65E3]@0xffffff7f82746000
…
Third-party kexts
Whatever the cause, you should next look at the list of unloaded and loaded kexts forming the rest of the panic log. These are listed in the order that they were loaded, with the most recent kext at the top. As third-party kexts are the last to be loaded, the top of the lists start with any third-party kexts installed on that system and loaded at the time of the panic. last loaded kext at 939128480512562: >!UAudio 323.4 (addr 0xffffff7f86baa000, size 434176)
last unloaded kext at 948795488738566: >usb.IOUSBHostHIDDevice 1.2 (addr 0xffffff7f8556c000, size 45056)
loaded kexts:
>!ATopCaseHIDEventDriver 3430.1
…
In most cases, the name of the kext as you’ll find it in /System/Library/Extensions is the last part of the ID given. For example, the kext with the ID of com.apple.driver.AppleMobileFileIntegrity is named AppleMobileFileIntegrity.kext.
If those lists contain any third-party kexts, they should be immediately suspected as being the cause of that panic, unless another cause is apparent.
Summary
Save the panic log before sending it to Apple.
Consider running Diagnostics if there’s the possibility of a hardware problem.
Consider disconnecting a peripheral if that could be the cause.
Consider removing/updating any third-party kernel extensions, or better, disabling them altogether.
Read the panic log to provisionally identify its most likely cause, and try to address that.
Report the panic to Apple Support and/or via Feedback.
Keep a careful watch for any further panics, and be prepared to revise your provisional diagnosis.
Several of my most popular apps make use of the main system log in macOS, and I occasionally get questions from those who can’t get them to work properly because their Mac’s log files have mysteriously disappeared. This has puzzled me for the last few years, but I think I’ve discovered the cause: some apps delete those log files in a misguided attempt to clean up your Mac and save storage space. This article explains why you shouldn’t do that.
Which logs?
In theory, since macOS Sierra introduced the macOS Unified log, there should be only one log, and one folder containing its log files, hidden away in /var/db/diagnostics.
In practice, many apps and even parts of macOS ignore those and write their own log files. Those can appear almost anywhere, but popular locations include:
~/Library/Logs, the worst offender;
/Library/Logs, which should be better maintained;
/var/log, normally properly maintained;
/var/logs, small and properly maintained.
Those locations contain a mixture of ephemeral information of little value, and some potentially important records, such as the outcome of all volume checks made by fsck on APFS and HFS+ volumes. If your Mac was migrated from a previous model, that may well have copied across logs going back years, and those four folders could well contain dozens of files, and consume several GB of space on your Mac’s startup disk.
What maintains them?
While the Unified log has a dedicated service, logd, that is constantly maintaining the files in /var/db/diagnostics, there’s no app or service that maintains all the others. As they’re considered to be custom features outside the control of the main log, it’s up to the apps that write them to remove old entries when they’re no longer required. Routine system housekeeping used to be performed at regular intervals, run by periodic scripts, but even those have been removed from macOS Sequoia, and before that much of the responsibility still rested with apps that create their own logs.
Logs in /var/log and /var/logs should be well maintained, but for most of logs written outside the Unified log, the answer is that apps responsible for maintaining their own logs don’t, and leave it to the user to clean up after them. Neither do those apps warn the user that they write their own logs but don’t maintain them.
Unified log
Look down through the list of active processes in Activity Monitor and you’ll see two, logd and logd_helper, that are always present from shortly after a Mac starts up until it shuts down. Unlike traditional Unix logs, the Unified log is maintained so its size remains fairly constant, with the main folder of log files, Persist, taking up a little more than 500 MB, and the whole of /var/db/diagnostics coming to about 1.5 GB.
logd does this by working through all the individual entries in the log files and removing those that have passed their retention time. It thus preserves more important entries for longer, and prevents the logs from growing uncontrollably. The unfortunate side-effect of this is that Macs that are making copious log entries have logs that don’t go back long in time. At its worst, that might mean that they may only last a few hours before logd removes them.
Although the Console app provides limited features for accessing your Mac’s log, and the great majority don’t want to go near it, the Unified log has important contents. Among those are reports by Time Machine on its recent backups, and those from XProtect Remediator on its scans to detect and remove malware. It’s also the place where all significant errors and failures should be recorded. Remove the main log files and those all disappear. Apple also may ask for and use recent log records when investigating problems you report to Apple Support or, for developers, using Feedback. Even though you may not want to browse the log yourself, it’s important and not a feature you should throw away.
Housekeeping
Spending a little time every month or so doing the housekeeping on your Mac is an excellent and rewarding investment of your time. When I do this, I like to preserve those logs that might still be significant, including the inevitably copious files written by Adobe’s multitude of services, and anything that still appears to be active. But those that haven’t been modified for the last year or so should be disposable, and any from apps I no longer use can be cleared away without fear. However, I never interfere with the Unified log in /var/db/diagnostics as I know that logd cares for that constantly, and much better than I can.
I’m well aware that many feel that they can delegate the responsibility of housekeeping to an app, now typically one they pay a substantial subscription for. Just as I wouldn’t pay someone to come and work through all my personal papers and records, destroying those that they thought I didn’t need, I will never use an app that does the same with my Macs. If the housekeeping app you use deletes log files, particularly if those could include those of the Unified log, then I’d consider that to be malicious, and proof that the app’s developers don’t understand how macOS works.
And that’s why some discover that those vital logs have been destroyed, and they can’t run the checks built into several of my apps, including the records of XProtect Remediator’s security scans.
Recommendations
Users: perform housekeeping as a routine, particularly on disused and unnecessary logs in ~/Library/Logs. Never interfere with logs stored in /var/db/diagnostics.
Developers: avoid writing your own logs. If your software really has to, ensure that it performs its own housekeeping, and inform the user in its documentation.
Apple: if the Unified log can’t be unified, improve it and make it fit for purpose.
我其实对 Hugo 不熟,不知道这算不算重新发明了一遍轮子。但我搜索「如何在 github 上,用 hugo 架设自己的 blog?」时,搜到的教程,都需要用户在自己的电脑上,安装运行各种 git 和 hugo 的相关命令,感觉对新手并不友好。所以,我试着写了一个流程,让新人完全只需要在网页浏览器上操作,就能快速生成自己的 blog 网站。
在这次「封面图事故」之前,我就有换新的的想法了。一方面确实是,在日常写作和新增一些页面时会明显感觉到这种技术上的代际差,只是自己懒得动,能用就不改。我相信大部分程序员也是这么想的,代码屎山不就是这么回事嘛。但如果只是换个模版,其实不用想那么久,所以另一方面更核心的是,我在同时考虑把博客的套餐升级到 Explorer 版,还想提前买下后面几年的域名使用权,因此,在我心里,模版的更新、升级、域名这三件事是合并在一起考虑的。
作为童年爱好,这个 blog 曾经把「摄影」作为一个二层分类的顶端,下面包括很多细微的分类:拍的照片、心得、理论讨论……甚至还有过一个摄影 blog,后来停掉了,也没有合并过来。这边还多多少少留了些,就先堆在这里。——所以心中还是对此有爱的吧。要知道,连 IT 类原创都没资格独占一个分类,而是胡乱塞进 /tech /fyi /misc 里面……
In the past, my blog was hosted on Tencent Cloud using Typecho. Unfortunately, due to unforeseen circumstances, I lost ownership of that machine along with all my previous posts. Consequently, I took a hiatus from blogging, remaining in a state of silence for a few years. However, I now realize the importance of reviving my blog before lethargy engulfs me.
After conducting extensive research and considering various platforms such as Ghost, WordPress, Typecho ,Hugo and some other platforms, I finally settled on Ghost. Its remarkable speed, plethora of customized themes, aesthetically pleasing web user interface, and integrated membership system influenced my decision.
Check out all the cool stuff Ghost has to offer on their website below:
Due to the absence of Ghost in the NixOS packages, and the cumbersome nature of adapting it into a NixOS service, Docker has emerged as an excellent solution for hosting Ghost. Here, I have provided a comprehensive breakdown of the steps I followed to set up a blog using Ghost with Docker on NixOS. This can be modified to use on other platforms.
Step 0: Enable Docker on NixOS
Enabling Docker(Podman) on NixOS is a straightforward process, requiring modification of just one configuration file. I personally prefer using the vim editor, but feel free to use your preferred tool such as nano, emacs, or VS Code.
The initial step involves logging into the machine, particularly if it is being used as a server.
ssh ${username}@${server IP}
Then, we can start to modify the configuration file:
sudo vim /etc/nixos/configuration.ni
There are two ways of adding Docker to the NixOS system: for all users:
environment.systemPackages = with pkgs; [
  docker
];
And for one user only:
users.users.${username}.packages = with pkgs; [
  docker
];
You can choose either way based on your needs. The next step is to enable the Docker service.
Note that we're using oci-containers to control Dockers. If you have chosen to install Podman, remember to modify it accordingly. Some may question why we're not using docker-compose; this is a simple answer – we embrace the capabilities of NixOS, and that suffices.
Last, remember to create a directory for docker to use. Here's my example:
mkdir ~/.docker
Step 1: Set up Docker Network
Using the Docker CLI command docker network will indeed create the network, but it may not be the optimal approach. Since we're operating within the context of NixOS, we can add it as a service. Add the following code snippet to your configuration.nix file, ensuring to customize the name according to your requirements. In my case, I'm utilizing npm as an example since I'm employing nginx-proxy-manager as my Nginx reverse proxy service.
systemd.services.init-docker-ghost-network-and-files = {
  description = "Create the network npm for nginx proxy manager using reverse proxy.";
  after = [ "network.target" ];
  wantedBy = [ "multi-user.target" ];

  serviceConfig.Type = "oneshot";
  script =
    let dockercli = "${config.virtualisation.docker.package}/bin/docker";
    in ''
      # Put a true at the end to prevent getting non-zero return code, which will
      # crash the whole service.
      check=$(${dockercli} network ls | grep "npm" || true)
      if [ -z "$check" ]; then
        ${dockercli} network create npm
      else
        echo "npm already exists in docker"
      fi
    '';
};
Step 2: Set up Mysql for Ghost
We will now proceed with crafting Docker configurations. The initial step involves creating an external directory for MySQL to store its data, ensuring that we can modify MySQL without accessing the Docker environment directly. At present, this MySQL database is exclusively intended for Ghost; however, you have the freedom to tailor it according to your specific requirements.
mkdir ~/.docker/ghost-blog/mysql -p
Please add the following snippet to your configuration file as well:
Within this section, we configure the port mapping, environment variables, and volume mapping. Please note that you should customize the MySQL configurations in accordance with your specific setup in the final step.
Mail Server Set Up
Taking Gmail as an example, please note that you can modify this configuration according to your specific needs.
Please remember that the Google app password mentioned here is different from your actual Google account password. You can generate a Google app password by following the steps outlined in the Sign in with app passwords guide.
By configuring these settings, visitors will be able to sign up and leave comments on our website.
More Custom Options
Please refer to the instructions provided on the Ghost website at the following link:
There are numerous articles available on the internet that explain how to set up Nginx as a system service or utilize nginx-proxy-manager as a Docker service. For the purpose of this example, I will demonstrate the Docker service approach. Remember to create the necessary folders as well.
但我看到这个问题时,首先想到的,一个很重要的因素:大概是因为,这个站就一直在这儿吧~ 我的技术能力,不需要花什么额外的精力,就能让这个 blog 一直存活下去。于是,想写东西的时候,这里始终有个地方,可以让我写。
——也有很多时期,是完全写不下去的,长时期没法去面对、去反刍自己的生活;然而也没必要因此而关站,就让 blog 存活在那里,终归是个表述的出口。大概是因为,我也是希望,自己能够从那些「无法整理自己」的状态中,渐渐走出来,回复到可以写东西的状态吧。所以站点的持续存在,满重要的,因为确实能感觉到,想写点什么的时候,如果没有这么个站,又或者需要自己重新架一个,可能也就不写了……
这种「随时可以在站点写东西」的状态,也影响着对 blog 平台的选择(怎么又拐到技术贴去了?好吧,之前也一直想吐槽这方面,就顺带提一下)。这些年一直有 〖wordpress vs 各种静态博客〗哪个更好的争论。双方确实各有利弊。总体来说,静态博客最大的优点就是……省钱,可以薅 github、vercel 之类托管网站的羊毛。但另一方面,静态博客每次发布、或者修改一篇文章的过程,其实满折腾的。通常情况下,它需要
好像也是可以通过一系列操作,实现用浏览器某个网站上编辑文章,然后自动编译发布到托管网站的。我没有仔细去关注。但是,如果把 blog 的生命周期,放到 5~10 年这个尺度上,那么这些网站之间的复杂依赖关系,很大程度上是不靠谱的。譬如我已经看到好几个静态 blog 的外挂评论系统,不知为什么不工作了……总之,相比之下,我可能更宁愿去使用那些免费带广告的 blog 平台。
我对写 blog 的新人的推荐,一直是——
如果有技术能力、也有服务器的话,自建 wordpress;
或者找人蹭一个。如果我们比较熟,你可以去买个域名,把 blog 挂在我的服务器上。这并不是很大的负担。(ps,个人 wordpress 小站,是可以不必安装开销很大的 mysql 数据库的);
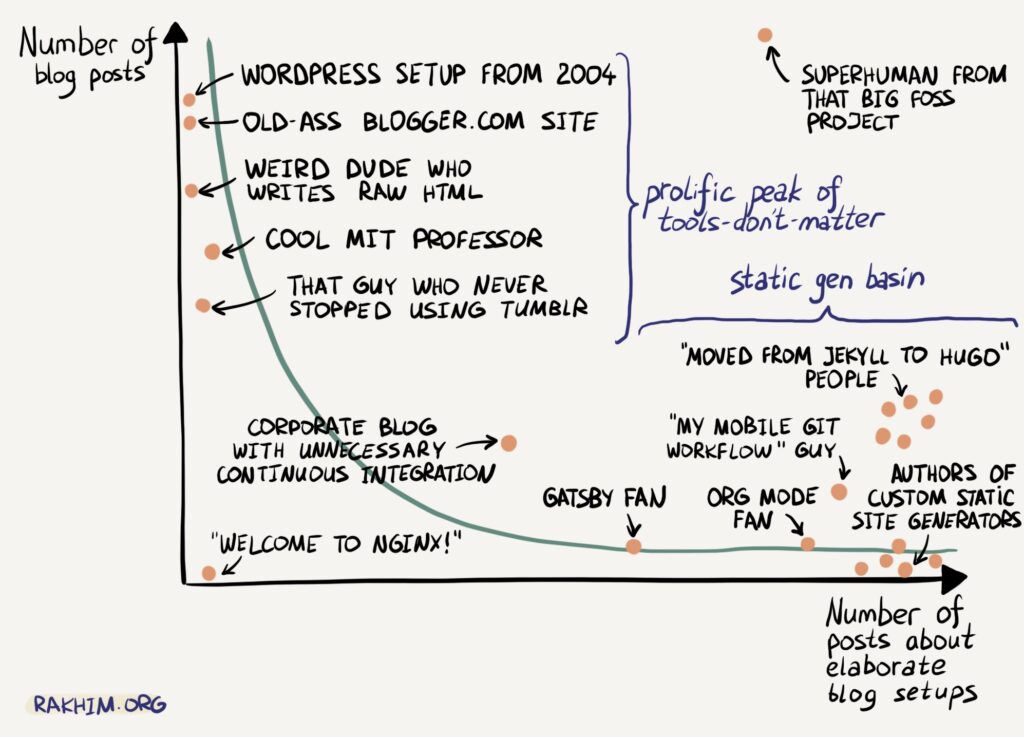
转一张图,对于熟悉这十几年来 blog 平台变迁的人,应该会很搞笑:用不同工具写 blog 的人,(写 blog 文章)vs(写关于怎么配置 blog 的文章)的对比。右下角那些术语,都是在各个年代,需要各种不同程度的折腾的,静态 blog 方案:gatsby、org mode、jekyll、hugo、git workflow……