Reading view

There are new articles available, click to refresh the page.

A brief history of logs and Console

System logs seem to have been introduced with Mac OS X in 2000-2001, and I don’t recall any equivalent in Classic Mac OS, although individual apps such as databases often kept their own logs.

2000-2016 text logs

As Mac OS X presented itself as a derivative of Unix, it brought with it bells and whistles such as support for code to write to system-level logs including system.log, console.log and dozens of other more specialist destinations, and its own log browser in the Console app.

console2001

As is traditional, log entries contained unstructured plain text to which a datestamp and other data were added to expand each into a line of text in log files that were rotated daily. As entries were relatively infrequent, many users learned to read the log and to use it to diagnose problems.

console2001b

The Console app gave ready access to all standard logs as well as app-specific ones, such as this for mail processes such as sendmail, and crash reports. These two screenshots are from Mac OS X 10.0 Cheetah in April 2001.

console2005

By Mac OS X 10.4 Tiger in 2005, Console had acquired some basic tools and a sidebar to select from the many logs. Because they were plain text, those for previous days were compressed and stored in archives until they were removed during routine housekeeping. This excerpt shows entries in the system log over a restart that took over 2 minutes from the last entry to the start of the boot process.

logmaster

There has also been the rare substitute for Console: this is LogMaster from Bright Light Software, shareware for $14.50 in 2006 until it was abandoned.

console2011

Although much in Console remained the same until 2016, at some stage Apple structured log entries into fields, as shown here in Mac OS X 10.6 Snow Leopard. Log entries were still infrequent, with this excerpt covering a period of almost 20 seconds.

Console showing log entries for a typical restart.

This is another restart, here in OS X 10.10 Yosemite in April 2015. This time, the period recorded for that restart has fallen to 39 seconds. System shutdown is marked by the shutdown process and SHUTDOWN_TIME, and startup begins with BOOT_TIME.

2016 Unified log

With macOS Sierra in 2016, that was all swept away and replaced by the Unified log. There had been warning signs that change was coming: in May of that year, I complained that the log consisted of a torrent of messages like
17/05/2016 21:04:40.175 storeassetd[531]: multibyte ASN1 identifiers are not supported.
or
17/05/2016 20:55:15.298 WindowServer[233]: _CGXRemoveWindowFromWindowMovementGroup: window 0x91 is not attached to window 0x92
Even when running a fairly clean installation of El Capitan, All Messages clocked up around 4000 entries every 8 or 9 hours. At its worst, the log could fill those 4000 message slots in a minute or two. Little did we realise how busy our logs were about to become.

Apple declared the goals of its new log system at WWDC in June 2016:

  • a single efficient logging mechanism for user and kernel mode;
  • to maximise information collection with minimum observer effect;
  • the compression of log data;
  • a managed log message lifecycle;
  • as much logging on as much of the time as possible;
  • for privacy to be designed into the logging system;
  • a common system across macOS, iOS, watchOS, tvOS;
  • all legacy APIs (NSLog, asl_log_message, syslog, etc.) to be redirected into the new unified log;
  • to emphasise debugging of macOS and apps, not providing any facilities for system administration or audit;
  • to link to the sysdiagnose tool for gathering information for bug reports etc.

To achieve this, a log entry is made using a new call that’s handled by the logd daemon and compressed into a buffer. From there it’s either retained in memory if ephemeral, or written out to a file.

mul102LogdFlow

There are two main groups of files that store log entries: those kept in /var/db/diagnostics/Persist/ in the form of tracev3 files containing regular log entries, and further tracev3 files in /var/db/diagnostics/Special/ containing additional shorter-life entries. Additional and lengthier log data can be stored in files named by UUID in /var/db/uuidtext/, and there’s also scope for high-volume collection.

tracev3 files use a proprietary compressed binary format that remains undocumented to this day, but has been partially reversed. Apple doesn’t provide direct access to their contents, only through closed-source utilities such as the log command tool. Where users want a more portable format, Apple recommends conversion to a logarchive package, although that’s also undocumented and only directly accessible using log and Console. Apple has in recent years given limited access to the active log for third-party apps, but that lacks many of the useful features of its own log command.

Privacy

Privacy features have caused problems from the start. Log messages containing potentially sensitive information have that censored by <private>. Like so many good ideas, this had unintended consequences as many log entries only contain the dreaded <private>, and in some cases meaningful content is lost altogether.

Ironically, the most embarrassing security problem in the Unified log occurred in early versions of High Sierra, when encryption passwords were leaked apparently as a result of incorrect string formatting. Apple subsequently added an entry field to make explicit the formatting used for that entry.

Until the release of Catalina, there was an undocumented switch to turn privacy protection off, through an option to the log config command. When you needed to view all those censored messages, you could turn protection off, perform the test, and the log then contained all the information you required. That changed in Catalina 10.15. In order to bypass this privacy protection, you had to run your Mac in a special diagnostic mode intended for use exclusively by Apple engineers. Apple later relented and allowed this to be controlled through a profile, although because entries already made don’t contain the censored data, it can’t be applied retrospectively.

consoleserrors

When first released, access to the new Unified log wasn’t restricted to admin users, but that changed in macOS 10.12.4, when that restriction was applied, and normal users found they were no longer able to browse the log at all.

Problems

The biggest disappointment, though, has been the Console log browser, which has made only limited use of log entry structure, displays just a small selection of entry fields, provides little aid for the high volume of entries, and worst of all gives no access at all to recent entries in the live log. Apple’s decision to restrict Console to browse the live stream of entries and logarchives has rendered it useless for many of the most compelling reasons for the app, but it has ensured that Console and the log provide no “facilities for system administration or audit”. It has also deterred third-party developers from writing to the log, and made it the exclusive preserve of Apple’s engineers, which perhaps was the original intention.

Since its first release in macOS Sierra, the log has flourished if not grown like an invasive weed. The number of fields available has increased from 16 to over 25, many of them added to support Signposts, introduced in late High Sierra and Mojave. Those are used extensively in macOS primarily to measure performance.

As the log now rolls its tracev3 files to maintain a maximum total file size, rising rates of entries by macOS have limited the period covered by retained entries. What in the early days was sufficient for up to 20 days of entries may now last little longer than a few hours. This also ensures that Console has more limited usefulness, and it struggles to cope with logarchives of any size.

console2024

Collection and retention of entries from different subsystems is set in logging profiles, XML property lists stored in /System/Library/Preferences/Logging (in the System volume, so read only) and /Library/Preferences/Logging, which the user controls. You can create your own custom profiles, or modify them on the fly using the log command, although this appears unusual even among the few left who can and do still browse the log.

What used to be a primary tool in diagnosing problems has been abducted without replacement. At least it keeps those pesky system administrators and auditors away.

Last Week on My Mac: Tuning for performance

Perhaps the greatest subversion of EVs is their threat to car culture. Over more than a century, modifying and tinkering with internal combustion engines has become a popular obsession, and grown a huge industry devoted to tuning for performance. Replacing those lovingly crafted vehicles with battery-powered appliances seems too much to bear for all those enthusiasts.

Half the Mac articles posted here last week are about improving performance, whether in the CPU cores of the M4 or when connecting to external displays and storage. In comments we compared predictions, benchmarks and experience in our quest for improvement. Most telling, though, are those who report little improvement in the software they use to earn their livelihood, products that have been central to Macs for decades, such as Adobe Photoshop since 19 February 1990. If all that engineering effort has had so little effect, there’s something seriously amiss.

There’s much to be transferred from our experience of tuning vehicles to improving the performance of our apps. First is the appreciation that benchtests don’t necessarily translate into what happens on the road. Second is the need for objective measurements to assess performance relevant to our aims. Third is use of a systematic approach to improvement, in recognising where bottlenecks or constraints are, and addressing them methodically.

Benchtests

When each new Apple silicon chip becomes accessible, there’s a race to post its first Geekbench results and thereby demonstrate how performant it is. YouTube is now filling up with demonstrations of impressive or disappointing figures shown on the dials of Blackmagic speed tests on Thunderbolt 5 devices. It’s significant here that the Blackmagic test displays analogue meters taken from those on traditional car dashboards.

Few ever drill down and ask what those numbers returned by Geekbench mean, nor the relevance of disk speed tests to situations where transfer to or from storage limits app performance. Although Primate Labs provide details of the compendium of tests used to calculate Geekbench scores, it’s impossible to know how those might compare with code run by the apps we use. A Mac with impressive benchmark scores can still be dog-slow when running our daily tasks.

Blackmagic Disk Speed Test appears to report write and read speeds measured for a single file size of 5 GB, but tells you little about how storage might cope with large numbers of smaller files, or those much larger. As results vary between tests, it needs some method of providing the best estimate for a series of results, and a measure of the confidence in that number. As a quick, fun method of checking whether storage is up to the task of recording and playing back video files, it’s ideal, but it’s neither intended nor suitable for more general purposes.

Objective measurements

Subjective assessments are widely known for their power to mislead. If you ever want the thrill of your life, ride a recumbent trike at anything over 30 miles an hour down a steep and winding hill. Because your bum and eyes are so much closer to the road surface it feels like three times that speed in a car. You can see similar effects in non-linear progress bars. When they’re slow to start with and accelerate rapidly from midway on, they appear quicker than the reverse, with an apparently interminable wait for the last ten percent to complete.

My heart sinks when someone tells me that something is slow without being specific about what that something is, and providing numbers to support that impression. The only objective assessments are quantitative, in numbers rather than feelings.

But those numbers must also measure something meaningful. In the past we’ve tried simply timing how long a Mac takes to start up, or to launch an app, as if that’s what we spend all day waiting for. When you only launch an app once a day and restart your Mac every couple of weeks, who cares whether those take a few seconds more or less?

Ideally, you need to identify tasks that you have to wait for repeatedly, with discrete instants at the start and end that are separated by several seconds at least. Those can then be timed fairly accurately and reproducibly to form your own task-specific performance benchmark. Then when you come to the stage of testing out the effects of different settings and hardware, you can compare those times. This could become a bit more technical; when assessing the performance of the macOS Unified log, for instance, I’ve calculated the time in nanoseconds between log entries, but that level of precision is rarely needed.

Identification

Armed with comparisons of the time to perform relevant key tasks, we must then analyse what’s involved in each and determine which step is rate-limiting. Most tasks involve several stages, perhaps starting with reading of data from storage into memory, then processing that and displaying an outcome. Those in turn depend on effective read speed, memory capacity and access time, and a host of operations in CPU cores, GPU and possibly other units in the chip.

The key to understanding performance is Activity Monitor, in its different views. Developers also use Xcode’s valuable collection of Instruments, there are also Signposts widely used in the log, and if you really want to hone in on what’s happening in processor cores there’s always powermetrics. But well before you risk getting lost in those weeds, observations in Activity Monitor should provide a good picture of what’s going on, and where delays are occurring.

Activity Monitor does have its pitfalls, as with any other method of investigation. Perhaps its greatest shortcoming on Apple silicon Macs is in not displaying or taking into account frequencies of the two types of CPU core, but at least its CPU History window does show which type of core is bearing the brunt.

Goal

Behind all this is the need for a more critical approach when tuning our Macs for better performance. Fitting a new exhaust system to a car might make it sound good, but unless you go to the trouble of tuning it for performance, it might actually be slower on the road, all bark and no bite. Unlike Apple’s devices, our Macs haven’t become appliances, and in coming articles I’ll explore how you can tune yours.

How to browse your Mac’s log from months ago

I hope you like magic tricks, as this article shows how you can do the impossible with your Mac’s log: browse log entries from the distant past, from months or years past. My example is taken from my new Mac mini M4 Pro, which I set up on the afternoon of 8 November 2024, 19 days ago. To demonstrate that this isn’t a screenshot taken earlier, I’ve included a calendar widget to confirm that this was taken on 27 November, when all its logs from 8 November had gone.

logarchive

That log extract contains entries made by Migration Manager when it was busy migrating from a backup to my new M4 Mac. As that’s so long ago now, those entries have since been removed from the log files on my Mac. So how did I do that? The answer, of course, is in a Time Machine, with a little help from my free log browser Ulbow.

Accessing old logs

There are three different ways you can access the macOS Unified log:

  • the live log, with entries displayed as they’re written to the log, as you might in Console;
  • the active log, where you browse the entries currently saved in the log, including those made in the recent past, which Console can’t help you with, but Ulbow is designed to do;
  • an archive copy of the log, where you can browse entries from the log at the time that archive was made.

Logarchives are structured bundles containing log and other files normally stored inside folders in /var/db, collected at a given moment. You can create them using the log collect command, but that only works with the active log on your Mac. One simple way to create a logarchive is to run a sysdiagnose, whose output files contain a logarchive of your Mac’s active log files. However, log collect can’t turn an arbitrary collection of log files into a logarchive, that’s something only Ulbow can do. If you can feed it the right log files, say from a backup, then Ulbow will turn them into a logarchive ready to browse in Ulbow.

To do this, you’ll need a Time Machine backup of the Mac’s Data volume. Backups made using other utilities should also work, provided they contain the required directories in /var/db.

Ulbow’s Logarchive Tool

To create a logarchive from a copy of the log files, open the Logarchive Tool in Ulbow’s Window menu.

logarchive4

Prepare the log files by creating a new folder and copying two folders from the backup of the Mac’s Data volume to it: /private/var/db/diagnostics and /private/var/db/uuidtext. The former contains the log files and their supporting data such as timesync files, while the latter is a collation of supplementary content arranged by UUID. I like to name that folder and the logarchive itself using the Time Machine backup timestamp to remind me of the last date and time of entries in that logarchive.

Click on the Make Logarchive button, select the enclosing folder, and Ulbow will do its best to turn those into a logarchive bundle, on external storage if you wish. You can then Catalogue that, Analyse its contents, and open it for browsing in Ulbow.

To browse those log entries, open a New window in Ulbow, then open the logarchive using that command from the File menu. Once you have made a logarchive, you can also open individual .tracev3 log files within it. The only difficulty with these is discovering an appropriate time to start browsing from. For that, the statistics supplied when you Analyse the logarchive are invaluable.

logarchive5

As Apple has never published a specification for logarchive bundles, this may not work in every case, but in my experience it can even create a usable logarchive when some of the logs are missing. It should also work for the equivalent folders obtained from an Apple device, such as an iPhone or iPad.

Summary of what you need

  • A Time Machine or other backup containing log files in /private/var/db/ for the period you want to browse.
  • Ulbow’s Logarchive Tool from its Window menu.

在 github 架设 hugo blog(纯浏览器操作)

我其实对 Hugo 不熟,不知道这算不算重新发明了一遍轮子。但我搜索「如何在 github 上,用 hugo 架设自己的 blog?」时,搜到的教程,都需要用户在自己的电脑上,安装运行各种 git 和 hugo 的相关命令,感觉对新手并不友好。所以,我试着写了一个流程,让新人完全只需要在网页浏览器上操作,就能快速生成自己的 blog 网站。

所有操作都在 Github 这个项目上进行:
https://github.com/fivestone/hugo-papermod-beginning

这个项目本质上,就是搭了一个空白的 hugo 网站,让用户 fork 到自己的账户下,设置一下就能直接使用。对功能和界面有什么额外要求的话,请自行学习 hugo 的进阶教程。——然后你们就不是需要用这个项目的新人啦~

  • 本项目基于 hugo 博客引擎,和流行的 PaperMod 主题
  • 在 github 上建立的 blog,在墙内是不能直接访问的,需注意

1. 创建 github 账号

首先,注册自己的 github 账号,过程略。注册过程中,你设置的账户名 username,通常就是最终的网站地址 username.github.io,当然以后也可以把自己的域名映射到上面。

2. 架设自己的 blog 项目

注意,这一步,有两种方法

  • 第一种方法:你建一个全新的项目,下载我提供的 .zip 文件,解压后,再手动上传到你的项目。和第二种相比,稍微繁琐一点。但还是希望大家,有条件的话,使用这种方法。
  • 第二种方法,把我的这个项目,fork 到你的项目。这种方法对新人更简便,完全不需要在本地操作文件,只用手机或 pad 就可以完成。但这种 fork 在一起的项目,在进行自动发布 blog 的操作时,是共享同一个操作额度的。如果 fork 的人数非常多,未来可能会被 Github 限制。——要达到这种规模,大概要几千人同时用吧……所以也不需要很在意。
2.1. 第一种方法

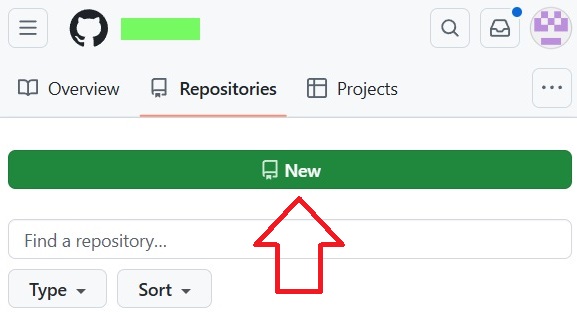
注册并登入账号后,新建自己的项目(Repository)。

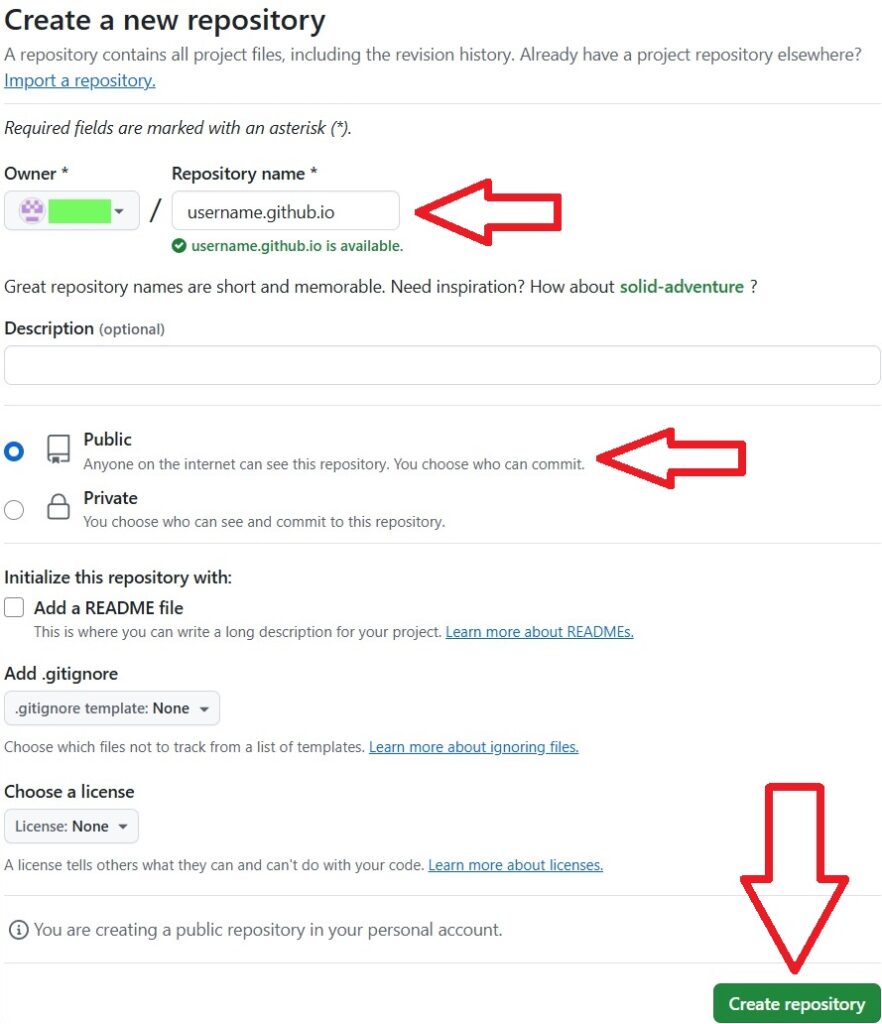
项目的名称,决定了最终 blog 的网址。假设你的 github 用户名为 username

  • 如果把项目命名为 username.github.io ,则最终的网站地址为
    https://username.github.io/
  • 如果把项目设置成其它名字,如 new-name,则最终的网站地址为
    https://username.github.io/new-name

确认项目为 Public。其它设置都不需要更改,点击绿色按钮创建。

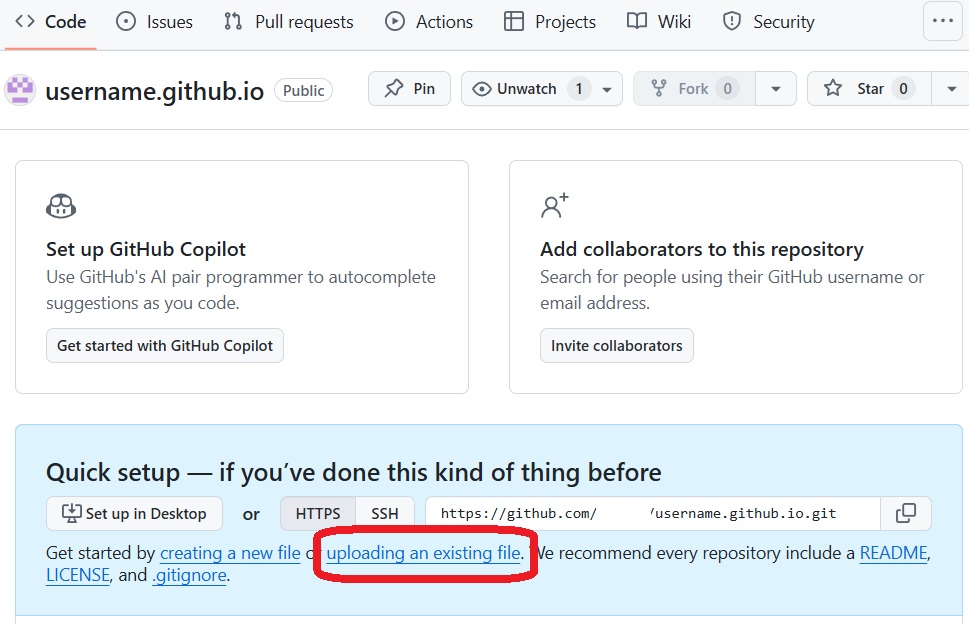
创建项目后,点击「上传已有的文件」

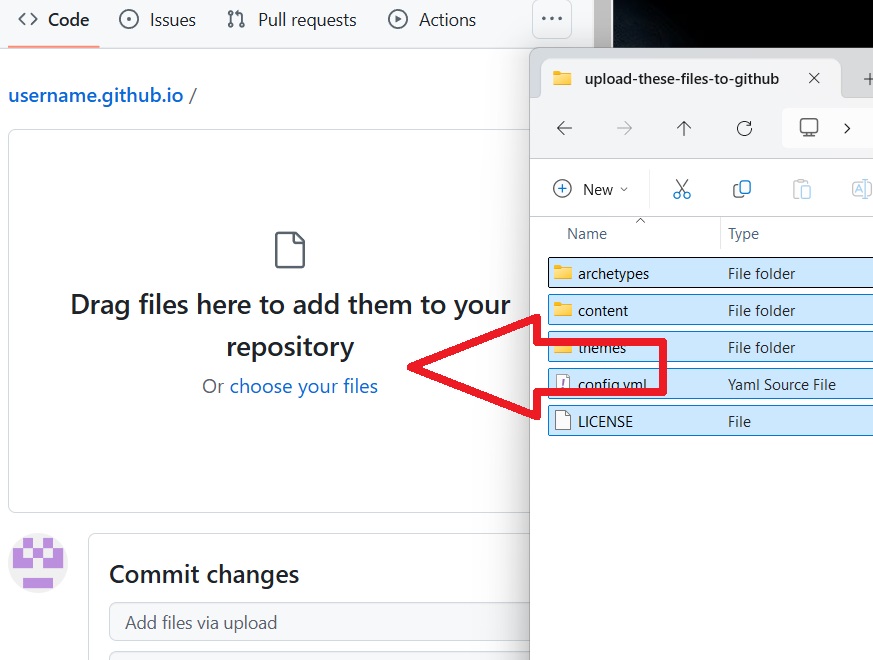
我的 github 项目,下载已经设置好的 hugo 文件包,在本地解压缩 .zip 文件。然后,把里面的所有文件,拖拽上传到你的项目里。

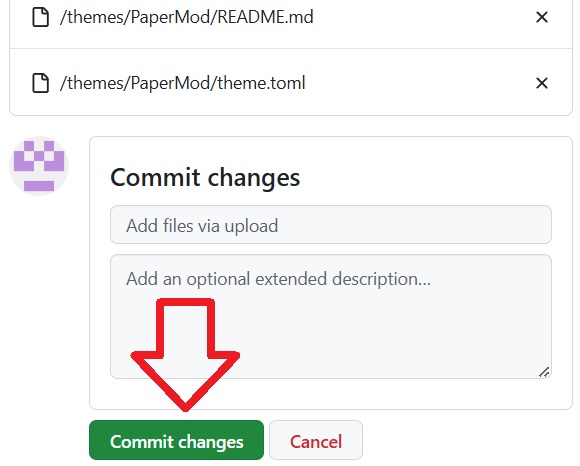
等到 80 多个文件都被上传后,别忘了点击页面底部的 Commit changes 提交。

2.2. 第二种方法

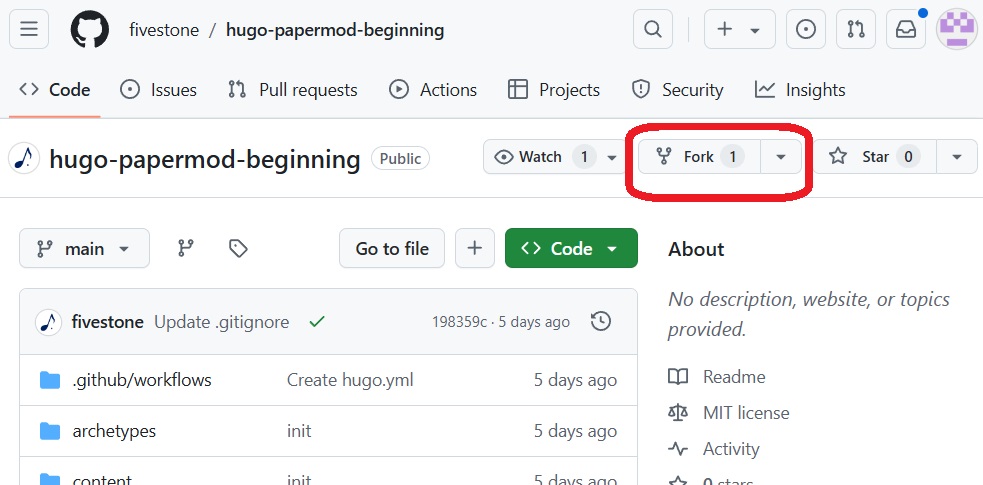
注册并登入账号后,进入项目:
https://github.com/fivestone/hugo-papermod-beginning
点击 Fork,将这个模板复制到你自己的账号下。

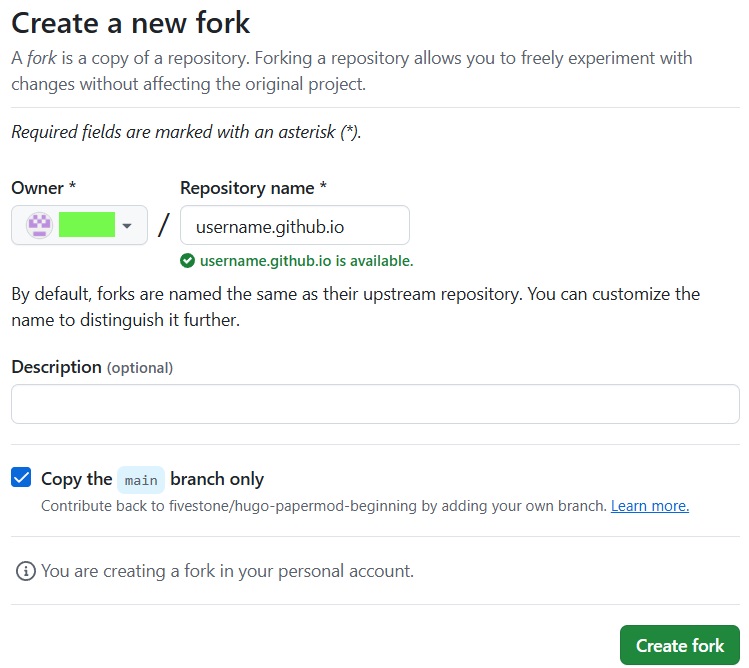
和第一种方法一样,这里需要设置你自己的项目名称,假设你的 github 用户名为 username

  • 如果把项目命名为 username.github.io ,则最终的网站地址为
    https://username.github.io/
  • 如果把项目设置成其它名字,如 new-name,则最终的网站地址为
    https://username.github.io/new-name

然后点击 Create fork 创建项目。


3. 配置自动发布 blog

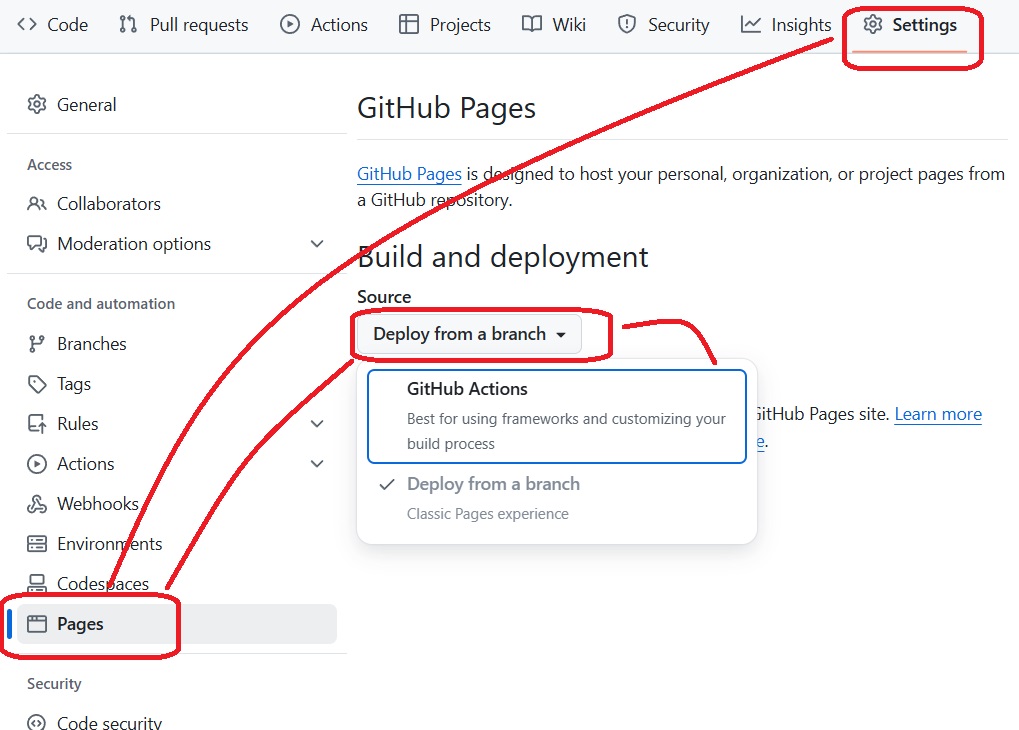
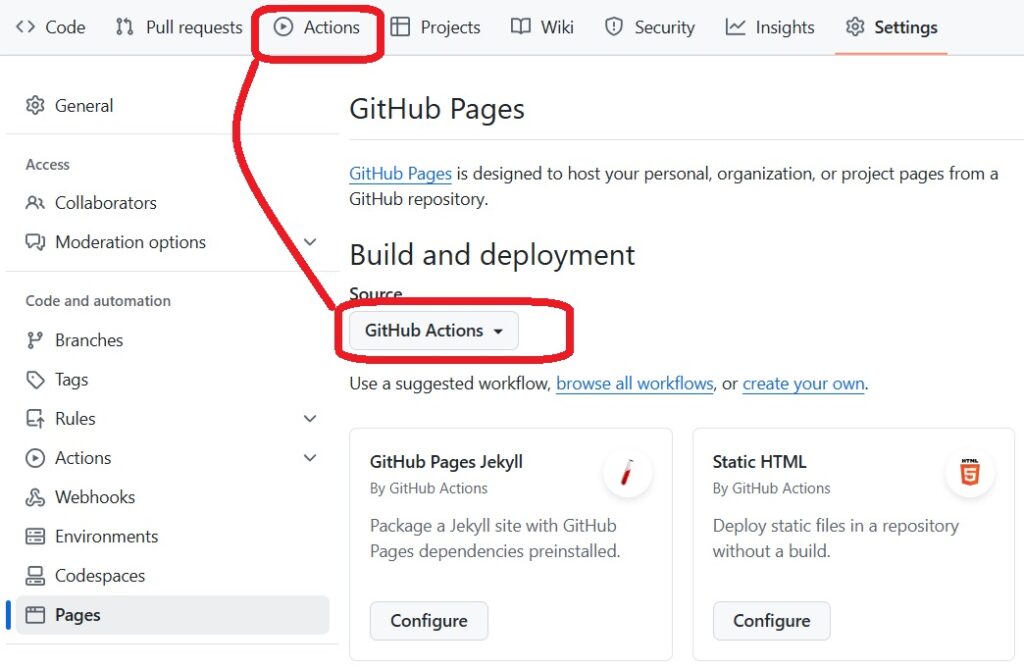
创建新项目后,进入项目的 Settings – Pages 页面,把 Build and deployment – Source,改为 GitHub Actions。

把 Source 从 Deploy from a branch,改为 GitHub Actions 后,进入上方的 Actions 页面。

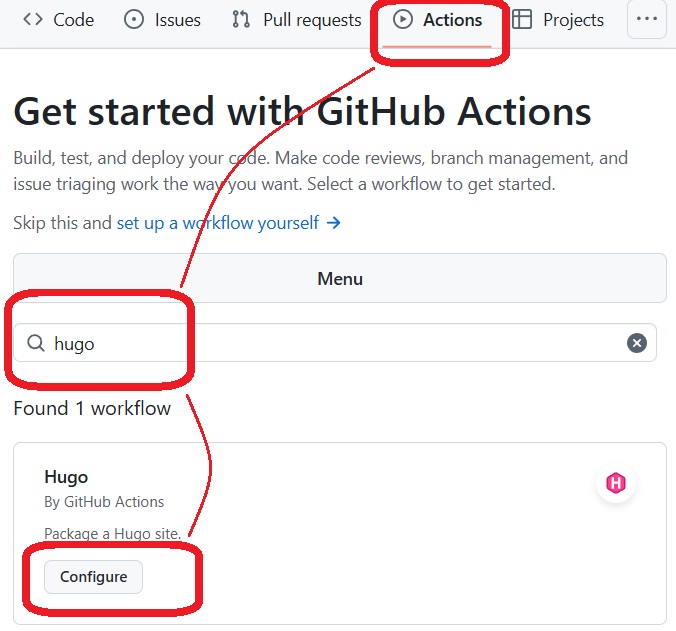
初次进入 Actions 页面后,会显示 Github 预设的各种配置方案,通过搜索框找到 hugo,然后点击 hugo 方案中的 Configure

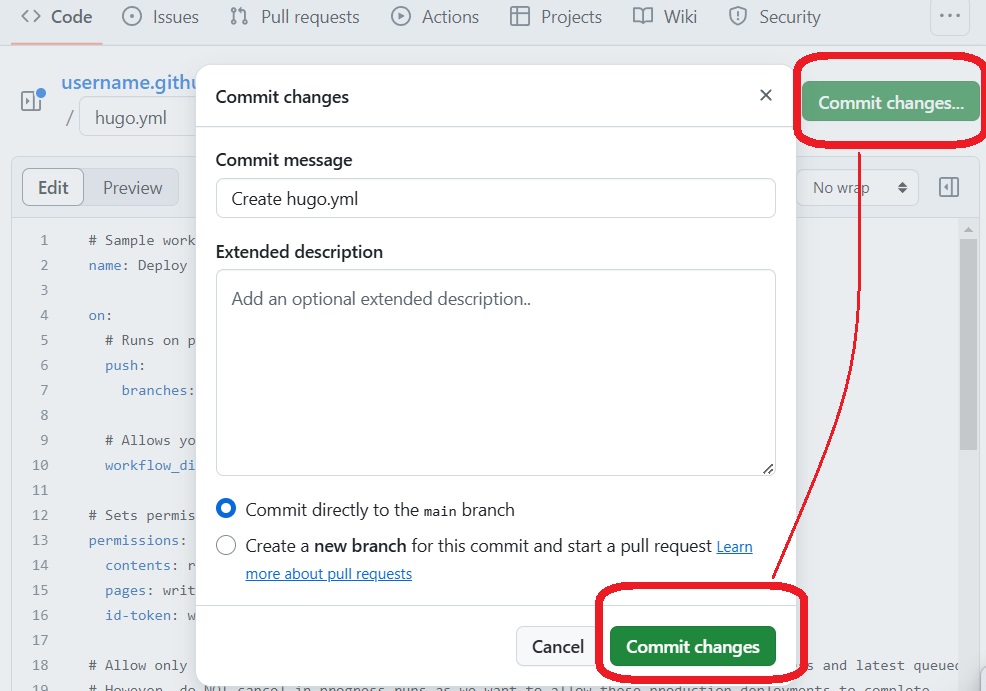
系统会自动生成配置文件,不需要做任何改动,点击绿色的 Commit changes 提交。

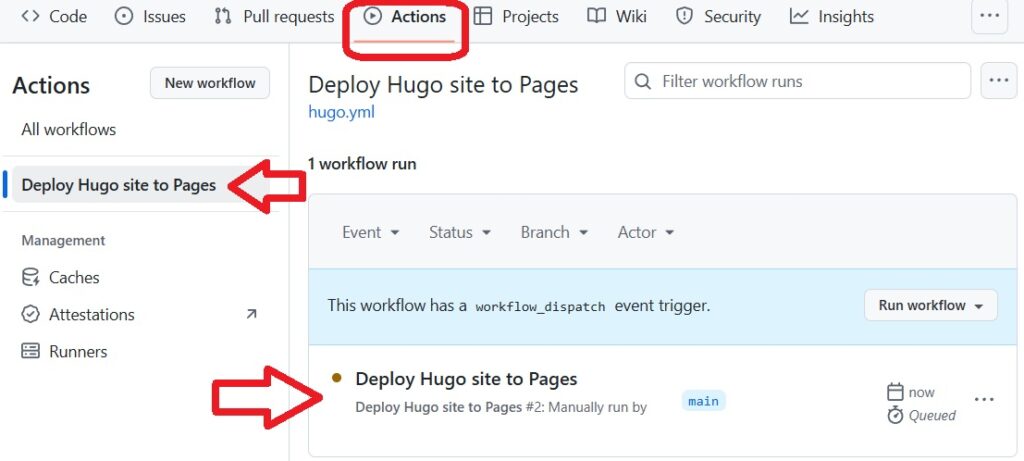
此时自动发布的 action / workflow 就已经开始运行了,大约 1~2 分钟后,就可以在
https://username.github.io 看到 blog 最初的页面了。

以后,每次对项目里文章或配置文件的更改,都会触发这个 action / workflow,重新生成一遍网站。可以在 Actions 页面,查看 workflow 每次运行的情况。


4. 更改网站基本信息

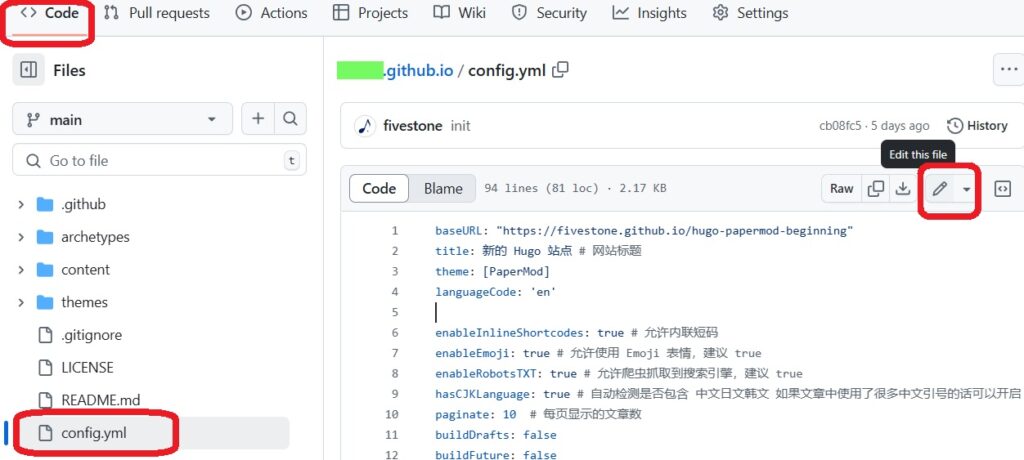
在 Code 页面,点击编辑 config.yml 页面,把一些预设的网站信息,改成你自己的信息。

对新人来说,需要在 config.yml 文件里更改的,大概有以下几项:

baseURL: https://username.github.io/ # 改成你自己的网址
title: 网站名称
params:
  author: somebody # 作者的署名

  homeInfoParams:
    Title: 网站标题,只显示在首页上
    Content: >
      显示在首页标题下方的一些文字。</br>
      支持一些简单的 html 和 markdown。

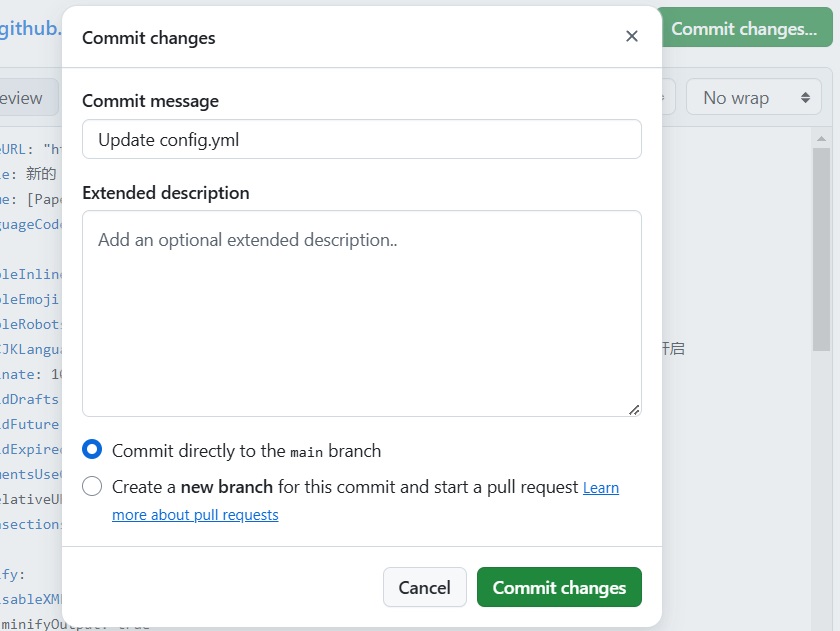
更改后,点击绿色的 Commit Changes… 在弹出的页面中,再一次点击绿色的 Commit Changes,保存文件后 1~2 分钟,就可以在 blog 页面上,看到更改后的内容了。


5. 添加、管理文章

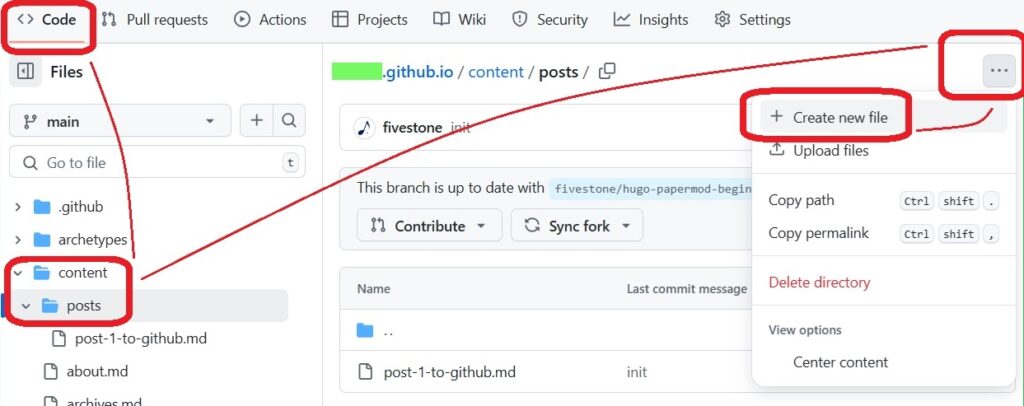
所有的 blog 文章,都在 content / posts 目录中。在 Code 页面,进入 content / posts 目录。点击右上角,创建新文件。

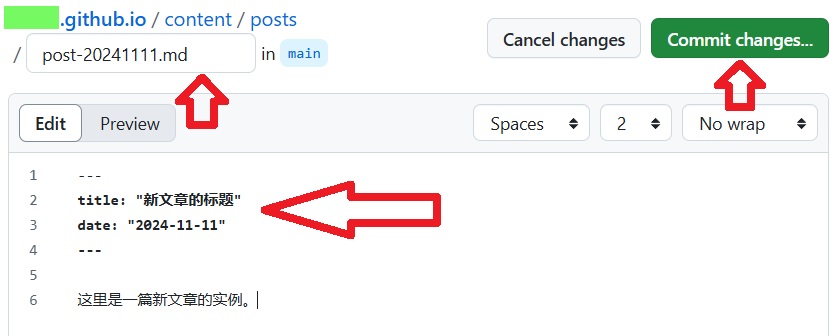
所有的文章,均为 .md 结尾的 markdown 文件。文件名对应着这篇文章的网址,譬如,post-20241111.md 文章链接,就是
https://username.github.io/posts/post-20241111/

在文件的开头,如图所示,写入用 — 隔开的,文章的标题和发布日期。

---
title: "新文章的标题"
date: "2024-11-11"
---
然后开始写正文,markdown 格式。

同样,点击绿色的 Commit changes… 保存提交。1~2 分钟后,就可以在 blog 页面上看到新文章了。

content / posts 目录里的所有文件,都可以随意地新增、删除、修改、重命名文件。对应着 blog 文章的增删改、和改变 url 链接。

文章内嵌的图片,建议放在 static 目录下,然后在文章中用 markdown 格式引用。譬如 static / aa.jpg 文件,相应地在 markdown 文件中插入的代码为:

![](https://username.github.io/aa.jpg)

有经验的用户,也可以使用其它更有效的组织方式。


6. 其它注意事项

  • 生成的 blog 对应的 rss 订阅地址为
https://username.github.io/index.xml
  • 如果是用第二种方法,直接 fork 的项目,以后在这个 blog 项目里,会一直看到,图片里这样的消息,提示要把你对项目的更改,反馈给原本的我的项目。——不用理会就是了。

热力图

文章更新热力图

类似的热力图,我最早是在 GitHub 看到的,用来展示开发者的更新频率。现在看到不少博客也做了这种小组件:就是从当前日期向前追溯一年,每一天显示成一个灰色的小方块,如果当天有文章发布,就显示成浅绿色,如果当天发布的文章不止一篇,就显示成深绿色。我想了一下,用 Hugo 的模版系统,加上一点 CSS 做布局和显示优化,应该就能实现,动手试了一下,果然效果还算可以。目前可以在首页看到实际演示。

fin.

十三岁的唱片制作人!敏锐的设计洞察力来自街头?设由心声:序 Vol.0

🎥 点击跳转至 B站 播放视频:https://www.bilibili.com/video/BV1SN411a72T/

🎥 点击跳转至 YouTube 播放视频:https://youtu.be/o3XL_woaCUs

这是新企划的设计师视频系列《设由心声》的序章。在这期视频里,你将会看到设计意识自我觉醒的过程,以及不可遏制的创作冲动是如何生长的。

这是想重启很久的一个全新大坑:设计师访谈 + 产品与设计背后的内幕信息。

这一条是今年三月份去上海参观《拍照的人》线下展的时候,和 akira 在前台做的采访。你将会看到一个设计师自我觉醒的过程,和他的学习方法。

因为原本就有重新开启这个新企划的打算,于是借机做了这一期访谈,作为整个系列的开篇。 这个系列应该都会是这种类型的类似纪录片的形式,来展现设计和产品的业内信息和观察。为什么说是「重启」呢?因为很多年前做过一个设计师访谈的专栏,因为各种原因只做了七期就终止了,现在想用视频的形式复活这个企划。

早年的设计师采访文章见:

输出是一种排泄

在不同的平台上时不常的都能看到一些内容创作者他们会有疑问,说我的东西明明很有深度,准备得也很充分,制作也很用心,但是为什么没有获得很好的流量,或者其他的回报?这种时候要么就是真的有疑问,要么就是想通过这种疑问的方式,来表达对于这种流量的不满或者鄙视。

每次看到他们说这种话的时候,我就会代入到自己。我也有很多内容是花了很多心思很认真做的,但就是没有什么人看,没有什么人听。前几年确实会有疑惑,但现在我很坦诚地接受自己就是不擅长做那种大众流量欢迎的内容。

这里并没有鄙视大众流量的意思,我是真的发自内心的不懂,哈哈哈哈哈~

因为我做内容 99% 的动机,都只是为了把脑袋里的东西腾出来,它只是我的一个思考过程的外化。有人获得共鸣和启发,那就最好,没有那也无所谓。因此我确实没有真的花过心思在研究怎么样制作大家都喜欢的那种类型的内容,因为我也确实没有发自真心地想把自媒体作为自己的一条所谓职业赛道来看待。

因此,没有获得那样的流量,是很正常,也应该的。

一张封面引发的内核更换

我把博客的模版换了,更简洁,但更好用了。

事情要从「播客封面的输出事故」开始。

我在播客后台上传的一张 1600×1600 的封面图,在通过 RSS Feed 分别同步到小宇宙和 Apple Podcast 的时候,出现了不显示或被识别成「未提供」的状态。小宇宙的后台能看见,这张图是抓到了的,但在播放页没显示;而在 Apple Podcast Connect 的后台就直接识别为「未提供」。同样的源我也尝试给到 YouTube,能抓到,能显示,但非常模糊。

第一时间我就认为是博客那头的设置问题,但具体是什么原因呢?实在是太多年没有折腾过博客的模版设计了。每个菜单我挨个检查了一遍,发现确实有个「摘录」的开关打开了,它会限制 Feed 分享出去的是完整的一篇还是只有局部的内容。这确实有影响,它导致小宇宙没抓到全文,在单集详情页里只显示了第一段话,后面还跟一个无法点击的跳转的纯文字「阅读更多」。关掉这个开关之后,小宇宙也马上就更新,能显示全文了,但封面依然没有显示出来;Apple Podcast 那边完全没动静,别说更新了,就是搜索都还搜不出来,但明明已经发布了。

我实在想不出是哪里的设置不对,就上即刻问了一下。很幸运的是,小宇宙的小伙伴立刻就开始帮我找原因。在几经周折后,最终联系上了小宇宙的技术同学,他给我看说托管源输出的图片尺寸只有 180×200 px。这就很明确了!

https://suithink.files.wordpress.com/2024/04/vol-0000.jpg?w=180&amp;h=200&amp;crop=1

但我依然不知道为什么,因为翻遍了整个后台,都不存在一个设置 RSS Feed 输出封面尺寸的地方。别的朋友也都没遇到过这样的事。况且,一张正方形的图,就算是缩略图也应该是正方形的,比例变了又是为什么呢?

于是我意识到一件事:

这是一个行业内的标准做法,那就应该是通用的,如果别人的播客都没有这个问题,而博客后台又不存在可设置和调整的界面,那最有可能的原因大概就是,我博客使用的模板太过于老旧了。

为什么我会想到这个角度呢?

因为我博客目前用的模板,是 2013 年开始启用的,这十一年来,只在 2022 年时调整过一次,但技术内核还是原本的那套东西。然而事实上,我博客后台切换到区块编辑器已经好几年了,我还在用的这个老模板其实已经下架很多很多年了,只是因为我一直没有更换它,还在生效而已。

为了验证这件事,我先是研究了一下朋友托管播客的网站结构,确定了「封面图」在通用模版中的形式,再在我的博客后台巡了几圈,选定一些结构相似的、我也喜欢的模板,把它们套用在我的播客日志上,看看是什么表现。最后,我在区块编辑器里找到这些页面,看看它们是怎么表达和处理这张「封面图」的,有哪些可以设置的项。

至此,我锁定,问题的根源就在于,这个多年前就早已下架不再维护的老版本软件的模版,它在技术层面和现行的技术之间的差异,导致输出的封面图变成了一个比例错误的缩略图。我只需要换上一个新模版,就可以解决了。

但「换模版」这件事,其实我已经考虑好长时间了。

在这次「封面图事故」之前,我就有换新的的想法了。一方面确实是,在日常写作和新增一些页面时会明显感觉到这种技术上的代际差,只是自己懒得动,能用就不改。我相信大部分程序员也是这么想的,代码屎山不就是这么回事嘛。但如果只是换个模版,其实不用想那么久,所以另一方面更核心的是,我在同时考虑把博客的套餐升级到 Explorer 版,还想提前买下后面几年的域名使用权,因此,在我心里,模版的更新、升级、域名这三件事是合并在一起考虑的。

这次小事故,倒像是上天推了我一把。

于是乎,我下了决心,升档、域名、模版,一次性全部处理好了。我现在的博客,是一个更为简练、但更好用的全新状态。播客源的抓取也回归正常了。

20132022 到今天,眼看着我的博客越改越简练,但内容越来越充盈,我心中是欢喜的。这就是我这些年的状态,越发充盈,越不需要装饰,所有形式都让位于内容。我只要一件舒适的 T 恤就够了。年轻时喜欢说的个性,那不是通过页面、手机壳、衣裤鞋来体现的,个性是行动做派,不需要是任何视觉化的呈现。

这就是另一种「我变秃了,但更强了」。

在博客上做播客,再因为做播客而全面更新了博客,再把这个过程记录在博客上,我如果不写出来,这事儿说给人听都会觉得我有神经病哈!不过 Blog 和 Podcast 这俩完全不相关的事物,在简体中文里的说法竟然像绕口令一般相似,也是有意思。

兔子王国里的外星人_0.ylog

欢迎收听荒野楼阁 WildloG,这里是设计师苏志斌的个人播客。作为第 0 期,我会与你分享一下做这个播客的动机、这个播客的主题会是什么、起这个名字的缘由、本期封面和播客 Logo 的设计想法,以及后续的节目计划。

在这一期,你会听到:

—- 我是谁?从我家的动物园,工作和话剧的经历,聊到我二十多年的写作习惯。

—- 我对于视频内容的态度?为什么那么久没更新《设以观复》系列?

—- 原本并不想做播客,为什么转变想法呢?动机是什么?

—- 这个播客的主题:一个外星人

—- 荒野楼阁 WildloG 这个名字是什么意思?因为生机勃勃啊!

—- Why not 和 WildloG

—- 封面设计:隐秘的荒野和兔子王国

—- 以两类节目为主:一个人捡树枝,两人以上一起捡树枝

—- 要停更视频?

|登场人物|

苏志斌:工业设计师,车联网智能硬件产品经理/联创,《设以观复》作者

|相关链接|

若你所使用的播客客户端未能完整显示插图,或遇网络问题未能正常播放,请访问:

荒野楼阁 WildloG 的地址:https://suithink.me/zlink/podcast/

阅读设计相关的各类文章:https://suithink.me/zlink/idea/

|其他社交网络媒体|

苏志斌 @ 知乎|SUiTHiNK @ 即刻 / 微博

苏志斌SUiTHiNK @ Bilibili / YouTube / 小红书

|联络邮箱|

suithink.su@gmail.com

欢迎在 小宇宙、Spotify、YouTube、Apple Podcast 收听本节目,期待你的留言。

💾

分类法

把 blog 的文章分类整理一下。

这项任务已经拖延了超过十年,早就没意义了。blog 页面上,已经很多年没有放置分类列表。曾经企图把所有文章归入 uncategorized,然后用 tag 来做分类,——幸好没有,不然又是个半途而废的坑。

还是先把分类的框架搭出来吧。即使有了框架,从前的旧帖子,也还没有妥善归置到各个分类里,继续拖着吧。


yy – /yy

也就是「意淫」,初代互联网口头语之一。某种意义上,整个 blog 的所有文章,都是在 yy,所以从这个网站初建,这就是分类之一。内容偏向于各种奇怪的,未必和情欲相关的幻想。也经常觉得 yy 这个词渐渐不合时宜、甚至有些男性油腻,想换个更高大上的(譬如 P.Bourdieu 的 illusio…);但,还是先这么放着吧。

日子流 – /current

流水账。早年 blog 大兴的时候,一大群人的文章风格,都是今天吃了什么玩了什么买了什么。我也想学着这么接地气一些,但最终还是没写太多。网址的英文名,出自卡佛的《水流》。

nowhere man – /nowhere

旅行相关,或者日常生活中偏向旅行气质的片段。出处是 Beatles。

norwegian wood – /wood

情感相关。出处是村上春树当然也是 Beatles。

不正经的 – /funny

纯搞笑段子。

偶知道 – /seriously

一些比较认真的思考吧。「偶知道」既是偶然知道,也是我知道,——(偶 = 我)仍然是上古网络用语,尴尬到脚抠地。

他们 – /ille

偏向于对他人的描述,有网络引用的,也有实际访谈的。ille 是第三人称自指。关于他者的描述,终归还是要映照自身。

无政府主义审美 – /aesthetic

最初是时政方面的吐槽。后来也包括从无政府主义视角,对同温层内部的一些不同的观感。然而并不会努力地,专注于用这个 blog 向人普及反贼言论,所以最终还是轻轻地立足于「审美」两个字,说些只是看着不爽的东西。

love me do – /tech

和人文情感无关;一些在各种兴趣领域的技术攻略:攀岩、射箭、外语、IT……

拍拍 – /photography

作为童年爱好,这个 blog 曾经把「摄影」作为一个二层分类的顶端,下面包括很多细微的分类:拍的照片、心得、理论讨论……甚至还有过一个摄影 blog,后来停掉了,也没有合并过来。这边还多多少少留了些,就先堆在这里。——所以心中还是对此有爱的吧。要知道,连 IT 类原创都没资格独占一个分类,而是胡乱塞进 /tech /fyi /misc 里面……

FYI – /fyi

For Your Information,感觉会对很多人有用的资源。和 /tech 类似,但兴趣方面的含量就低了很多,只是当作工具来整理,也未必是原创。

misc – /misc

杂项。

把日常阅读的网页,用 RSS 推荐给好友

虽然大家写 blog 的频率都没那么勤了,但是,RSS 还是有其它可以玩的方式的!

很多人都有用各种 read it later、或者书签类工具,把有意思的网页保存下来。在这些工具里,可以通过某些手法,把一些想要分享的网页,生成 rss。其他好友订阅这个 rss 地址,就可以自动刷新,看到你推荐的文章啦!

下面介绍一些,常见的书签网站,生成 rss 的方式。但首先——

  • 这些生成的 rss 地址里,大多都内嵌着网站的验证码,容易泄密,也冗长而不简洁。强烈建议:得到 rss 后,先用 Feedburner 之类的网站,转成新的 rss,再分享出来,可以去掉原先网址里的隐私信息。
  • 很多网站,并没有专门用来 share 的分类,只能通过曲线手段,把已经 archive 或者 star 的类别分享出来。这可能会影响你原本的使用习惯。
  • 一些网站生成的 rss,并没有全文,甚至只有标题和链接地址。没关系,能看到大家的推荐,就已经很好了,自己点开就可以啦。
  • 大多数 rss 订阅工具里,也都有发送给 read it later 的功能,可以辗转着,把自己订阅的文章分享给他人。

我的 RSS 分享地址是:

https://feed.fivest.one/readings
或者
https://feeds.feedburner.com/fivestone/readings

有兴趣和我分享的,欢迎留言或私信交换!!


Instapaper 免费版

感觉 Instapaper 生成 RSS 的功能是最好用的,可以把特定的文件夹设为公开,直接得到它的 rss,形如:

https://instapaper.com/folder/1234567/rss/123456/Vciysdfsd7mod9B
  • 在左边栏创建新的 Folder,存放想要分享的文章;
  • 进入这个 Folder,在页面上方选择 Edit,设置成 Public;
  • 点击页面右上角的下拉菜单,选择 Download;
  • 下载为 RSS Feed,就得到 RSS 地址了。

Pocket 免费版

好像 Pocket 的免费用户,内容都只能是公开的(无语…),只要知道了用户名,就可以通过 RSS 查看全部的内容(所以生成的 rss 需要转录才安全)。而且不能自定义分类,只有默认的:

https://getpocket.com/users/USERNAME/feed/all
https://getpocket.com/users/USERNAME/feed/unread
https://getpocket.com/users/USERNAME/feed/read

最后一条 …/read 会返回所有 Archived 了的文章,可以勉强用它作为分类的手段。

Readwise

这个只有收费版,我就不去试了。有它家的用户,可以帮忙把生成 rss 的方法分享一下?

Wallabag

我在用 Wallabag,可以自建,也有收费的服务可用。生成的 rss 是全文输出,效果很好。在 Config – Feed 里,生成一个 token,然后点开任何一个 tag,点击列表上方的 rss 图标,就可以得到这个 tag 的 rss 订阅(生成的地址里带着统一的 token,所以需要转录才安全):

https://wallabag.your.domain/feed/USERNAME/asdfghjkl/tags/t:share

運動無國界,嗎?

🎥 點擊封面播放視頻

由一個提問開始,我從設計師與創作的角度,談論體育運動中的民族主義,警惕「分類」思維對思考過程的影響。

今日戶外步行運動記錄:開發了一條四分馬的路線!

🎥 B站播放地址:https://www.bilibili.com/video/BV1yv421k7Mg/

🎥 YouTube 播放地址:https://youtu.be/w2KQoic8LAg

這是春節過後的第一條視頻,主要是起個頭跟大家聊聊天。如果你有任何想法,歡迎在視頻中的彈幕或評論區里和其他人一起理性討論。

读完一本不好看的书,但心里很舒坦

在西西弗里偶遇这本书,随手翻了一下,被设定吸引了,就一下看了前九章。

二十三天后回到书店里把余下的二十二章看完了,满足的同时又觉得很失望。

满足的是,这个下午是我近一年来完整读完了一本书的时刻;失望的是,前半截一直吊着我胃口的摆渡世界的故事,最后居然演变成了俗气的爱情故事和死而复生的怪诞情节。我不喜欢这样的收尾。

但是,迪伦凭着自己的信念从死亡的世界回到人间这段路,这一路的勇气,是我愿意把第三颗星打上来的原因。书里的男女角色我都不怎么喜欢,无辜枉死的三十六岁女士也很莫名其妙,但对于此刻低气压的我而言,我喜欢迪伦一路冲过去的那份勇气和冒险的决心。

对多数人而言,读这本书是浪费时间。但我之所以感觉还行,是因为我太久没有体会到「完成」一件事时「结束」的那一刻了。哪怕这一刻并不欢欣鼓舞,但我完成了。

相对应的,前两天看完的两部片子,让我感到心里非常的舒坦。一个是贾玲的新电影《热辣滚烫YOLO》,另外一个是 Casey 最新的一条 vlog《Sisyphus and the Impossible Dream》。

一方面惊叹于贾玲真的一年瘦下来一百斤,练成了可以和职业拳击运动员打几下的状态;二来佩服于她为了实现这个目标所做的一切努力,一切向生活挥拳而做的事情。她不是瘦了,而是变了一个人,瘦下来只是一个副产品。

Casey 的 vlog 时间跨度长达 17 年。从大腿骨折,到跑进三小时以内,从二十来岁到四十多,一切的付出,就像西西弗斯一次次推石头上山,不仅过程令我震动,结果更是让我感受到了希望!

他俩是我 2024 年初的第一束光。

這夜風正涼 𝄇 就用五首詩與本命年訣別吧!No.73

我用這條影片回顧了 2023 年裡,對我而言最重要的四件事:

上海三日、父親離世、我的手術、香港四日

但很多感受我沒辦法通過影像或者散文式的語言來表達,它們很複雜,也只有我自己最清楚它們意味著什麼。於是,我寫了五首詩。這些詩都是我的感受和處境。它們或許很難為外人所理解,但如今的我已經清晰地認識到,人和人之間難以真的互相理解,尤其是那些並未參與你人生的人們,因此,並非所有表達都需要被理解,能按照自己的內心,袒露出來,就可以了。對於詩歌而言,我並不追求共鳴。

🎥 播放地址:

B站 https://www.bilibili.com/video/BV1KB421r7xs/

YouTube https://youtu.be/9RnACKm4XhU

這張封面雖然用在了上一篇 blog 中,但其實它本來就是為了給這條視頻做封面,而特意構思出來,在 Midjourney 裡畫的。它所呈現的,是一個被凍在了湖面下的香蕉,一個青澀的香蕉。我站在湖面上,低頭看著湖面,看著它,就像看著自己的處境。

本影片中,亦採用 AI 繪圖工具 Midjourney 製作了 23 張圖像,用於詩和情緒的表達。

第一章:你在橋上看風景

從膠片到數碼,從卡片機到手機,給真實世界切片的權力來到了每一個人手裡。一些人、一些事在和你接觸的過程中,在你的心裡激起了一些漣漪,那一刻的化學反應促使你舉起手機,拍下一些照片和視頻,這存在過但不再存在的一刻,因你而活了下來。

第二章:離去的少年

人與人的關係,是相處出來的。愛、恨、執、怨,皆為充實;唯獨空白,無法驅除。

因緣果報,你無法言說;潺潺流言,你只得不響。

第三章:陌生的天花板

這是你三十六年來第一次住院,也是頭一回做手術。

一棵巨大的樹從天花板上破頂而出,它白色的樹根粗壯有力,厚實的樹根一根根張開,盤踞在一張鋪著綠色床單的、平整的金屬架子床上。你看過一些跟手術相關的畫面,也設計過一些醫療器械,但這個巨大、結實的純白結構直接展現在你的眼前時,你還是受到了一點震撼。醫生、護士、病患,在這個空間里,你只能感受到「問題」和「方案」。性別不是一種凝視關係下的身份,是執行方案過程的所面對的「客觀結構」。

第四章:機翼在反光

朋友們今年都陸續在做出一些轉變:有人結束了設計公司的業務,投身於產品和品牌;有人離開了自己的藝術教育行業,主動擁抱自己的內心;有人帶著相機,一頭扎進了藍色的大海裡。

每人都有一個時機,它到來時,上天會告訴你。

🎥 播放地址:

B站 https://www.bilibili.com/video/BV1KB421r7xs/

YouTube https://youtu.be/9RnACKm4XhU

影片編號:Vlog No.73

博客实现 RSS 订阅能力全记录

我的个人网站 LRD.IM 从 2018 年元旦发布至今,已经持续维护 4 年了。从最开始根据一个网站模板替换图文,到现在全面的「自主研发」,这是我最骄傲的一款作品。接下来要开始尝试将我的博客内容输出成 RSS 源。

这篇博客不谈设计。写一点自己对互联网的初印象,将博客做成 RSS 源的原因,以及使用 RSSHub 将自己网站生成订阅源的过程。

吹吹水:我的互联网回忆录

对早期互联网的印象

家里 2005 年配置了台电脑,依稀记得那会儿互联网的潮流正好是从门户网站转换到「社会性网络」。

Discuz!、贴吧、QQ空间、开心网等等,都是 Web 2.0 的代表作,我「当年」也有高度参与到这些生态里面。那时候的互联网鼓励人们创造内容,强调互动和内容本身。而不像现在基于所谓的「算法」一直在投喂内容,网站上充斥着营销号、广告、对立、(甚至审查🤫)…

我记得以前网络上的内容是挺有趣的,因为都是自发的内容,感觉很真实。而现在在网上看到「有趣」的内容,却总感觉像是某个 MCN 机构生产出来的,所有内容都有目的,一直在包装、孵化,指向最后的变现…

所以正好我这位在 Web 2.0 时代背景下成长的网民,正好也有掌握了一些专业知识,于是乎就捣鼓出属于我的个人网站 LRD.IM,以及目前为止积累了 40 多篇的设计博客。一方面是想通过这些来积累自己的专业知识,另一方面是更想在互联网上留下自己的(且属于自己)的一些痕迹。

对 RSS 的执念

以前在 WordPress 搭建的博客、新闻资讯等网站总会有一个 RSS 订阅渠道,最初还没有了解过是什么意思,只是记住了有这个很不起眼的橙色的彩虹条纹的图标。

直到在大学了解到了一些信息获取来源方式和分类之后,才真正了解到 RSS 这个东西。很神奇的是它将内容进行重新格式化输出,将内容和从页面中分离出来,供读者在自己喜欢的第三方阅读器里接收新内容并阅读。

我还是挺认同这个概念的,即使它是 20 年前的产物。

分离原本的网页,意味着读者可以根据自己喜好在第三方阅读器上进行阅读,甚至自己捣鼓一个阅读器,而并非局限在原本网页管理者的设计中。

而第三方阅读器通常都会有新内容通知、已读未读标记、分类、标签等功能,这意味着读者能够拥有自己的一套信息获取方式,而不需要受到算法的介入,并能及时获得新内容的推送。

正好由于今年我的设计博客还上了不少公众号、周报的推荐,我察觉到拥有一个自己的内容推送服务迫在眉睫,而 RSS 订阅、邮件订阅都能满足这个需求,正好我就先将 RSS 订阅服务做起来先。

综上所述,我认同 RSS 的中立、纯粹、无算法介入,以及需要获取一个推送功能。所以,这时的我作为互联网内容生产者,是时候为自己的博客搭建一个 RSS 服务了!

实打实:将自己的网站生成 RSS 订阅源

预期

首先阐述下我的预期效果:

  • 抓取到 Blog 页面里的所有博客,并能检测到内容变动(包括增删改);
  • 将抓取的内容生成为 RSS 要求的格式,比如 XML;
  • 更新内容时,在第三方阅读器中确保至少的时效性(不会延迟太久)和内容准确度(顺序不会错乱);
  • 订阅链接用回自己的域名。

尝试一:第三方生成服务

于是乎我首先也试了几个做法,第一个是寄托于第三方的 RSS 生成服务。比如 Feed43FeedburnerRSS.app。当时我是期望这些第三方服务能够满足上述的预期效果,自动抓取我发布的新博客生成为 RSS 文件。它们确实也做到了,但会各自有一些硬伤。

  • Feed43:更新快,准确。但是免费版里生成的 Feed 里面会带有它们品牌的宣传,且国内访问速度一般;
  • Feedburner:更新速度一般,准确。但是被墙了,国内无法正常访问。
  • RSS.app:更新快,准确。但是只能抓取前几条内容,想要保留所有内容需付费升级账号。是否被墙倒是没试过。

试了一遍论坛/讨论组内大伙儿推荐的 RSS 生成服务提供商,没有完美地达到我的期望,每个都是差一点,只能靠自己了。

尝试二:手动制作静态文件

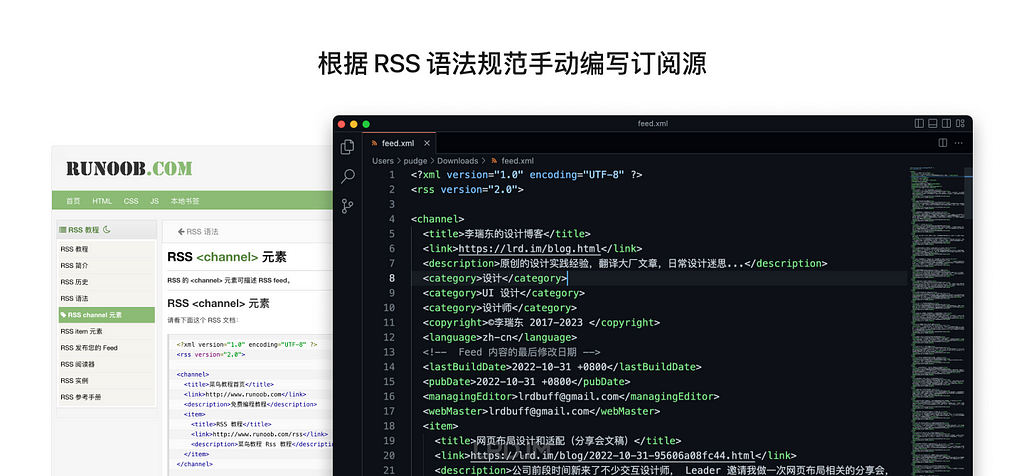
眼见外部服务不好使,于是乎我跑去看了看 RSS 的语法规范,尝试用最笨的方法:按照语法自己手动编写一份 XML 文档出来,给到读者去订阅。

大费周章按 RSS 语法规范写完了 XML,传了两份用作测试,一份传在自己的阿里云轻应用服务器上,另一份传到了阿里云 OSS 里。之后用第三方阅读器订阅 RSS 链接。

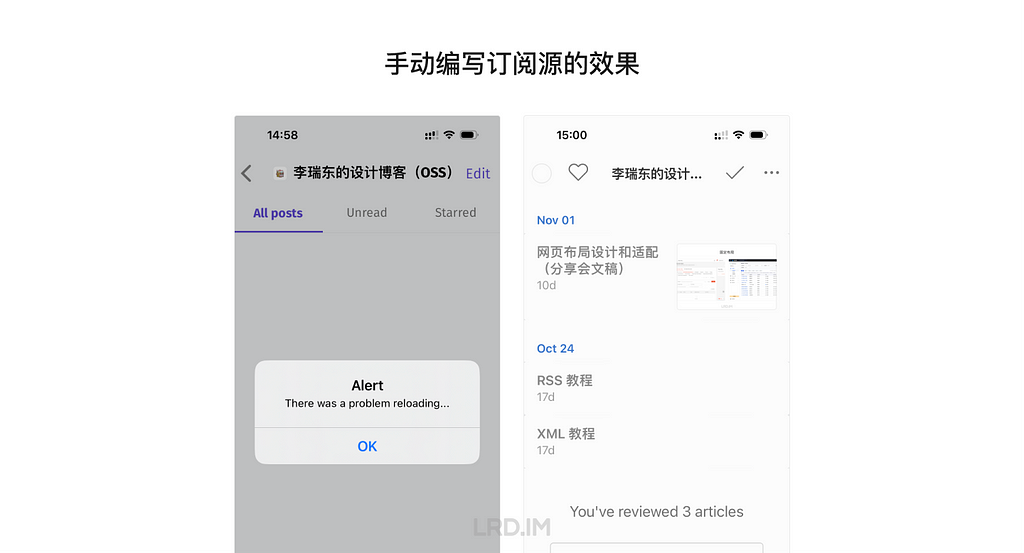
结果在阅读器里看到顺序错乱,时间异常,更新非常迟缓。刚开始我还以为这个笨方法能行得通,只是做起来比较麻烦,没想到仍然有这么多缺点。

最后一试:用 RSSHub 将自己网站生成为 RSS 源

了解 RSSHub
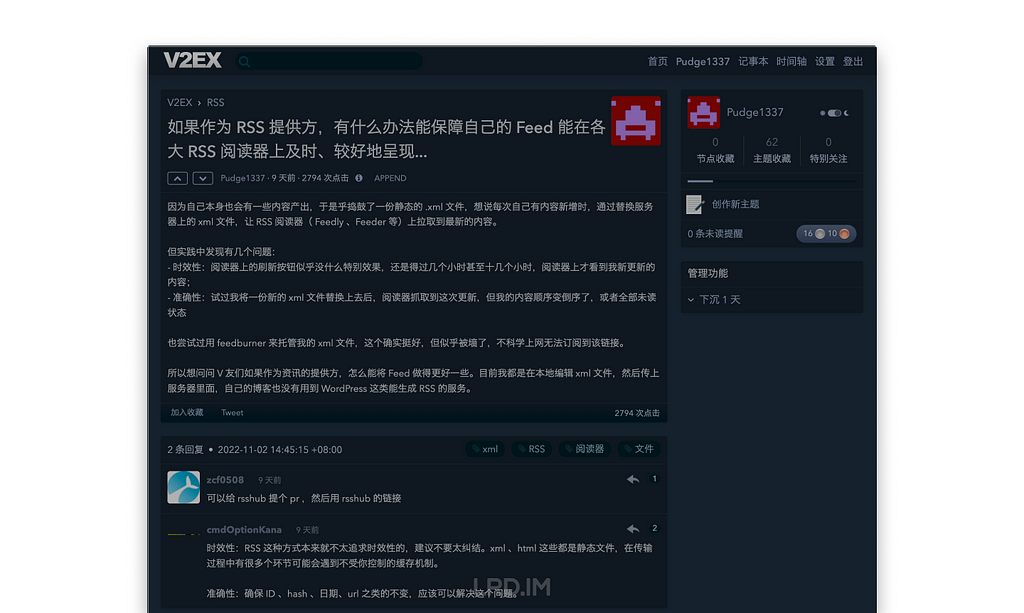
前两种方法试过都不能满足我的要求之后,我实在找不到一个好的思路或方向去实现,唯有在 V2EX 上发了个帖子请教下其他人。虽然帖子只有两个人回复,但足够启发我去解决问题了。

一楼回复建议我给 RSSHub 提个申请,让其他人写个规则来抓取我的网站,然后合并到 RSSHub 项目里,用该链接作为 RSS 的订阅链接。

后面我去了解了下 RSSHub,原来这是一个开源的 RSS 订阅源生成器,编写好规则(项目内称为脚本)后就能将内容按照 RSS 的语法生成一份订阅源,之后都可以用生成出来的链接在第三方阅读器上订阅和浏览。同时可以部署在自己的服务器里面,也能直接用 RSSHub 项目内别人预先编写好的规则,两者的效果是一样的。

粗浅了解下 RSSHub 的能力,以及也看了用该服务生成出来的订阅链接,功能上是能解决我的问题,但是时效性、准确度这些得自己部署完才能知道。

二楼回复认为静态的 XML 文件作为订阅源,会存在着不受我控制的缓存机制。于是乎我更坚定地认为应该尝试使用 RSSHub 的服务,毕竟这是动态生成,不是一个憨憨的静态文件。

安装 RSSHub
登录到服务器,由于我用的网站在阿里云轻服务器上搭建的,所以直接在网页里就能远程登录,其他服务器也能 ssh 登录后依次输入指令安装并运行 RSSHub。

git clone https://github.com/DIYgod/RSSHub.git
cd RSSHub
npm install
npm start

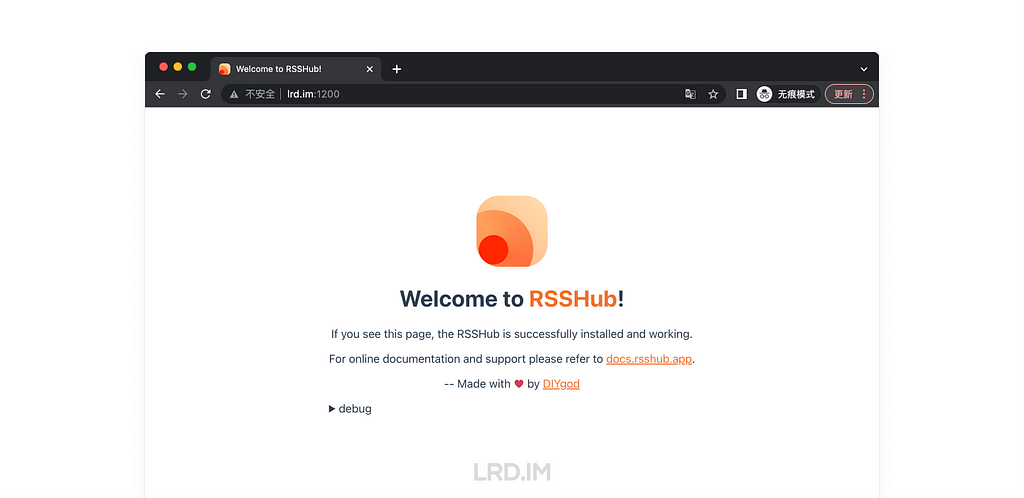
成功安装并运行后,在浏览器访问 1200 端口应该能看到如下页面。

回到终端,设置 RSSHub 服务常驻(断开 ssh 链接后仍然保持服务);以及开机自启。

# 设置常驻
npm install pm2 -g
pm2 start lib/index.js
# 设置开机自启
pm2 save
pm2 startup

这时可以访问几个 RSSHub 项目自带的路由,探索下其他有趣的 RSS 源。然后开始编写自己的脚本路由。

编写脚本路由
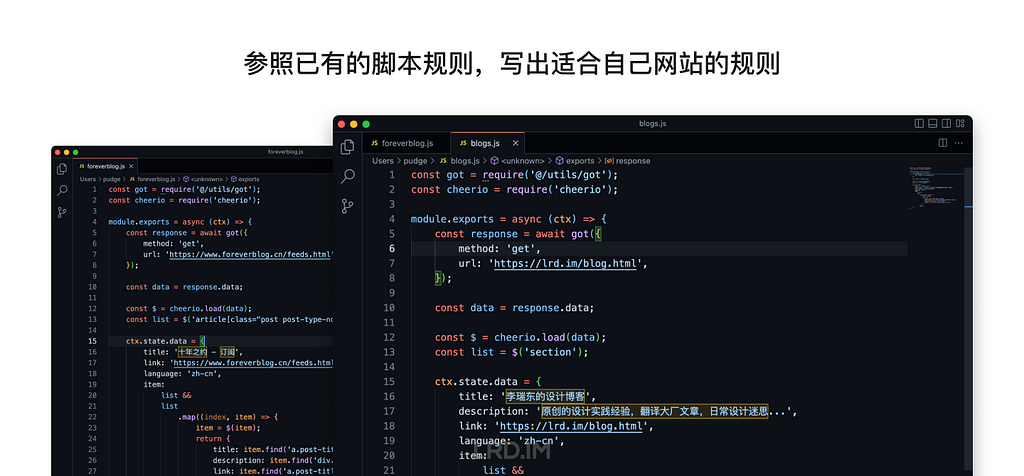
这一部分我的思路是参考文档的指引,并且在 RSSHub 项目内找到已有的脚本路由,找一份与自己网页结构类似的脚本,照葫芦画瓢捣鼓一份出来。

按文档的说法,/lib/router.js 里面记载了所有路由,即指明通过域名访问而指向的脚本。我先在里面创建一个路由,让其链接到之后创建的脚本。

# 添加路由
router.get('/feed', lazyloadRouteHandler('./routes/lrdim/blogs'));

其中 /feed 意思是我希望通过域名/feed 能够访问到我的 RSS 源,即 lrd.im/feed。后面的 ./routes/lrdim/blogs 意思是用前面的链接访问时,是链接到 /routes/lrdim/blogs.js 这个文件,用里面的规则生成 RSS 源。

然后到 /lib/routes 里面创建 lrdim 这个文件夹,并在里面创建 blog.js 这个文件,我们的抓取规则要写在里面。

由于我的网站是静态的 HTML 页面,所以我按照文档里的第二种方法,按照元素的标签和样式来抓取里面的数据。并且当时有参考了一个网页结构同样很简单的 RSSHub 内置源:十年之约。具体做法不在这详细说明了,主要按文档规范走就没啥问题,cheerio 语法也很直观容易理解。

保存后过几分钟,已经能在 lrd.im:1200/feed 中访问生成的 RSS 源了。此时需检查下名称、描述、标题、摘要、日期等有没有问题。

注意:日期必须按照格式编写,不能出现非法内容。否则这条 item 不会出现在结果中。我是写成了 YYYY-MM-DD。

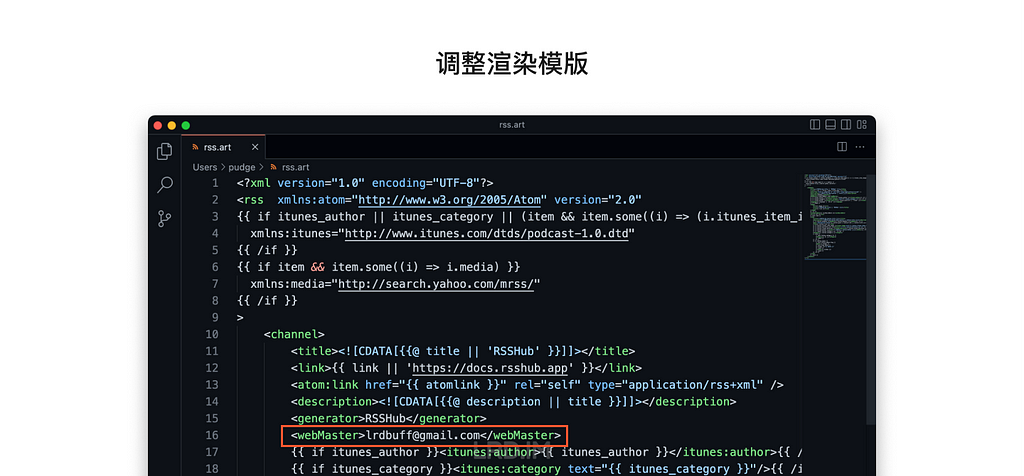
调整渲染模版
由于刚刚通过设置 RSSHub 脚本获取到的数据,会经过 rss.art 模版处理后再成为 RSS 订阅源,所以我们需要打开 /lib/views/rss.art 对渲染模版作出相应的调整,比如预设 <webMaster> 不符合预期,调整为我自己的邮箱。

设置代理
至此,我的 RSS 订阅源已经生成完毕,内容、格式等符合要求,剩下的只有域名还不大对劲。

截至到上面的步骤,我的 RSS 订阅源扔人家需要通过端口来访问:lrd.im:1200/feed。这个肯定是不能作为最终产物的,谁会把端口直接暴露出来,太丢人了。于是乎需要配置最后一步:设置代理。

我的服务器里安装了 nginx,打开 nginx/conf/nginx.conf 后配置代理,将 lrd.im/feed 指向 1200 端口的页面。

location /feed {
proxy_pass http://127.0.0.1:1200;
}

此时测试 lrd.im/feed,已经能正常访问经 RSSHub 生成的订阅源。

验收
拿订阅链接去各主流阅读器中试验,尝试搜索、添加此链接,并尝试增删改被抓取的网页内容,检查到确实能够及时更新,且不会信息错乱。

大功告成!奉上我的设计博客正式的 RSS 订阅链接:https://lrd.im/feed

将该链接复制到 RSS 阅读器上就能够及时获取我的最新设计博客了。阅读器的话看个人喜好,目前我觉得 InoreaderReeder 的体验都不错。

做多啲:在网站中曝光 RSS 订阅功能

费了这么大周章捣鼓的新功能,起码在我的网站里多多曝光才是。所以我顺手做了三件事。

支持 RSSHub Radar

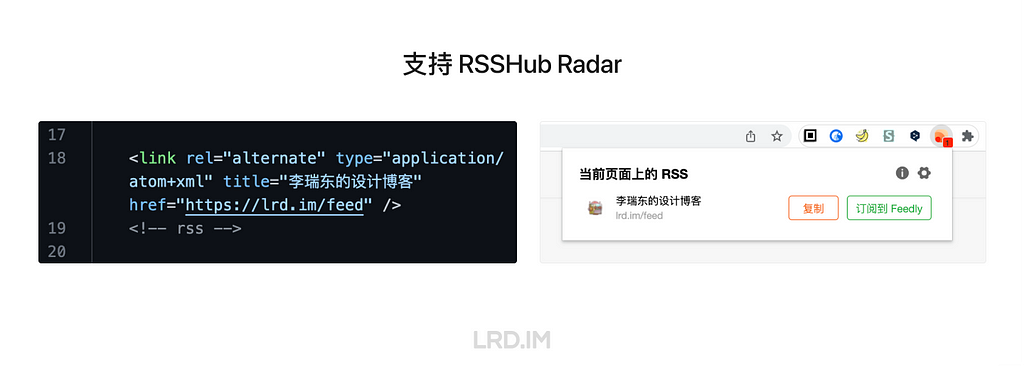
RSSHub 有一个浏览器插件叫 RSSHub Radar,用于探测网站上提供的 RSS,让读者能在浏览器的插件位置直接就能订阅,而不必在网页上费劲去找 RSS 订阅按钮。

支持该功能也不怎么复杂,我在所有页面的 <head> 处都添加了一条订阅地址,就能够被 RSSHub Radar 识别到。

博客页新功能提示

既然是我的博客内容的 RSS 源,那理所当然地应该在 lrd.im/blog.html 里添加一个稍微醒目一点的 Banner,提示到当前已经支持 RSS 啦!

此处参考了 Instagram 和 Apple 的样式,高亮若干秒之后开始减弱对比,使其融入到页面中。用了 CSS 的 keyframe 来做。

博客详情页功能组

从 Google Analytics 处跟踪到的数据,挺多流量是来自直接的博客详情页,而不是先从列表页跳转到详情页。所以也为了增加在详情页的曝光,我在「作者信息」一行右侧新添加了几个按钮,分别是:复制文章链接、RSS 订阅、联系小东。

原本「复制文章链接」这个功能我是做成响应式设计,只在移动端尺寸下才能看到,但还是根据 GA 数据反馈,造访我的博客的流量中有至少 75% 是来自桌面端,所以我将这个功能开放了。

「RSS 订阅」功能点击后能直接跳转到 lrd.im/feed,后续的订阅操作懂得都懂。每篇文章都提供这个入口,极大提高曝光量。

「联系小东」的功能是点击后出现我的微信二维码。我的设计博客通常会输出我的观点和看法,而我的网站里面又没有评论的功能,所以我捣鼓了一个微信二维码上去,读者如果有东西想和我交流就能直接加我好友一起交流。

这些功能没做成悬停在左右两侧,原因是我不太想在读者阅读时有其他干扰项。

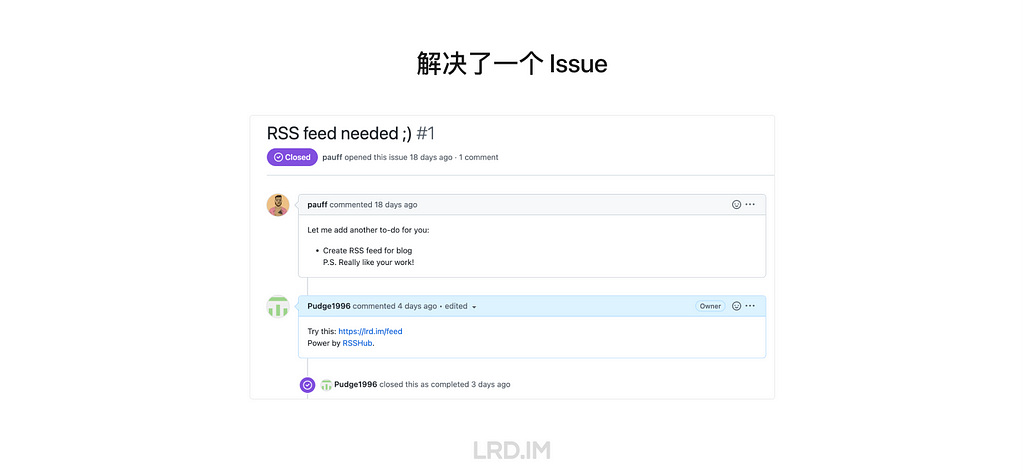
哦对了,还顺便 Close 了一个,也是目前唯一一个 Issue。

总结

给博客生成 RSS 订阅源这事虽然一直惦记了有大半年,但实际开始到最终呈现,历时一周左右,都是用下班时间和周末探索的。

又到了给自己挖坑的时间:后面关于博客订阅这块,我会做的几件事:

  • 想办法将自己的 RSS 源链接提交到 RSSHub 项目下的博客分类
  • 研究主流的 RSS 阅读器抓取文章首图的规则。现在抓取的首图并非每次都符合我的预期,可能本身我的博客详情页构造需要作些许调整;
  • 探索开拓邮箱订阅功能的必要性。目前 Medium 能够用邮箱订阅我的最新博客动态,在想是否需要用到 Revue竹白之类的自己捣鼓一个邮件订阅服务,内嵌到个人网站里面去。顾虑是担心这种平台的文本编辑器功能是否够完善,以及和 Medium 功能重复了。

完成了自己的一项执念,如释重负,舒坦开朗。但心里仍然藏了另一项执念,我惦记了有至少一两年了,仍待推进…

参考文档

Hosting Ghost Blog with Docker on NixOS

Hosting Ghost Blog with Docker on NixOS

As previously mentioned, I have successfully deployed NixOS on my Oracle ARM machine. You can find the original post here:

How to Install NixOS on Oracle ARM machine
The steps I undertook to install NixOS on an Oracle ARM machine.
Hosting Ghost Blog with Docker on NixOSDigital ImmigrantsOrchestr
Hosting Ghost Blog with Docker on NixOS

In the past, my blog was hosted on Tencent Cloud using Typecho. Unfortunately, due to unforeseen circumstances, I lost ownership of that machine along with all my previous posts. Consequently, I took a hiatus from blogging, remaining in a state of silence for a few years. However, I now realize the importance of reviving my blog before lethargy engulfs me.

After conducting extensive research and considering various platforms such as Ghost, WordPress, Typecho ,Hugo and some other platforms, I finally settled on Ghost. Its remarkable speed, plethora of customized themes, aesthetically pleasing web user interface, and integrated membership system influenced my decision.

Check out all the cool stuff Ghost has to offer on their website below:

Ghost: The Creator Economy Platform
The world’s most popular modern publishing platform for creating a new media platform. Used by Apple, SkyNews, Buffer, Kickstarter, and thousands more.
Hosting Ghost Blog with Docker on NixOSGhost - The Professional Publishing Platform
Hosting Ghost Blog with Docker on NixOS

Due to the absence of Ghost in the NixOS packages, and the cumbersome nature of adapting it into a NixOS service, Docker has emerged as an excellent solution for hosting Ghost. Here, I have provided a comprehensive breakdown of the steps I followed to set up a blog using Ghost with Docker on NixOS. This can be modified to use on other platforms.

Step 0: Enable Docker on NixOS

Enabling Docker(Podman) on NixOS is a straightforward process, requiring modification of just one configuration file. I personally prefer using the vim editor, but feel free to use your preferred tool such as nano, emacs, or VS Code.

The initial step involves logging into the machine, particularly if it is being used as a server.

ssh ${username}@${server IP}

Then, we can start to modify the configuration file:

sudo vim /etc/nixos/configuration.ni

There are two ways of adding Docker to the NixOS system: for all users:

environment.systemPackages = with pkgs; [
  docker
];

And for one user only:

users.users.${username}.packages = with pkgs; [
  docker
];

You can choose either way based on your needs. The next step is to enable the Docker service.

virtualisation.docker.enable = true;
virtualisation.oci-containers.backend = "docker";

Note that we're using oci-containers to control Dockers. If you have chosen to install Podman, remember to modify it accordingly. Some may question why we're not using docker-compose; this is a simple answer – we embrace the capabilities of NixOS, and that suffices.

Last, remember to create a directory for docker to use. Here's my example:

mkdir ~/.docker

Step 1: Set up Docker Network

Using the Docker CLI command docker network will indeed create the network, but it may not be the optimal approach. Since we're operating within the context of NixOS, we can add it as a service. Add the following code snippet to your configuration.nix file, ensuring to customize the name according to your requirements. In my case, I'm utilizing npm as an example since I'm employing nginx-proxy-manager as my Nginx reverse proxy service.

systemd.services.init-docker-ghost-network-and-files = {
  description = "Create the network npm for nginx proxy manager using reverse proxy.";
  after = [ "network.target" ];
  wantedBy = [ "multi-user.target" ];

  serviceConfig.Type = "oneshot";
  script =
    let dockercli = "${config.virtualisation.docker.package}/bin/docker";
    in ''
      # Put a true at the end to prevent getting non-zero return code, which will
      # crash the whole service.
      check=$(${dockercli} network ls | grep "npm" || true)
      if [ -z "$check" ]; then
        ${dockercli} network create npm
      else
        echo "npm already exists in docker"
      fi
    '';
};

Step 2: Set up Mysql for Ghost

We will now proceed with crafting Docker configurations. The initial step involves creating an external directory for MySQL to store its data, ensuring that we can modify MySQL without accessing the Docker environment directly. At present, this MySQL database is exclusively intended for Ghost; however, you have the freedom to tailor it according to your specific requirements.

mkdir ~/.docker/ghost-blog/mysql -p

Please add the following snippet to your configuration file as well:

virtualisation.oci-containers.containers."ghost-db" = {
  image = "mysql:latest";
  volumes = [ "/home/hua/.docker/ghost-blog/msql:/var/lib/mysql" ];
  environment = {
    MYSQL_ROOT_PASSWORD = "your_mysql_root_password";
    MYSQL_USER = "ghost";
    MYSQL_PASSWORD = "ghostdbpass";
    MYSQL_DATABASE = "ghostdb";
  };
  extraOptions = [ "--network=npm" ];
};

Please note that Ghost no longer supports SQLite and MariaDB as its database options.

Step 3: Set up Ghost Docker

Finally, It's time for Ghost.

Basic Set up Configuarion

Following the previous instructions, we will proceed to create the content folder:

mkdir ~/.docker/ghost-blog/content

Now, let's move on to configuring Ghost:

virtualisation.oci-containers.containers."ghost-blog" = {
  image = "ghost:latest";
  volumes =
    [ "/home/hua/.docker/ghost-blog/content:/var/lib/ghost/content" ];
  dependsOn = [ "ghost-db" ];
  ports = [ 3001:3001 ];
  environment = {
    NODE_ENV = "develop";
    url = "http://${server IP}:3001";
    database__client = "mysql";
    database__connection__host = "ghost-db";
    database__connection__user = "ghost";
    database__connection__password = "ghostdbpass";
    database__connection__database = "ghostdb";
  };
  extraOptions = [ "--network=npm" ];
};

Within this section, we configure the port mapping, environment variables, and volume mapping. Please note that you should customize the MySQL configurations in accordance with your specific setup in the final step.

Mail Server Set Up

Taking Gmail as an example, please note that you can modify this configuration according to your specific needs.

virtualisation.oci-containers.containers."ghost-blog".environment = {
  mail__transport = "SMTP";
  mail__option_service = "Google";
  mail__options__auth__user = "username@gmail.com";
  mail__options__auth__pass = "your google app password";
  mail__options__host = "smtp.gmail.com";
  mail__options__port = "587";
  mail__options__secure = "false";
  mail__from = "username@gmail.com";
  tls__rejectUnauthorized = "true";
}

Please remember that the Google app password mentioned here is different from your actual Google account password. You can generate a Google app password by following the steps outlined in the Sign in with app passwords guide.

By configuring these settings, visitors will be able to sign up and leave comments on our website.

More Custom Options

Please refer to the instructions provided on the Ghost website at the following link:

Configuration - Adapt your publication to suit your needs
Find out how to configure your Ghost publication or override Ghost’s default behaviour with robust config options, including mail, storage, scheduling and more!
Hosting Ghost Blog with Docker on NixOSGhost - The Professional Publishing Platform
Hosting Ghost Blog with Docker on NixOS

Step 4: Set up Nginx Reverse Proxy

There are numerous articles available on the internet that explain how to set up Nginx as a system service or utilize nginx-proxy-manager as a Docker service. For the purpose of this example, I will demonstrate the Docker service approach. Remember to create the necessary folders as well.

virtualisation.oci-containers.containers."nginx-proxy-manager" = {
  image = "jc21/nginx-proxy-manager:latest";
  dependsOn = [ "ghost-blog" "chatgpt-next-web" ];
  volumes = [
    "/home/hua/.docker/nginx-proxy-manager/data:/data",
    "/home/hua/.docker/nginx-proxy-manager/letsencrypt:/etc/letsencrypt"
  ];
  ports = [ "80:80", "443:443", "81:81" ];
  extraOptions = [ "--network=npm" ];
};

Step 5: Rebuild System

sudo nixos-rebuild switch`

Step 6: Start to Use

After rebuilding the system, you can proceed to open the web pages for both Ghost and nginx-proxy-manager.

For information and usage details about Ghost, please visit:

Ghost: The Creator Economy Platform
The world’s most popular modern publishing platform for creating a new media platform. Used by Apple, SkyNews, Buffer, Kickstarter, and thousands more.
Hosting Ghost Blog with Docker on NixOSGhost - The Professional Publishing Platform
Hosting Ghost Blog with Docker on NixOS

To learn more about nginx-proxy-manager, please visit:

Nginx Proxy Manager
Docker container and built in Web Application for managing Nginx proxy hosts with a simple, powerful interface, providing free SSL support via Let’s Encrypt
Hosting Ghost Blog with Docker on NixOS

Please note that once you have set up the nginx reverse proxy for Ghost, it's necessary to modify the Docker configuration for Ghost as follows:

virtualisation.oci-containers.containers."ghost-blog".environment = {
  NODE_ENV = "production";
  url = "https://your-website-address";
}

Please replace your-website-address with the actual address of your website. After making this modification, rebuild the system again.

In conclusion, if you have any further questions, please feel free to leave a comment without hesitation.

苟日新

突然被人跑来问,是怎么做到写博客坚持这么久的,而且可以持续输出?

(荣幸地,拿起话筒:)啊,我不觉得我这个样子,叫做「持续输出」啦。早就连每月一更都不能保证了,而且那些技术相关的帖子,在我心里都不能算是「更新博客」的,用这些凑数也为我自己所不齿……

但我看到这个问题时,首先想到的,一个很重要的因素:大概是因为,这个站就一直在这儿吧~ 我的技术能力,不需要花什么额外的精力,就能让这个 blog 一直存活下去。于是,想写东西的时候,这里始终有个地方,可以让我写。

——也有很多时期,是完全写不下去的,长时期没法去面对、去反刍自己的生活;然而也没必要因此而关站,就让 blog 存活在那里,终归是个表述的出口。大概是因为,我也是希望,自己能够从那些「无法整理自己」的状态中,渐渐走出来,回复到可以写东西的状态吧。所以站点的持续存在,满重要的,因为确实能感觉到,想写点什么的时候,如果没有这么个站,又或者需要自己重新架一个,可能也就不写了……


这种「随时可以在站点写东西」的状态,也影响着对 blog 平台的选择(怎么又拐到技术贴去了?好吧,之前也一直想吐槽这方面,就顺带提一下)。这些年一直有 〖wordpress vs 各种静态博客〗哪个更好的争论。双方确实各有利弊。总体来说,静态博客最大的优点就是……省钱,可以薅 github、vercel 之类托管网站的羊毛。但另一方面,静态博客每次发布、或者修改一篇文章的过程,其实满折腾的。通常情况下,它需要

  • 一台固定的电脑,安装静态博客编译程序,并且从这台电脑发布到 github 的专门权限。而不是随便打开一台电脑或手机,从浏览器就能编辑发文;
  • 每次发文时的一系列专门操作。

我不乏看到有人,好久没有更新,突然想写一篇文章时,忘了怎么操作,翻出攻略来重温一遍;甚至忘了连接 github 的 ssh-key……可能别人觉得这样的折腾无所谓,或者自我管理优秀的话,不会出现这种情况。但我个人觉得,这是会在主观上,影响发文章的状态的。所以,随便在任何地方任何电脑上都能直观地发文,感觉还是蛮重要的。

好像也是可以通过一系列操作,实现用浏览器某个网站上编辑文章,然后自动编译发布到托管网站的。我没有仔细去关注。但是,如果把 blog 的生命周期,放到 5~10 年这个尺度上,那么这些网站之间的复杂依赖关系,很大程度上是不靠谱的。譬如我已经看到好几个静态 blog 的外挂评论系统,不知为什么不工作了……总之,相比之下,我可能更宁愿去使用那些免费带广告的 blog 平台。

我对写 blog 的新人的推荐,一直是——

  • 如果有技术能力、也有服务器的话,自建 wordpress;
  • 或者找人蹭一个。如果我们比较熟,你可以去买个域名,把 blog 挂在我的服务器上。这并不是很大的负担。(ps,个人 wordpress 小站,是可以不必安装开销很大的 mysql 数据库的);
  • 如果上面两条都不行,那么,我优先推荐去注册现成的 wordpress.com 或者 blogspot.com,目前看起来,长期靠谱的只有这两家了。虽然免费版界面不好看、还有广告,但长期写着应该没问题的;
  • 当然,我不会给乐于尝试静态博客的人泼冷水。但我会根据你的技术能力和气质,暗戳戳地担心:
    • 你能坚持写多久;
    • 你写出来的,会不会很多都是关于你怎么建站的经历和心得……

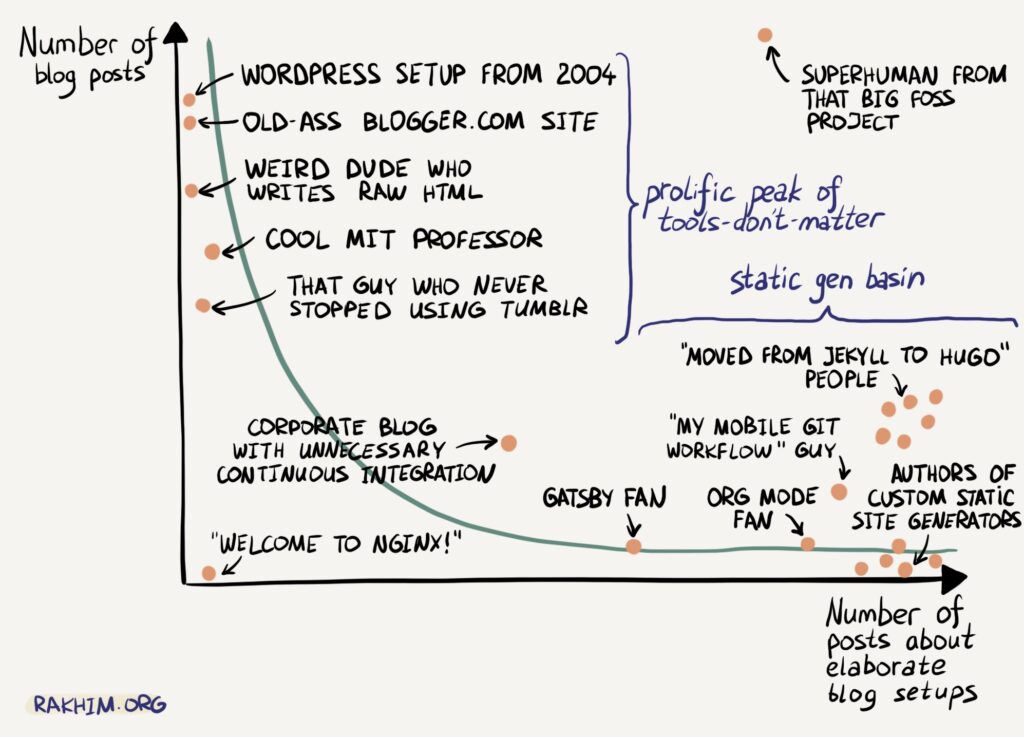
转一张,对于熟悉这十几年来 blog 平台变迁的人,应该会很搞笑:用不同工具写 blog 的人,(写 blog 文章)vs(写关于怎么配置 blog 的文章)的对比。右下角那些术语,都是在各个年代,需要各种不同程度的折腾的,静态 blog 方案:gatsby、org mode、jekyll、hugo、git workflow……


ps,两个月前,用这段代码方案,把我在 twitter 的所有 po 文,都导入到了自建的 mastodon 里。Twitter 那边,应该会随着 Elon Musk 的各种不靠谱折腾,渐渐放弃掉了吧。而每条推文的字数限制,从 twitter 的 140 字,变成 mastodon 的 500 字后,很多几百字的感受,要不要专门写到 blog 这边来,就比从前,更让人犹豫。具体怎么处理,我还没想好。

❌