Reading view

There are new articles available, click to refresh the page.

Last Week on My Mac: School of Athens or Blinded Samson?

I wonder whether we’ll look back at 2024 as the year that Apple Intelligence came to our Macs and devices?

While there are plenty of nay-sayers, and those who still accuse Apple of falling behind, there can be few who aren’t aware of what’s available to those who have bought a recent Mac or one of the higher-end iPhones or iPads. Since Apple’s attempt to hijack the established abbreviation AI at WWDC last summer, we have heard little else. There can have been few minor updates that were sold as heavily as the autumn’s x.1 and x.2 releases for their lavishly preannounced new features.

We’ve been beta-testing some of those features for as long as we’re normally allowed for a whole major release of macOS. Over that period, the number of users who have switched to English (US) as their primary language must have been substantial. It’s the first time I have kept one of my Macs running beta-releases long after the annual macOS upgrade, and I only reverted when 15.2 was released with AI support for English (UK).

raphaelschoolathens
Raphael (1483–1520), The School of Athens (c 1509-10), fresco, 500 x 770 cm, Stanza della Segnatura, Palazzo Vaticano, The Vatican City. Wikimedia Commons.

Although these AI features have their uses, and for many should prove quietly revolutionary, I’m not convinced that they transform our Macs or devices into anything even remotely intelligent, and a far cry from the great thinkers in Raphael’s masterpiece The School of Athens. The central figures here are Plato (left), who carries in his left hand a book titled TIMEO (I am afraid), and Aristotle (right), whose book bears the word ETICA (ethics). Seen further to the left in profile is Socrates, and below him is Pythagoras writing in a book while a boy holds in front of him a small blackboard showing the theory of harmony.

Contrast that hullabaloo about AI with Apple’s complete silence on security, specifically the changes brought in its front-line malware detection feature XProtect in macOS Sequoia, since its release on 16 September. Prior to that, XProtect’s data bundle, including its Yara file of detection signatures for malicious software, had been maintained by the general macOS update service through softwareupdated. The diagram below outlines this long-established process.

xprotectupd1

When Sequoia 15.0 was released, that changed to what has turned out to be an intermediate invoking both the old mechanism and the new.

xprotectupd2

For the first couple of weeks of that, XProtect updates were chaotic:

  • 13 Sep (approx) Software Update Service stopped providing regular XProtect updates
  • 13 Sep (approx) XProtect version 5273 available from Software Update Service for Sequoia only
  • 16 Sep macOS 15.0 released, with version 5273 available from Software Update Service for Sequoia only; upgraded Macs updated to 5273 by copying from secondary to primary locations; 5273 not provided from iCloud, where 5272 remained the current version
  • 18 Sep Software Update Service resumed delivery of 5272 to Sonoma and earlier
  • 18 Sep Software Update Service started delivery of 5274 to Sonoma and earlier; 5273 no longer available for Sequoia, with 5272 still available from iCloud
  • 24 Sep Software Update Service delivered 5275 for Sequoia; no change to Sonoma and earlier, and 5272 still available from iCloud.

Then, just as we were getting the hang of it, Sequoia 15.2 excised the old mechanism, as we discovered last week when Apple released the first update to XProtect since 15.2.

xprotectupd3

Throughout all of this, Apple has remained completely silent. What’s even more surprising is that in the last few days, Apple has updated its definitive guide to security for Macs and all its devices. Although not all localised English translations have yet been synced with its US or Canadian English versions, the account of XProtect now has a published date of 19 December 2024, but doesn’t mention September’s changes.

There are those who insist that none of this is our concern, we should just let Apple do whatever it deems appropriate, and we shouldn’t even know what version of XProtect’s data is installed, as macOS takes care of all that for us. However, the security of my Mac is very much my business. If I were to unwittingly install malware that stole sensitive information, those are my banking details at risk, not Apple’s. Should I suffer financial loss as a result, would Apple provide unlimited compensation?

Hardly. Read sections 8 and 9 of Apple’s licence for macOS Sequoia, and the onus is clearly placed on the user. Just to emphasise this, further down that licence, in the Apple Pay & Wallet Terms and Conditions, is the express statement: “You are solely responsible for maintaining the security of your Mac Computer, Supported Devices, your Apple Account, your Touch ID information, the passcode(s) to your device(s), and any other authentication credentials used in connection with the Services (collectively, your “Credentials”).” The next time someone says that you should leave the security of your Mac to Apple, remind them of that.

Apple also encourages us to take an active part in our Mac’s security protection, and provides us with tools for doing so. The description given in man xprotect is a good example: “xprotect is used to interact with XProtect. It is useful for administrators or users who want to manually invoke XProtect functionality.”

Information about XProtect updates is exposed in the GUI, in System Information, where each update including those delivered by both old and new mechanisms is listed, together with its version number. That in itself is puzzling, as recent entries incomprehensibly duplicate older XProtectPlistConfigData entries with newer XProtectCloudKitUpdates.

So if AI doesn’t bring us the School of Athens, what has macOS Sequoia achieved so far? For this second image I turn to Lovis Corinth’s first major painting after his near-fatal stroke just before Christmas in 1911, an autobiographical portrait expressing his frustrations, in The Blinded Samson from 1912.

corinthblindsamson
Lovis Corinth (1858–1925), The Blinded Samson (1912), oil on canvas, 105 x 130 cm, Alte Nationalgalerie, Berlin. Wikimedia Commons.

Please don’t breathe a word of this over on Apple Support Communities, though, where it seems your Mac’s security should be like mediaeval religion, a matter of blind faith and the suppression of knowledge. It’s high time for a Renaissance, much more Enlightenment, and a modicum of Intelligence.

Saturday Mac riddles 287

Here are this weekend’s Mac riddles to entertain you through family time, shopping and recreation.

1: Comfort for the organ cabinet and shows entries from 2.

2: Mass of wood measures a ship’s speed for the jottings of your Mac.

3: Guide points the way to measure performance in 2.

To help you cross-check your solutions, or confuse you further, there’s a common factor between them.

I’ll post my solutions first thing on Monday morning.

Please don’t post your solutions as comments here: it spoils it for others.

A brief history of logs and Console

System logs seem to have been introduced with Mac OS X in 2000-2001, and I don’t recall any equivalent in Classic Mac OS, although individual apps such as databases often kept their own logs.

2000-2016 text logs

As Mac OS X presented itself as a derivative of Unix, it brought with it bells and whistles such as support for code to write to system-level logs including system.log, console.log and dozens of other more specialist destinations, and its own log browser in the Console app.

console2001

As is traditional, log entries contained unstructured plain text to which a datestamp and other data were added to expand each into a line of text in log files that were rotated daily. As entries were relatively infrequent, many users learned to read the log and to use it to diagnose problems.

console2001b

The Console app gave ready access to all standard logs as well as app-specific ones, such as this for mail processes such as sendmail, and crash reports. These two screenshots are from Mac OS X 10.0 Cheetah in April 2001.

console2005

By Mac OS X 10.4 Tiger in 2005, Console had acquired some basic tools and a sidebar to select from the many logs. Because they were plain text, those for previous days were compressed and stored in archives until they were removed during routine housekeeping. This excerpt shows entries in the system log over a restart that took over 2 minutes from the last entry to the start of the boot process.

logmaster

There has also been the rare substitute for Console: this is LogMaster from Bright Light Software, shareware for $14.50 in 2006 until it was abandoned.

console2011

Although much in Console remained the same until 2016, at some stage Apple structured log entries into fields, as shown here in Mac OS X 10.6 Snow Leopard. Log entries were still infrequent, with this excerpt covering a period of almost 20 seconds.

Console showing log entries for a typical restart.

This is another restart, here in OS X 10.10 Yosemite in April 2015. This time, the period recorded for that restart has fallen to 39 seconds. System shutdown is marked by the shutdown process and SHUTDOWN_TIME, and startup begins with BOOT_TIME.

2016 Unified log

With macOS Sierra in 2016, that was all swept away and replaced by the Unified log. There had been warning signs that change was coming: in May of that year, I complained that the log consisted of a torrent of messages like
17/05/2016 21:04:40.175 storeassetd[531]: multibyte ASN1 identifiers are not supported.
or
17/05/2016 20:55:15.298 WindowServer[233]: _CGXRemoveWindowFromWindowMovementGroup: window 0x91 is not attached to window 0x92
Even when running a fairly clean installation of El Capitan, All Messages clocked up around 4000 entries every 8 or 9 hours. At its worst, the log could fill those 4000 message slots in a minute or two. Little did we realise how busy our logs were about to become.

Apple declared the goals of its new log system at WWDC in June 2016:

  • a single efficient logging mechanism for user and kernel mode;
  • to maximise information collection with minimum observer effect;
  • the compression of log data;
  • a managed log message lifecycle;
  • as much logging on as much of the time as possible;
  • for privacy to be designed into the logging system;
  • a common system across macOS, iOS, watchOS, tvOS;
  • all legacy APIs (NSLog, asl_log_message, syslog, etc.) to be redirected into the new unified log;
  • to emphasise debugging of macOS and apps, not providing any facilities for system administration or audit;
  • to link to the sysdiagnose tool for gathering information for bug reports etc.

To achieve this, a log entry is made using a new call that’s handled by the logd daemon and compressed into a buffer. From there it’s either retained in memory if ephemeral, or written out to a file.

mul102LogdFlow

There are two main groups of files that store log entries: those kept in /var/db/diagnostics/Persist/ in the form of tracev3 files containing regular log entries, and further tracev3 files in /var/db/diagnostics/Special/ containing additional shorter-life entries. Additional and lengthier log data can be stored in files named by UUID in /var/db/uuidtext/, and there’s also scope for high-volume collection.

tracev3 files use a proprietary compressed binary format that remains undocumented to this day, but has been partially reversed. Apple doesn’t provide direct access to their contents, only through closed-source utilities such as the log command tool. Where users want a more portable format, Apple recommends conversion to a logarchive package, although that’s also undocumented and only directly accessible using log and Console. Apple has in recent years given limited access to the active log for third-party apps, but that lacks many of the useful features of its own log command.

Privacy

Privacy features have caused problems from the start. Log messages containing potentially sensitive information have that censored by <private>. Like so many good ideas, this had unintended consequences as many log entries only contain the dreaded <private>, and in some cases meaningful content is lost altogether.

Ironically, the most embarrassing security problem in the Unified log occurred in early versions of High Sierra, when encryption passwords were leaked apparently as a result of incorrect string formatting. Apple subsequently added an entry field to make explicit the formatting used for that entry.

Until the release of Catalina, there was an undocumented switch to turn privacy protection off, through an option to the log config command. When you needed to view all those censored messages, you could turn protection off, perform the test, and the log then contained all the information you required. That changed in Catalina 10.15. In order to bypass this privacy protection, you had to run your Mac in a special diagnostic mode intended for use exclusively by Apple engineers. Apple later relented and allowed this to be controlled through a profile, although because entries already made don’t contain the censored data, it can’t be applied retrospectively.

consoleserrors

When first released, access to the new Unified log wasn’t restricted to admin users, but that changed in macOS 10.12.4, when that restriction was applied, and normal users found they were no longer able to browse the log at all.

Problems

The biggest disappointment, though, has been the Console log browser, which has made only limited use of log entry structure, displays just a small selection of entry fields, provides little aid for the high volume of entries, and worst of all gives no access at all to recent entries in the live log. Apple’s decision to restrict Console to browse the live stream of entries and logarchives has rendered it useless for many of the most compelling reasons for the app, but it has ensured that Console and the log provide no “facilities for system administration or audit”. It has also deterred third-party developers from writing to the log, and made it the exclusive preserve of Apple’s engineers, which perhaps was the original intention.

Since its first release in macOS Sierra, the log has flourished if not grown like an invasive weed. The number of fields available has increased from 16 to over 25, many of them added to support Signposts, introduced in late High Sierra and Mojave. Those are used extensively in macOS primarily to measure performance.

As the log now rolls its tracev3 files to maintain a maximum total file size, rising rates of entries by macOS have limited the period covered by retained entries. What in the early days was sufficient for up to 20 days of entries may now last little longer than a few hours. This also ensures that Console has more limited usefulness, and it struggles to cope with logarchives of any size.

console2024

Collection and retention of entries from different subsystems is set in logging profiles, XML property lists stored in /System/Library/Preferences/Logging (in the System volume, so read only) and /Library/Preferences/Logging, which the user controls. You can create your own custom profiles, or modify them on the fly using the log command, although this appears unusual even among the few left who can and do still browse the log.

What used to be a primary tool in diagnosing problems has been abducted without replacement. At least it keeps those pesky system administrators and auditors away.

How iCloud can be simpler than a server

Apple provides so many services for different parts of macOS that it’s hard to keep track of them. If you want to see a short summary, this article lists all service connections for enterprise network administrators, although it doesn’t detail which services use which servers, for example referring to “macOS updates” in many entries.

Many of you seem surprised to learn that Sequoia’s new XProtect updates come from iCloud, although Apple has been using iCloud for similar purposes for at least the last five years.

One good example that’s used every day on your Mac are the notarization checks sometimes run by Gatekeeper when macOS launches executable code, such as an app. In that case, com.apple.syspolicy processes the app’s notarization ticket
looking up ticket: <private>, 2, 1
by trying to fetch its record from iCloud using CloudKit. That’s followed by log entries indicating the network access required to connect with iCloud and check the ticket. Success is reported by com.apple.syspolicy in
CKTicketStore network reachability: 1, Mon Aug 26 09:15:45 2024
looking up ticket: <private>, 2, 0

and further lookups. I first reported those checks with iCloud back in Catalina, in 2019.

A simple way to illustrate the differences between this and using the general softwareupdated service is to compare what happens in the log when you ask if there are any updates available.

softwareupdate

When SilentKnight does this, it uses the only supported method, the softwareupdate tool, as used to keep XProtect up to date in all versions of macOS prior to Sequoia. That command hands over to the softwareupdated service to run the check. That in turn uses components of com.apple.SoftwareUpdateController to summarise the update state of that Mac, connect to the Software Update Server, check all the current versions and build numbers of macOS and its ancillaries, and arrive at a list of updates required. This is even more complex than it sounds, as com.apple.SoftwareUpdateController has to check key settings such as whether the root volume is sealed or not.

You can trace this through several thousand log entries, and after around 4.4 seconds and multiple network connections, softwareupdate finally informs SilentKnight that there are no updates available.

xprotect

Running the command
sudo xprotect check
in Sequoia is far simpler and quicker, as it checks for just one component’s updates through iCloud. The command connects to XProtectUpdateService in the XprotectFramework private framework in macOS, which in turn fires up CloudKit to connect to iCloud. That fetches a database record and returns the result to XProtectUpdateService, and so back to the xprotect tool as its result. Total time taken is 0.5 second.

As Apple’s intent in changing the management of XProtect and its data appears to be to facilitate more frequent and macOS-specific updates, iCloud is an ideal platform to host this on.

Pinniped with tusks

There is, though, one last thing: what is the walrus? As that might seem an odd question, read these two log entries encountered when browsing what happened with the xprotect check command:

12:08:00.919841 com.apple.cdp XPC Error while fetching walrus status: Error Domain=NSCocoaErrorDomain Code=4099 "The connection to service named com.apple.cdp.daemon was invalidated: failed at lookup with error 3 - No such process." UserInfo={NSDebugDescription=The connection to service named com.apple.cdp.daemon was invalidated: failed at lookup with error 3 - No such process.}
12:08:00.919845 com.apple.cloudkit CoreCDP reports that walrus is undetermined for the logged in account. Error: Error Domain=NSCocoaErrorDomain Code=4099 UserInfo={NSDebugDescription=<private>}

The prospect of an undetermined walrus that can’t be fetched from inside my Mac might seem worrying 🤭

XProtect has changed again in macOS Sequoia 15.2

If your Mac is running macOS Sequoia version 15.2 and you keep an eye on its security data updates, you may have noticed that those have changed again. Perhaps the only way to make sense of what has happened is to understand how XProtect updates work in recent versions of macOS.

Before doing that, there are two important issues to make clear:

  • Despite their names, XProtect and XProtect Remediator are different, and in Sequoia are updated using different mechanisms. XProtect is run on-demand when macOS is about to execute code, while XProtect Remediator runs scans for malware in the background about once a day. This article is only about how XProtect updates, as XProtect Remediator is still updated using the softwareupdate mechanism, and that hasn’t changed.
  • Sequoia obtains XProtect updates through a connection to iCloud that is independent of whether your Mac is logged into your Apple Account in iCloud. So long as your Mac is connected to the internet and nothing blocks its iCloud connections, those updates will be available to it, regardless of whether it’s connected to your Apple Account or iCloud Drive. This is in common with other services that macOS relies on, such as making notarization checks on apps, and updating linguistics data and those used by AI.

macOS Sonoma and earlier

Like other security data updates including XProtect Remediator, XProtect is updated through Software Update, or the command tool softwareupdate, which is how SilentKnight obtains its updates too. Shortly after starting up, and at least daily after that, your Mac’s softwareupdated service contacts Apple’s software update servers and checks whether there are any updates available. If there are, they’ll be automatically downloaded and installed, provided that’s enabled in System Settings.

In this case, XProtect is installed in its traditional place, in /Library/Apple/System/Library/CoreServices as XProtect.bundle.

mcOS Sequoia 15.0-15.1.1

For this brief period, XProtect updates have been available using either of two methods.

The traditional method using Software Update or softwareupdate continues to install the XProtect bundle in its old location, where it could still be used, but the XProtect service in Sequoia expects to find it in a different location, in /private/var/protected/xprotect, where it’s still known as XProtect.bundle.

The new method installs the XProtect bundle directly into its new location, and doesn’t obtain it using Software Update or softwareupdated, but an undocumented service that connects to iCloud instead. That appears to activate at least once a day, independent of softwareupdated, and silently checks for XProtect updates in iCloud. When it finds one, that’s installed directly to /private/var/protected/xprotect but not the traditional location in /Library/Apple/System/Library/CoreServices. It’s therefore perfectly possible for the two XProtects to get out of sync, although the only one that Sequoia uses is that stored in the new location.

Sequoia also introduces a new command tool xprotect to help manage these new updates. If you run
sudo xprotect update
and the version of the XProtect bundle in the traditional location is greater than that in the new location, then the newer version will be copied to the new location to install it there as an update, instead of having to wait for the update through the new iCloud mechanism. This also provides redundancy, but relies on the two sources providing identical updates.

To add a final twist of confusion, if xprotect copies the XProtect bundle from the traditional to the new location, it does so by copying its contents, so its version number changes but the bundle itself retains its previous date of creation and modification, which can prove thoroughly confusing. The lesson here is to check the bundle by its version number, not by its dates.

macOS Sequoia 15.2 and later

In the latest release of Sequoia, the traditional method of updating XProtect is no longer used. If softwareupdate were to download and install an update, then it will only end up in the traditional location, and xprotect update can’t use that to update the new location.

In normal use, this means that the user can’t update XProtect until that new version is made available from iCloud. This ensures that the only versions provided to Macs running 15.2 and later are those intended to be used in Sequoia, but it also means that any delay in providing those via iCloud will leave Macs without the latest update.

Apple has modified the xprotect command to provide one let-out, though: use
sudo xprotect update --prerelease
and it “will attempt to use a prerelease update, if available.” Note that still can’t use a traditional XProtect update installed in the traditional location, and still has to be able to obtain the update from iCloud, but it might work when xprotect check and xprotect update can’t offer a new update yet. Note that Apple describes that early-bird version as prerelease, and it shouldn’t therefore be used as if it’s a regular release, and only for good reasons.

SilentKnight

Because of these changes, as of Sequoia 15.2, SilentKnight is no longer able to provide any assistance in updating XProtect, and its next version 3.0 will also be unable to do anything more useful than inform you that your current version of XProtect is up to date, or out of date. If it is out of date, then it’s up to you what you decide to do about it. In most cases, that should be to leave well alone and let macOS handle the update as it’s intended to.

Because time of release of XProtect updates through softwareupdate and iCloud differ, and vary around the world, availability from one source is no guarantee that the other will also be offering that update. For example, on 17 December, the softwareupdate version became available by about 1830 GMT. A prerelease version for 15.2 was available several hours before that, but the regular release wasn’t available from iCloud until early the following day. If Apple is intending to fork XProtect data for 15.x from those for older versions of macOS, the two update services will be offering quite different bundles anyway, as we experienced briefly in the early days of Sequoia.

Although I do periodically poll traditional softwareupdate servers for new updates, repeatedly doing so for iCloud updates doesn’t appear a good way to proceed, and could in any case be misleading. On the other hand I don’t think it’s intended that apps like SilentKnight should check for prerelease updates as a matter of course, and abuse of that option could lead to its removal. In other words, Apple wants full control over when your Mac can and will update to new versions of XProtect, presumably because Sequoia will be getting different updates in the future.

Summary

  • If your Mac hasn’t been upgraded to Sequoia, XProtect updates continue as usual, and SilentKnight will continue to be able to find and install them as it has done in the past.
  • If your Mac is running Sequoia 15.0 to 15.1.1, then it will continue to be offered XProtect updates both ways, and should continue to do so until you update it to 15.2.
  • Macs running 15.2 and later now get XProtect updates differently. Neither you nor SilentKnight can alter that, unless you want to try obtaining prerelease updates through the xprotect command in Terminal. While SilentKnight and Skint will warn you when an XProtect update is expected, you should rely on macOS to handle those updates for you.

Is it worth storing Time Machine backups on a faster drive?

Folk wisdom is that there’s little point in wasting a faster drive to store your Time Machine backups, because when those backups are made, their write speed is throttled by macOS. This article considers how true that might be, and what benefits there might be to using faster solid-state storage.

I/O Throttling

Documentation of I/O policy is in the man page for the getiopolicy_np() call in the Standard C Library, last revised in 2019, and prevailing settings are in sysctl’s debug.lowpri_throttle_* values. These draw a distinction between I/O to local disks, being “I/O sent to the media without going through a network” such as I/O “to internal and external hard drives, optical media in internal and external drives, flash drives, floppy disks, ram disks, and mounted disk images which reside on these media”, and those to “remote volumes” “that require network activity to complete the operation”. The latter are “currently only supported for remote volumes mounted by SMB or AFP.”

Inclusion of remote volumes is a relatively recent change, as in the previous version of this man page from 2006, they were explicitly excluded as “remote volumes mounted through networks (AFP, SMB, NFS, etc) or disk images residing on remote volumes.”

Five policy levels are supported:

  • IOPOL_IMPORTANT, the default, where I/O is critical to system responsiveness.
  • IOPOL_STANDARD, which may be delayed slightly to allow IOPOL_IMPORTANT to complete quickly, and presumably referred to in sysctl as Tier 1.
  • IOPOL_UTILITY, for brief background threads that may be throttled to prevent impact on higher policy levels, in Tier 2.
  • IOPOL_THROTTLE, for “long-running I/O intensive work, such as backups, search indexing, or file synchronization”, that will be throttled to prevent impact on higher policy levels, in Tier 3.
  • IOPOL_PASSIVE, for mounting files from disk images, and the like, intended more for server situations so that lower policy levels aren’t slowed by them.

However, the idea that throttled I/O is intentionally slowed at all times isn’t supported by the explanation of how throttling works: “If a throttleable request occurs within a small time window of a request of higher priority, the thread that issued the throttleable I/O is forced to a sleep for a short period. This slows down the thread that issues the throttleable I/O so that higher-priority I/Os can complete with low-latency and receive a greater share of the disk bandwidth.”

Settings in sysctl for Tier 3 give the window duration as 500 milliseconds, and the sleep period as 200 ms, except for SSDs, whose sleep period is considerably shorter at just 25 ms. Those also set a maximum size for I/O at 131,072 bytes. You can view those settings in the debug section of Mints’ sysctl viewer.

Some years ago, it was discovered that the user can globally disable IOPOL_THROTTLE and presumably all other throttling policy with the command
sudo sysctl debug.lowpri_throttle_enabled=0
although that doesn’t persist across restarts, and isn’t documented in the man page for sysctl. This is provided in an option in St. Clair Software’s App Tamer, to “Accelerate Time Machine backups”, for those who’d rather avoid the command line.

Performance checks

Before each Time Machine backup starts, backupd runs two checks of disk performance, by writing one 50 MB file and 500 4 KB files to the backup volume, reported in the log as
Checking destination IO performance at "/Volumes/ThunderBay2"
Wrote 1 50 MB file at 286.74 MB/s to "/Volumes/ThunderBay2" in 0.174 seconds
Concurrently wrote 500 4 KB files at 23.17 MB/s to "/Volumes/ThunderBay2" in 0.088 seconds

With normal throttling in force, there’s surprisingly wide variation that appears only weakly related to underlying SSD performance, as shown in the table below.

tmbackupssds2

Results from the three first full backups are far greater than those for subsequent automatic backups, with single-file tests recording 900-1100 MB/s, and multi-file tests 75-80 MB/s. Routine backups after those ranged from 190-365 MB/s and 3-32 MB/s, less than half. Most extraordinary are the results for the OWC Express 1M2 enclosure when used with an M3 Pro: on the first full backup, the 50 MB test achieved 910 MB/s, but an hour later during the first automatic backup that fell to 191 MB/s.

tmfirstbackup

Evidence suggests that in macOS Sequoia, at least, first full backups may now run differently, and make more use of P cores, as shown in the CPU History window above. In comparison, automatic backups are confined to the E cores. However, the backup itself still runs at a tenth of the measured write speed of the SSD.

Time Machine runs the first full backup as a ‘manual backup’ rather than scheduling it through the DAS-CTS dispatching mechanism. It’s therefore plausible that initial backups aren’t run at a Background QoS, so given access to P cores, and at a higher I/O throttling policy than IOPOL_THROTTLE, so being given higher priority access to I/O.

Changing policy

When tested here previously, disabling throttling policy appeared to have little effect on Time Machine’s initial performance checks, but transfer rates during backups were as much as 150% of those achieved when throttling policy was in force.

The big disadvantage of completely disabling throttling policy is that this can only be applied globally, so including I/O for Spotlight indexing, file synchronisation, other background tasks and those needing high-priority access to I/O. Leaving the policy disabled in normal circumstances could readily lead to adverse side-effects, allowing Spotlight indexing threads to swamp important user storage access, for example.

SSD or hard disk?

Despite wide variation in test results, all those for the 50 MB file were far in excess of the highest write speed measured for any equivalent hard disk at 148 MB/s (for the outer disk). Overall backup speeds for the first full backup to a USB4 SSD were also double that hard disk write speed. When throttling does occur, the period of sleep enforced on writes to a hard disk is eight times longer than that for an SSD, making the impact of I/O throttling greater for a hard drive than an SSD.

Another good reason for preferring SSD rather than hard disk storage is the use of APFS, and its tendency over time to result in severe fragmentation in the file system metadata on hard disks. Provided that an SSD has Trim support it should continue to perform well for many years.

Conclusions

  • macOS applies throttling policies on I/O with both local and networked storage to ensure that I/O-intensive tasks like backing up don’t block higher priority access.
  • Disabling those policies isn’t wise because of its general effects.
  • Those policies use different settings for I/O to SSDs from those for other types of storage to allow for their different performance.
  • First full backups to SSD appear to run at higher priority to allow them to complete more quickly.
  • As a result, effective write speeds to SSDs during Time Machine backups are significantly faster than could be achieved to hard disks.
  • When the consequences of using APFS on hard disks are taken into account, storing Time Machine backups on SSD has considerable advantages in terms of both speed and longevity.

Apple has just released updates to XProtect and XProtect Remediator

Apple has just released updates to XProtect for all supported versions of macOS, bringing it to version 5284, and to XProtect Remediator for all macOS from Catalina onwards, to version 149. As usual, Apple doesn’t release information about what security issues these updates might add or change.

Yara definitions in this version of XProtect augment existing rules for dylibs in MACOS.ADLOAD, and add 2 new rules for MACOS.DOLITTLE, 1 for MACOS.PIRRIT, 5 for MACOS.BUNDLORE and 5 for MACOS.ADLOAD.

XProtect Remediator adds a new scanner module for Bundlore. There are no changes to Bastion rules for the behavioural version of XProtect (Ventura and later).

You can check whether this update has been installed by opening System Information via About This Mac, and selecting the Installations item under Software.

A full listing of security data file versions is given by SilentKnight, LockRattler and SystHist for El Capitan to Sequoia available from their product page. If your Mac hasn’t yet installed this update, you can force it using SilentKnight, LockRattler, or at the command line.

If you want to install these as named updates in SilentKnight, their labels are XProtectPayloads_10_15-149 and XProtectPlistConfigData_10_15-5284.

For Sequoia 15.2 and later only: XProtect updates are no longer supplied through Software Update, softwareupdate, or SilentKnight. The only way that your Mac can obtain XProtect updates is through a connection to iCloud, which is supposed to happen automatically. If your Mac hasn’t yet been updated to version 5284, you can try using the Terminal command
sudo xprotect update --prerelease
(with a double hyphen not an m-dash)
That should download and install this update even though it hasn’t yet been generally released through iCloud.

For Sequoia 15.1.1 and earlier only: this update hasn’t yet appeared in iCloud, which may still return an XProtect version of 5283. If you download and install it using Software Update, softwareupdate or SilentKnight, then once that’s complete you need to update the primary XProtect bundle in Terminal using the command
sudo xprotect update
then entering your admin password. If you’re unsure what to do, this article explains it comprehensively and simply.

I have updated the reference pages here which are accessed directly from LockRattler 4.2 and later using its Check blog button.

I maintain lists of the current versions of security data files for Sequoia on this page, for Sonoma on this page, Ventura on this page, Monterey on this page, Big Sur on this page, Catalina on this page, Mojave on this page, High Sierra on this page, Sierra on this page, and El Capitan on this page.

[Updated blind-guessing the changes in 15.2, at 2030 GMT 17 December 2024.]

Tune for Performance: Core types

When running apps on Intel Macs, because all their CPU cores are identical, the best you can hope for is that tasks make use of the number of cores available by running in multiple threads. Even single-threaded processes running on Apple silicon Macs get a choice of CPU core type, and this article explains the limited control you have over that.

m4coremanagement1

In my current model of CPU core allocation by macOS, shown in part above, Quality of Service (QoS) is the factor determining which core type a thread will be allocated to. QoS is normally hard-coded into an app, and seldom exposed to the user’s control.

If a thread is assigned a minimal QoS of Background (value 9), or less, then macOS will allocate it to be run on E cores, and it won’t be run on a P core. With a higher QoS, macOS allocates it to a P core if one is available; if not, then it will be run on E cores, with that cluster running at high frequency. Thus, threads with a higher QoS can be run on either P or E cores, depending on their availability.

taskpolicy

There are times when you might wish to accelerate completion of threads normally run exclusively on E cores. For example, knowing that a particular backup might be large, you might elect to leave the Mac to get on with that as quickly as possible. There are two methods that appear intended to change the QoS of processes: the command tool taskpolicy, and its equivalent code function setpriority().

Experience with using those demonstrates that, while they can be used to demote threads to E cores, they can’t promote processes or threads already confined to E cores so that they can use both types. For instance, the command
taskpolicy -B -p 567
that should promote the process with PID 567 to run on both types of core, has no effect on processes or their threads that are run at low QoS. taskpolicy can be used to demote processes and their threads with higher QoS to use only E cores, though. Running the command
taskpolicy -b -p 567
does confine all threads to the E cluster, and can be reversed using the -B option for threads with higher QoS (but not those set to low QoS by the process).

qoscores1

That can be seen in this CPU History window from Activity Monitor. An app has run four threads, two at low QoS and two at high QoS. In the left side of each core trace they are run on their respective cores, as set by their QoS. The app’s process was then changed using taskpolicy -b and the threads run again, as seen in the right. The two threads with high QoS are then run together with the two with low QoS in the four E cores alone.

The best way to take advantage of this ability to demote high QoS threads to run them on E cores is in St. Clair Software’s excellent utility App Tamer.

Virtualisation

macOS virtual machines running on Apple silicon chips are automatically assigned a high QoS, and run preferentially on P cores. Thus, even when running threads at low QoS, those are run within threads on the host’s P cores. This remains the only known method of electively running low QoS threads on P cores.

Game Mode, CPU cores

In the Info.plist of an application, the developer should assign that app to one of the standard LSApplicationCategoryTypes. If that’s one of the named game types, macOS automatically gives that app access to Game Mode. Among its benefits are “highest priority access” to the CPU cores, in particular the E cores, whose use by background threads is reduced. Other benefits include highest priority access to the GPU, and doubled Bluetooth sampling rate to reduce latency for input controllers and audio output. Game Mode is automatically turned on when the app is put into full-screen mode, and turned off when full-screen mode is stopped, although the user also has manual control through the mode’s item in the menu bar.

In practice, while this is beneficial to many games, it has little if any use for modifying core type allocation in other circumstances. As the user can’t modify an app’s Info.plist without breaking its signature and notarization, this is only of use to developers.

Summary

  • The QoS assigned by an app to its threads is used by macOS to determine which core type to allocate them to.
  • Threads with a low (Background, 9) QoS are run exclusively on E cores. Those with higher QoS are run preferentially on P cores, and normally only on E cores when no P core is available.
  • App Tamer and taskpolicy can be used to demote higher QoS threads to be run on E cores, but low QoS threads can’t be promoted to be run on P cores.
  • macOS VMs run on P cores, so low QoS threads running in a VM will be run on P cores, and can be used to accelerate Background threads.
  • Game Mode gives games priority access to CPU cores, particularly to E cores, but users can’t elect to run other apps in Game Mode, and there don’t appear to be benefits in doing so.
  • If you feel an app would benefit from user control over CPU core type allocation through access to their QoS, suggest it to the app’s developer.

Explainer

Quality of Service (QoS) is a property of each thread in a process, and normally chosen from the macOS standard list:

  • QoS 9 (binary 001001), named background and intended for threads performing maintenance, which don’t need to be run with any higher priority.
  • QoS 17 (binary 010001), utility, for tasks the user doesn’t track actively.
  • QoS 25 (binary 011001), userInitiated, for tasks that the user needs to complete to be able to use the app.
  • QoS 33 (binary 100001), userInteractive, for user-interactive tasks, such as handling events and the app’s interface.

There’s also a ‘default’ value of QoS between 17 and 25, an unspecified value, and in some circumstances you might come across others.

Solutions to Saturday Mac riddles 286

I hope that you enjoyed Saturday’s Mac Riddles, episode 286. Here are my solutions to them.

1: Keeps an eye on exercise for checking 2, 3, memory and more.

Click for a solution

Activity Monitor

Keeps an eye on (monitor) exercise (activity) for checking 2, 3, memory and more (what Activity Monitor does).

2: Champion’s reward in disarray for the heart of your Mac, shown in 1.

Click for a solution

CPU

Champion’s reward (a cup) in disarray (rearranged to cpu) for the heart of your Mac (its CPU), shown in 1 (it is).

3: Endless high status in hiding place for treasure can be shown in 1.

Click for a solution

Cache

Endless high status (cachet without the last letter) in hiding place for treasure (a cache) can be shown in 1 (when Content Caching service is enabled, it’s one of the tabs or panes in Activity Monitor).

The common factor

Click for a solution

The latter two are tabs or views in the first.

I look forward to your putting alternative cases.

Are sparse bundles faster than disk images?

Following tests over two years ago, I recommended the use of sparse bundles (UDSB) rather than plain UDIF read-write (UDRW) disk images, because of their faster and more consistent performance. Since then, read-write disk images have adopted a sparse file format, making them more space-efficient. However, their write performance has remained substantially lower than sparse bundles, and the latter remain the preferred format.

More recent performance tests have confirmed this in Sequoia, as shown in the table below.

xferdiskimage24

Most recently, tests of file compression showed relatively poor performance within a sparse bundle, with overall compression speed only 57% that of the SSD hosting the bundle despite apparently good write speeds. This article explores why, and whether that should alter choice of disk images.

Consistency in write speed

As previous articles note, inconsistent performance troubles disk images. Because of their complex bundle structure and storage across thousands of band files, it’s important to consider whether this poor performance is merely a reflection of that inconsistency.

sparsebundlewritesp0

The original Stibium write speed measurements, separated out from the collation shown in that recent article, show more dispersion about the regression line than other tests. As those are based on a limited number of file sizes, a total of 130 write speed measurements were performed using file sizes ranging from 4.4 MB to 3.0 GB, 50 of them being randomly chosen.

sparsebundlewritesp1

Those confirm that some individual write speeds are unexpectedly low, and dispersion isn’t as low as hoped for, but don’t make inconsistency a plausible explanation.

Band size

Unlike other types of disk image, data saved in sparse bundles is contained in many smaller files termed bands, and the maximum size of those band files can be set when a sparse bundle is created. By default, band size is set at 8.4 MB and there are only two ways to use a custom size, either when creating the sparse bundle using the command hdiutil create or in my free utility Spundle. Although those allow you to set a preferred band size, the size actually used may differ slightly from that.

Band size could have significant effects on the performance and stability of sparse bundles, as it determines how many band files are used to store data. Using a size that results in more than about 100,000 band files has in the past (with HFS+ at least) made sparse bundles prone to failure.

To assess the effect of different band sizes on compression rate, I therefore repeated exactly the same test file compression in sparse bundles with 12 band sizes ranging from 2.0 to 1020 MB, as measured rather than the value set.

sparsebundlebandstime

In the graph above, time to complete the compression task is shown for each of the band sizes tested, and shows a minimum time (fastest compression) at a band size of 15.4 MB, of about 8.3 seconds, significantly lower than the 11.08 seconds at the default of 8.4 MB. Band sizes between 2.0-8.4 MB showed little differences, but increasing band size to 33.8 MB and greater resulted in much slower compression.

sparsebundlebandsrate

When expressed as compression rates, peak performance at a band size of 15.4 MB is even clearer, and approaches 1.9 GB/s, more than twice that of a read-write disk image, but still far below rates in excess of 2.6 GB/s found for the USB4 and internal SSDs. With band sizes above 33.8 MB, compression rates fall below those of a read-write disk image.

Another way of looking at optimum band size is to convert that into the number of band files required. Fastest rates were observed here in sparse bundles that would have about 6,000-7,000 bands in total when the sparse bundle is full, and in this case with 2,000-2,300 band files in use. Performance fell when the maximum number of band files fell below 3,000, or those in use fell below 1,000.

Streaming

Compression tests impose different demands on storage from conventional read or write benchmarks because file data to be compressed is streamed by reading data from storage, and writing compressed data out to the same storage device. Although source and destination are separate files, allowing simultaneous reading and writing, if those files are stored in common band files, it’s likely that access has to be limited and can’t be simultaneous.

As observed here, that’s likely to result in performance substantially below that expected from single-mode transfer tests. Unfortunately, it’s also extremely difficult to measure attempts to simultaneously read and write from different files in the same storage medium.

Conclusions

  • Sparse bundles (UDSB) remain generally faster in use than read-write (UDRW) disk images.
  • Sparse bundle performance is sensitive to band size.
  • Default 8.4 MB bands aren’t fastest in all circumstances.
  • When sparse bundle performance is critical, it may be worth optimising band file size instead of using the default.
  • Tasks that stream data from and back to the same storage are likely to run more slowly in a sparse bundle than on its host storage.

Previous articles

Dismal write performance of Disk Images
Which disk image format?
Disk Images: Performance

Last Week on My Mac: Compression models

Over the fifty years since I started using computers, one of the greatest changes has been who does the waiting. In my early days, it was me, in some cases waiting overnight for batches to be processed on a mainframe computer. By the mid 1990s I had to wait a couple of days for some of my optimisation runs to complete on the Mac in my office. Since then, as Macs have got progressively faster, they have come to do the waiting for me. Whether I’m editing an image or writing an article, my Mac keeps pace with almost everything I do.

One notable if infrequent exception is when there’s a macOS update. On a newer Apple silicon model, installation itself is far quicker than when Apple changed to using the SSV in Big Sur, but there’s always that wait for the downloaded update to be “prepared” in the background. Much of that is thought to be decompression, which minimises the size of downloads by putting the burden on the Mac to expand and organise what needs to be installed.

Data compression is widely used in modern operating systems. Take a look in Activity Monitor’s Memory view, and at the bottom right you’ll see how much compressed memory is in use, here currently over 1 GB. It’s used to save space in macOS, where many system files are stored in compressed formats. Compression is also an integral part of many media formats, whether still or moving images, or audio. Unless they’re compressed, we’d only be able to enjoy a small fraction of the media we now consume so voraciously.

It’s understandable that compression is thus one of the best-studied tasks in computing. Over decades of intensive research and practical experience, we have learned that the most powerful methods of compressing data can also take the most processing time. The effectiveness of compression is generally expressed in terms of compression ratio, the ratio of original file size to that of the compressed file. Thus all effective compression methods should result in a compression ratio of more than 1. You’ll also come across percentage space saving, the reduction in size compared to the original. If a compression method shrinks a 10 GB file to 5 GB, then its compression ratio is 10/5 = 2, and its space saving is (1 – 5/10) x 100 = 50%.

One of the most efficient compression techniques has been that in nanozip 0.09a, for instance, which can achieve a compression ratio of 5.3, or a space saving of 81%, on English text taken from Wikipedia. This illustrates the trade-offs made in such efficient techniques, as to achieve that it takes almost 128 seconds to compress 100 MB, a rate of 0.783 MB/s. That makes it of little everyday use and unsuitable for macOS updates, where it also couldn’t achieve the same high compression ratio because the data are binary rather than English text.

Optimising compression isn’t as simple as it might appear. There’s an inverse relationship between the time spent compressing data and the amount of compressed data to be written, as there is with many similar tasks. The more sophisticated the compression and the higher the compression ratio, the less data there is to be written out, although there’s still the same amount of data to be read. Using the example of a compression ratio of 2, 10 GB of input data has to be read and only 5 GB written out, so unless write speed is less than half read speed, reading the input data is likely to be more rate-limiting.

Compression is also representative of many other types of everyday tasks, as it consists of three sub-tasks:

  1. read data from disk
  2. process it (encode, decode, transcode)
  3. write the transformed data to disk

Unless you use small file sizes, this is usually performed on data streamed from storage and back to storage, rather than on single chunks of data in memory.

To understand what limits performance of any of those everyday tasks, we need to understand how each of its sub-tasks is limited, and how those limitations interact. In some cases, such as preparation of macOS updates, time taken appears to be determined by the processing required in the second step. In the past, Apple has run all that in a single thread to minimise impact on concurrent use of other apps in the foreground. In other tasks, such as encrypting files, stage 2 processing should be fastest, making it most likely that disk access is limiting.

Although we can’t apply conclusions drawn from studying any specific compression method, we can use it as a model to develop tools that we can then apply to other tasks. Over the last week, I’ve published two articles here discussing how to do that.

In the first I asked how we can investigate whether more threads will run a task faster. We know that for my compression task they do, but that may not be true for the tasks you’re most interested in accelerating. In rare cases, an app may provide a control to set how many threads to use, and it’s easy to use that to investigate. It’s more likely that your app has no such control, but one way around that is to run it in a virtual machine, where you can pick the number of virtual cores to host that VM.

Timing the performance of your app with test files of known size should give a performance rate, and that can help identify which of those sub-tasks is probably limiting overall performance. If your app transcodes video, for example, and you time how long it takes to complete all three sub-tasks on a 10 GB video clip, you can work out its transcoding rate in GB/s. If that test clip takes 20 seconds to read that test file, transcode it, and write out the converted video, then its overall transcoding rate is 0.5 GB/s.

The next article considers how you might work out whether running that task on high-speed storage would improve that overall performance. Although it looks unlikely that a transcoding rate of 0.5 MB/s would be altered by running it on a Thunderbolt 3 disk with its 2.3 GB/s write speed, it’s worth comparing performance on the faster internal SSD to check that, and decide whether a faster USB4 SSD might be better.

By the time that you’ve worked through those tests, you should have better insight into which of those three sub-tasks is limiting performance, how you might be able to improve them, and compare current performance in the overall transcoding rate against attempts at improvement. As I wrote last week, the only way to do that is with objective measurements such as that transcoding rate.

Next week I’ll continue this series by considering how you can control the type of CPU core threads run on, and some related issues about sparse bundles and the performance of Time Machine backup storage.

Saturday Mac riddles 286

Here are this weekend’s Mac riddles to entertain you through family time, shopping and recreation.

1: Keeps an eye on exercise for checking 2, 3, memory and more.

2: Champion’s reward in disarray for the heart of your Mac, shown in 1.

3: Endless high status in hiding place for treasure can be shown in 1.

To help you cross-check your solutions, or confuse you further, there’s a common factor between them.

I’ll post my solutions first thing on Monday morning.

Please don’t post your solutions as comments here: it spoils it for others.

A brief history of Activity Monitor

In the days of Classic Macs, most of our concerns centred on memory rather than CPU, disk or network performance. Tools for managing memory flourished, and I don’t recall any utility provided in Mac OS that looked more broadly. That changed when Mac OS X arrived, and we started taking an interest in Process Viewer and CPU Monitor.

cpumonitor2001

CPU Monitor, seen here in 2001 with its two floating chart views, was a first step in development. I suspect this was taken on my QuickSilver Power Mac G4 with its dual processors, hence the pair of CPU charts.

processviewer2001

Process Viewer is a more obvious ancestor of the modern Activity Monitor, with its list of processes in a column view. Note the surprisingly few system processes running at the time: only 34, compared with today’s list of several hundred.

activitymonitor2005

Activity Monitor integrated those features into its new app in Mac OS X 10.3 Panther in 2003, and is shown here in 10.4 Tiger from a couple of years later, where it’s surprisingly similar to the current app. There are still only 72 processes running, though, and most have less than 5 threads.

activitymonitor2011

Here’s Activity Monitor with its CPU History window on an 8-core Mac Pro, running Mac OS X 10.7 Lion in 2011. The number of processes is still only growing slowly, and had reached 89.

instruments2012a

Xcode’s Instruments added an Activity Monitor template for developers wanting to monitor further details as they tested and debugged their code. At this stage it was limited to presenting the same fundamental measurements as were available in Activity Monitor, but these have since flourished into much greater depth.

instruments2012b

Two years later, in 2013 for OS X 10.9 Mavericks, Activity Monitor underwent revision to add a new tab for Energy. Unlike other panes, the ‘Energy Impact’ is given in arbitrary units rather than calculating Joules from power use over time. It was at about this time that the app also added a Cache pane analysing the performance of the Content Caching service, when enabled on the Mac.

activitymonitor2020i

Until 2020, Activity Monitor had dealt with CPUs with uniform cores. Above are the eight physical and eight Hyper-threaded cores in an 8-core Intel Xeon W in an iMac Pro from 2017, running a heavy load of over 700% CPU. With the first Apple silicon Macs, it had to display CPU use for two different types of core. Note how, by 2020, the total number of processes has shot up to 458.

activitymonitor2021m1

This is an example from one of the first base M1 Macs, with 4 Efficiency and 4 Performance cores displayed neatly in its CPU History window. Although Activity Monitor doesn’t take core frequency into account when measuring % CPU, and can’t display cluster frequencies, it remains one of the essential tools for everyone, whichever age and architecture their Mac.

Has Apple stopped updating EFI firmware?

If, like me, you pay close attention to firmware updates released with macOS, you may have noticed something highly unusual if not unique this week, in the firmware updates that came with macOS Sequoia 15.2, Sonoma 14.7.2 and Ventura 13.7.2: those could mark the end of an era.

All new Macs since Apple transitioned to using Intel processors have one of three classes of firmware:

  • Intel Macs without a T2 chip only have EFI firmware, whose version reads something like 529.140.2.0.0. These are model-specific.
  • Intel Macs with a T2 chip have firmware for both their Intel systems in EFI, and iBridge for the T2, giving them a double firmware version like 2069.40.2.0.0 (iBridge: 22.16.12093.0.0,0). All models with a T2 chip can run the same EFI and iBridge versions.
  • Apple silicon Macs have iBoot, with a version like 11881.61.3, which is common across all models.

This complexity was the reason for my first developing EFIcienC, predecessor to SilentKnight, compiling and maintaining databases of firmware versions, and trying to help those whose Macs stubbornly refused to update their EFI firmware when they should have done. This site still has long lists of the latest firmware versions for Macs running Catalina, for example.

EFIcienC01

silentknight11

As the number of supported Intel Macs without a T2 chip has steadily fallen, what used to be a long and complex list has shrunk to just seven models. With the release of macOS Sequoia 15.0, Sonoma 14.7 and Ventura 13.7, Apple stopped updating the EFI firmware for Intel Macs without T2 chips, which are now frozen as they were last June and July.

When Apple released Sequoia 15.2, Sonoma 14.7.2 and Ventura 13.7.2 this week, it appears to have ceased updating the EFI firmware in Intel Macs with T2 chips.

T2 models were updated to EFI 2069.0.0.0.0 and iBridge 22.16.10353.0.0,0 when Sequoia 15.0 was released on 16 September 2024. No firmware updates came in the rapid update to 15.0.1, but in 15.1 those models were updated to EFI 2069.40.2.0.0 and iBridge 22.16.11072.0.0,0.

Sequoia 15.1.1 also didn’t bring any change in firmware, and 15.2 updates T2 models to EFI 2069.40.2.0.0 and iBridge 22.16.12093.0.0,0: while the T2’s firmware has been updated, no change has been made in the EFI version. As far as I’m aware that’s the first time that has happened since the initial releases of T2 firmware at the end of 2017 and early 2018. The first record I have of their version numbers is of EFI 1037.147.1.0.0 and iBridge 17.16.16065.0.0,0, since when they have come a very long way.

While I’m sure that Apple could still update EFI firmware if necessary, I think we have seen the last planned updates, with only iBridge for the T2 and iBoot for Apple silicon Macs to continue to advance with future releases of macOS. As the T2 is also Apple silicon, that means an end to the last firmware for Intel processors, after more than 18 years. The end of an era indeed, and time to pour one out for EFI firmware in Macs.

I wouldn’t like to hazard a guess at how much longer Apple will continue to support iBridge firmware for T2 chips. Firmware updates aren’t a required part of macOS updates, and most Macs cease to enjoy them well before they’re updated to their last macOS.

Tune for Performance: Do you really need a big internal SSD?

The most common economy that many make when specifying their next Mac is to opt for just 512 GB internal storage, and save the $/€/£600 or so it would cost to increase that to 2 TB. After all, if you can buy a 2 TB Thunderbolt 5 SSD for around two-thirds of the price, why pay more? And who needs the blistering speed of that expensive internal storage when your apps work perfectly well with a far cheaper SSD? This article considers whether that choice matters in terms of performance.

To look at this, I’m going to use the same compression task that I used in this previous article, my app Cormorant relying on the AppleArchive framework in macOS to do all the heavy lifting. As results are going to differ considerably when using other apps and other tasks, I’d like to make it clear that this can’t reach general conclusions that apply to every task and every app: your mileage will vary. My purpose here is to show how you can work out whether using a slower disk will affect your app’s performance.

Methods

In that previous article, I concluded that compression speed was unlikely to be determined by disk performance, as even with all 10 P cores running compression threads, that rate only reached 2.28 GB/s, around the same as write speed to a good Thunderbolt 3 SSD. For today’s tests, I therefore set Cormorant to use the default number of threads (all 14 on my M4 Pro) so it would run as fast as the CPU cores would allow when compressing my standard 15.517 GB IPSW test file.

I’m fortunate to have a range of SSDs to test, and here use the 2 TB internal SSD of my Mac mini M4 Pro, an external USB4 enclosure (OWC Express 1M2) with a 2 TB Samsung 990 Pro SSD, and an external 2 TB Thunderbolt 3 SSD (OWC Envoy Pro SX). As few are likely to have access to such a range, I included two disk images stored on the internal SSD, a 100 GB sparse bundle, and a 50 GB read-write disk image, to see if they could be used to model external storage. All tests used unencrypted APFS file systems.

The first step with each was to measure its write speed using Stibium. Unlike more popular benchmarking apps for the Mac, Stibium measures the speed across a wide range of file sizes, from 2 MB to 2 GB, providing more insight into performance. After those measurements, those test files were removed, the large test file copied to the volume, and compressed by Cormorant at high QoS with the default number of threads.

Disk write speeds

compressionbydisk1

Results in each test followed a familiar pattern, with rapidly increasing write speeds to a peak at a file size of about 200 MB, then a steady rate or slow decline up to the 2 GB tested. The read-write disk image was a bit more erratic, though, with high write speeds at 800 and 1000 MB.

At 2 GB file size, write speeds were:

  • 7.69 GB/s for the internal SSD
  • 7.35 GB/s for the sparse bundle
  • 3.61 GB/s for the USB4 SSD
  • 2.26 GB/s for the Thunderbolt 3 SSD
  • 1.35 GB/s for the disk image.

Those are in accord with my many previous measurements of write speeds for those types of storage.

Compression rates

Times to compress the 15.517 GB test file ranked differently:

  • 5.57 s for the internal SSD
  • 5.84 s for the USB4 SSD
  • 9.67 s for the sparse bundle
  • 10.49 s for the Thunderbolt 3 SSD
  • 16.87 s for the disk image.

When converted to compression rates, sparse bundle results are even more obviously an outlier, as shown in the chart below.

compressionbydisk2

There’s a roughly linear relationship between measured write speed and compression rate in the disk image, Thunderbolt 3 SSD, and USB4 SSD, and little difference between the latter and the internal SSD. These suggest that disk write speed becomes the rate-limiting factor for compression when write speed falls below about 3 GB/s, but above that faster disks make little difference to compression rate.

Poor performance of the sparse bundle was a surprise, given how close its write speeds are to those of the host internal SSD. This is probably the result of compression writing a single very large file across its 14 threads; as the sparse bundle stores file data on a large number of band files, their overhead appears to have got the better of it. I will return to look at this in more detail in the near future, as sparse bundles have become popular largely because of their perceived superior performance.

The difference in compression rates between USB4 and Thunderbolt 3 SSDs is also surprisingly large. Of course, a Mac with fewer cores to run compression threads might not show any significant difference: a base M3 chip with 4 P and 4 E cores is unlikely to achieve a compression rate much in excess of 1.5 GB/s on its internal SSD because of its limited cores, so the restricted write speed of a Thunderbolt 3 SSD may not there become the rate-limiting factor.

Conclusions

  • The rate-limiting step in task performance will change according to multiple factors, including the effective use of multiple threads on multiple cores, and disk performance.
  • There’s no simple model you can apply to assess the effects of disk performance, and tests using disk images can be misleading.
  • You can’t predict whether a task will be disk-bound from disk benchmark performance.
  • Even expensive high-performance external SSDs can result in noticeably poor task performance. Maybe that money would be better spent on a larger internal SSD after all.

What has changed in macOS Sequoia 15.2?

The macOS 15.2 update includes the second phase of AI support for Apple silicon Macs, introducing the Image Playground app, and integrated ChatGPT support in both Siri and Writing Tools. AI now extends support to several of the non-US variants of English, including English (UK), although non-English languages won’t gain support until next year.

Apple’s release notes are a real joy to read and contain more detailed information at last, including the following:

  • Photos enhancements,
  • Safari supports background images for its Start Page, tries to use HTTPS on all sites, and more,
  • Sharing item locations in Find My,
  • Sudoku for News+,
  • Presenter preview for AirPlay,
  • Pre-market quotes in Stocks.

Among the more significant bugs fixed is that Apple silicon virtualisation on M4 Macs can now open all VMs, including macOS guests before 13.4. For those running Ruby with YJIT enabled, this update should fix kernel panics with M4 chips. Further fixes are detailed in the developer release notes, and enterprise release notes are here.

Security release notes are available here, and list 42 entries including 4 in the kernel, none of which Apple reports may already have been exploited.

iBoot firmware on Apple silicon Macs is updated to version 11881.61.3, and T2 firmware to 2069.40.2.0.0 (iBridge: 22.16.12093.0.0,0). The macOS build number is 24C101, with kernel version 24.2.0.

Version changes in bundled apps include:

  • Books, version 7.2
  • Freeform, version 3.2
  • iPhone Mirroring, version 1.2
  • Music, version 1.5.2
  • News, version 10.2
  • Passwords, version 1.2
  • Safari, version 18.2 (20620.1.16.11.8)
  • Screen Sharing, version 5.2
  • Stocks, version 7.1
  • TV, version 1..5.2
  • Tips, version 15.2
  • VoiceMemos, version 3.1.

Inevitably, there are many build increments in components related to Apple Intelligence, and a great many across private frameworks. Other significant changes to /System/Library include:

  • Screen Time, build increment
  • Siri, version increment
  • VoiceOver, build increment
  • Kernel extensions including AGX… kexts, AOP Audio kexts, AppleEmbeddedAudio, AppleUSBAudio, and several virtualisation kexts
  • One new kernel extension, AppleDisplayManager
  • APFS to version 2317.61.2
  • Most of the Core frameworks have build increments
  • FileProvider framework, build increment
  • Virtualisation framework, build increment
  • PrivateCloudCompute framework, new version
  • Spotlight frameworks, build increments
  • New private frameworks include Anvil, AppSystemSettings (and its UI relative), AskToDaemon, many Generative… frameworks involved with AI, OSEligibility, TrustKit, WalletBlastDoorSupport
  • Several qlgenerators have build increments.

After that lot, the next scheduled update to macOS Sequoia is in the New Year.

Apple has released macOS Sequoia 15.2, and security updates to 14.7.2 and 13.7.2

As eagerly anticipated, Apple has released the update to macOS 15.2 Sequoia, together with security updates to bring Sonoma to version 14.7.2, and Ventura to 13.7.2. There should also be Safari updates to accompany the latter two.

For Intel Macs, the Sequoia update is 2.72 GB in size, and for Apple silicon models it’s 3.45 GB.

Security release notes for Sequoia list 42 vulnerabilities fixed in the 15.2 update, including four in the kernel, although none are noted as being currently exploited. Release notes for Sonoma list 25, and those for Ventura list just 22.

iBoot is updated to version 11881.61.3 on Apple silicon Macs, and Intel Macs with T2 chips have their firmware updated to 2069.40.2.0.0, iBridge 22.16.12093.0.0,0. Sequoia 15.2 brings Safari version 18.2 (20620.1.16.11.8).

Later tonight I hope to post a summary of changes in 15.2, in a separate article as usual.

[Updated 1938 GMT 11 December 2024.]

Tune for Performance: Activity Monitor’s CPU view

Activity Monitor is one of the unsung heroes of macOS. If you understand how to interpret its rich streams of measurements, it’s thoroughly reliable and has few vices. When tuning for performance, it should be your starting point, a first resort before you dig deeper with more specialist tools such as Xcode’s Instruments or powermetrics.

How Activity Monitor works

Like Xcode’s Instruments and powermetrics, the CPU view samples CPU and GPU activity over brief periods of time, displays results for the last sampling period, and updates those every 1-5 seconds. You can change the sampling period used in the Update Frequency section of the View menu, and that should normally be set to Very Often, for a period of 1 second.

This was normally adequate for many purposes with older M-series chips, but thread mobility in M4 chips can be expected to move threads from core to core, and between whole clusters, at a frequency similar to available sampling periods, and that loses detail as to what’s going on in cores and clusters, and can sometimes give the false impression that a single thread is running simultaneously on multiple cores.

However, sampling frequency also determines how much % CPU is taken by Activity Monitor itself. While periods of 0.1 second and less are feasible with powermetrics, in Activity Monitor they would start to affect its results. If you need to see finer details, then you’ll need to use Xcode Instruments or powermetrics instead.

% CPU

Central to the CPU view, and its use in tuning for performance, is what Activity Monitor refers to as % CPU, which it defines as the “percentage of CPU capability that’s being used by processes”. As far as I can tell, this is essentially the same as active residency in powermetrics, and it’s vital to understand its strengths and shortcomings.

Take a CPU core that’s running at 1 GHz. Every second it ‘ticks’ forward one billion times. If an instruction were to take just one clock cycle, then it could execute a billion of those every second. In any given second, that core is likely to spend some time idle and not executing any instructions. If it were to execute half a billion instructions in any given second, and spend the other half of the time idle, then it has an idle residency of 50% and an active residency of 50%, and that would be represented by Activity Monitor as 50% CPU. So a CPU core that’s fully occupied executing instructions, and doesn’t idle at all, has an active residency of 100%.

To arrive at the % CPU figures shown in Activity Monitor, the active residency of all the CPU cores is added together. If your Mac has four P and four E cores and they’re all fully occupied with 100% active residency each, then the total % CPU shown will be 800%.

There are two situations where this can be misleading if you’re not careful. Intel CPUs feature Hyper-threading, where each physical core acquires a second, virtual core that can also run at another 100% active residency. In the CPU History window those are shown as even-numbered cores, and in % CPU they double the total percentage. So an 8-core Intel CPU then has a total of 16 cores, and can reach 1600% when running flat out with Hyper-threading.

coremanintel

cpuendstop

The other situation affects Apple silicon chips, as their CPU cores can be run at a wide range of different frequencies according to control by macOS. However, Activity Monitor makes no allowance for their frequency. When it shows a core or total % CPU, that could be running at a frequency as low as 600 MHz in the M1, or as high as 4,512 MHz in the M4, nine times as fast. Totalling these percentages also makes no allowance for the different processing capacity of P and E cores.

Thus an M4 chip’s CPU cores could show a total of 400% CPU when all four E cores are running at 1,020 MHz with 100% active residency, or when four of its P cores are running at 4,512 MHz with 100% active residency. Yet the P cores would have an effective throughput of as much as six times that of the E cores. Interpreting % CPU isn’t straightforward, as nowhere does Activity Monitor provide core frequency data.

tuneperf1

In this example from an M4 Pro, the left of each trace shows the final few seconds of four test threads running on the E cores, which took 99 seconds to complete at a frequency of around 1,020 MHz, then in the right exactly the same four test threads completed in 23 seconds on P cores running at nearer 4,000 MHz. Note how lightly loaded the P cores appear, although they’re executing the same code at almost four times the speed.

Threads and more

For most work, you should display all the relevant columns in the CPU view, including Threads and GPU.

tuneperf2

Threads are particularly important for processes to be able run on multiple cores simultaneously, as they’re fairly self-contained packages of executable code that macOS can allocate to a core to run. Processes that consist of just a single thread may get shuffled around between different cores, but can’t run on more than one of them at a time.

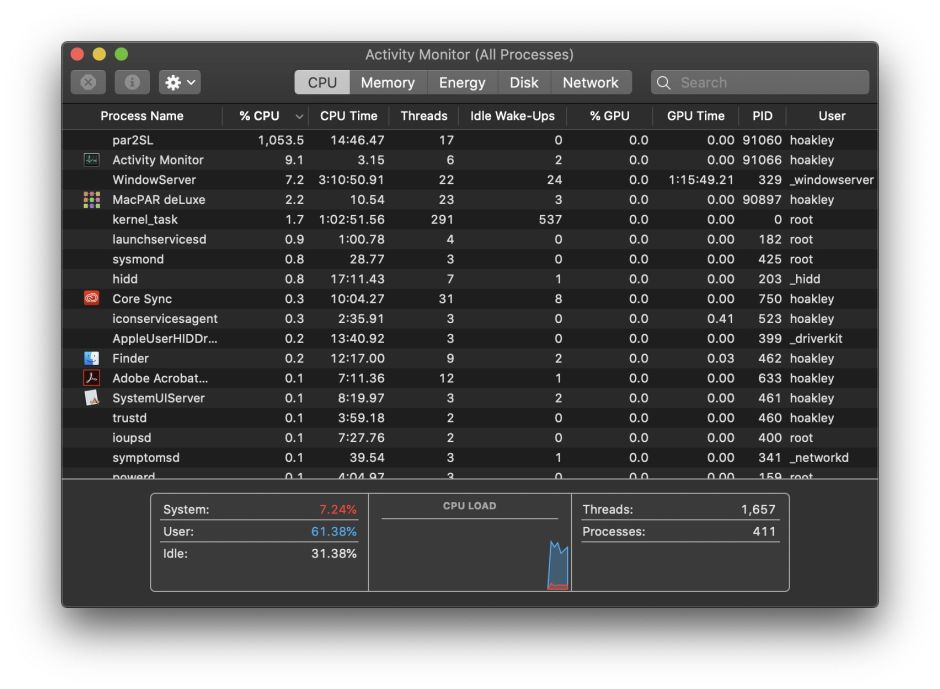
Another limitation of Activity Monitor is that it can’t tell you which threads are running on each core, or even which type of core they’re running on. When there are no other substantial threads active, you can usually guess which threads are running where by looking in the CPU History window, but when there are many active threads on both E and P cores, you can’t tell which process owns them.

You can increase your chances of being able to identify which cores are running which threads by minimising all other activity, quitting all other open apps, and waiting until routine background activities such as Spotlight have gone quiet. But that in itself can limit what you can assess using Activity Monitor. Once again, Xcode Instruments and powermetrics can make such distinctions, but can easily swamp you with details.

GPU and co-processors

Percentages given for the GPU appear to be based on a similar concept of active residency without making any allowance for frequency. As less is known about control of GPU cores, that too must be treated carefully.

Currently, Activity Monitor provides no information on the neural processing unit (ANE), or the matrix co-processor (AMX) believed to be present in Apple silicon chips, and that available using other tools is also severely limited. For example, powermetrics can provide power use for the ANE, but doesn’t even recognise the existence of the AMX.

Setting up

In almost all cases, you should set the CPU view to display All processes using the View menu. Occasionally, it’s useful to view processes hierarchically, another setting available there.

Extras

Activity Monitor provides some valuable extras in its toolbar. Select a process and the System diagnostics options tool (with an ellipsis … inside a circle) can sample that process every millisecond to provide a call graph and details of binary images. The same menu offers to run a spindump, for investigating processes that are struggling, and to run sysdiagnose and Spotlight diagnostic collections. The Inspect selected process tool ⓘ provides information on memory, open files and ports, and more.

Explainers

Residency is the percentage of time a core is in a specific state. Idle residency is thus the percentage of time that core is idle and not processing instructions. Active residency is the percentage of time it isn’t idle, but is actively processing instructions. Down residency is the percentage of time the core is shut down. All these are independent of the core’s frequency or clock speed.

multiterms1

When an app is run, there’s a single runtime instance created from its single executable code. This is given its own virtual memory and access to system resources that it needs. This is a process, and listed as a separate entity in Activity Monitor.

Each process has a main thread, a single flow of code execution, and may create additional threads, perhaps to run in the background. Threads don’t get their own virtual memory, but share that allocated to the process. They do, though, have their own stack. On Apple silicon Macs they’re easy to tell apart as they can only run on a single core, although they may be moved between cores, sometimes rapidly. In macOS, threads are assigned a Quality of Service (QoS) that determines how and where macOS runs them. Normally the process’s main thread is assigned a high QoS, and background threads that it creates may be given the same or lower QoS, as determined by the developer.

Within each thread are individual tasks, each a quantity of work to be performed. These can be brief sections of code and are more interdependent than threads. They’re often divided into synchronous and asynchronous tasks, depending on whether they need to be run as part of a strict sequence. Because they’re all running within a common thread, they don’t have individual QoS although they can have priorities.

Tune for Performance: do more threads run faster?

One of the most distinctive features about modern Macs is that they have multiple cores, in Apple silicon models a minimum of eight. For an app to be able to make use of more than one core (or its equivalent) at a time it needs to divide its processing into threads, discrete blocks of code that can be run on different cores by macOS. If it doesn’t do that, then running that app on a high-end Pro, Max or Ultra chip is unlikely to be significantly faster than on a base model (assuming that task is CPU-bound).

Activity Monitor

You might be able to get a good idea as to how well an app makes use of multiple cores from watching it in use in Activity Monitor’s CPU History window, but in many cases that isn’t conclusive, and needs to be confirmed.

To illustrate ways to tackle this, I take the example of file compression. Some methods lend themselves to multiple threads better than others, and some may be implemented in a way that won’t accelerate when several cores are available. For the occasional user this might make little difference, but if you were to spend much of your day waiting for 10-100 GB files to compress, it merits a little exploration.

polycore1

This CPU History window from a compression task run on an M4 Pro is typically unhelpful. A single file compression is seen in the group of 4-5 peaks in CPU in the right half of each trace. Although compression used all ten P cores, it appears to have been moved between P clusters, seen by comparing the timing of peaks on Cores 8 and 10, 9 and 11. At no time does the task appear to exceed 50% active residency on any of the cores, though. All you can do is guess as to what might be going on, and whether it might run faster on twelve or more P cores.

polycore2

On another run, the same task is reported to have reached a peak of 500% CPU in 12 threads, but would it exceed that on more P cores, given that 10 were available?

Timing performance

As usual, I’ve been cheating a little to generate those results, by using my simple compression-decompression app Cormorant, in which I control how many threads it uses. If the app you’re trying to investigate offers a similar feature, then you can set up a standard task, here the compression of a 15.517 GB IPSW file, and time how long it takes using different numbers of threads.

polycore3

The answers from Cormorant, which conveniently performs its own timing, are:

  • 1 thread takes 49.32 seconds
  • 2 take 26.74 s
  • 3 take 18.60 s
  • 4 take 14.29 s
  • 5 take 11.21 s.

So Cormorant’s compression can make good use of more P cores, although with diminishing returns.

Very few apps give you this level of control, though. The only other compression utility that does appear to is Keka.

polycore4

In its settings, you can give its tasks a maximum number of threads, and even run them at custom Quality of Service (QoS) if you want them to be run in the background on E cores, and not interrupt your work on P cores.

Controlling threads

There is one way that you can limit the effective number of threads used by an arbitrary app, and that’s to run it in a Virtual Machine, as you control the number of virtual cores that it uses. While you can just about run a macOS VM on a single core alone, I suggest that a more workable starting point is two cores, and you can increase that number up to the total of P cores in the host without causing problems.

VMs have other virtues, including their relative lack of background processes, allowing their virtual cores to be almost entirely devoted to your test task. However, as they can’t run apps from the App Store other than Apple’s free suite of Pages, Numbers and Keynote, that could prevent you from using them for testing.

To set up a VM for thread tests, I duplicated a standard Sonoma 14.7.1 VM so I could throw it away at the end, opened it with five virtual cores, and copied over the test app Cormorant and file. I then closed that VM down, set it to use 2 virtual cores, opened it and ran my test. I repeated that with an increasing number of virtual cores up to a total of 5. Compression times are:

  • 2 vCPUs take 30.13 seconds
  • 3 take 21.36 s
  • 4 take 17.18 s
  • 5 take 13.59 s.

Those are only slightly slower than their equivalents from the host tests above.

Analysis

polycore5

Plotting those results out using DataGraph, the lines of best fit follow power laws:

  • for real cores, time = 49.8863/(T^0.91169)
  • for virtual cores, time = 54.737/(T^0.854318)

where T is the number of threads. That explains the apparently diminishing returns with increasing numbers of threads, although the maths isn’t as simple as we might like.

A better way to look at this is by calculating the rate of compression in GB/s, simply by dividing the file size of 15.517 GB by each time. Here we end up with straight lines from linear regression, that are more amenable to thought.

polycore6

Those regressions are:

  • for real cores, rate of compression = 0.0464 + (0.264 x T)
  • for virtual cores, rate of compression = 0.102 + (0.206 x T)

which are more generally useful.

Tuning performance

This might appear over-elaborate and of little practical use, but we now have a much better understanding of the factors limiting compression performance:

  • The more threads compression uses, the shorter time a task will take.
  • There are limits to that improvement, though, when substantially more than 5 threads are used.
  • Compression rates achieved in M4 P cores are significantly lower than read or write speeds of the internal SSD, so aren’t likely to be limited by the speed of a faster SSD (TB3 or USB4).
  • As compression appears to be CPU-bound, faster P cores would also be expected to result in shorter times.
  • Improving the efficiency of the compression code could increase performance.
  • Compression in a VM runs at about 78% of speed on the host.

To see how reliable these are, I therefore repeated the Cormorant test using all 10 P cores on the host Mac, which took 6.80 seconds, a little more than half the time for 5 cores. That’s a compression rate of 2.28 GB/s, rather less than the 2.69 GB/s predicted by the linear regression. That’s now approaching the write speed of some TB3 SSDs, and the rate-limiting step could then change to be the write performance of the storage being used, rather than CPU cores.

Solutions to Saturday Mac riddles 285

I hope that you enjoyed Saturday’s Mac Riddles, episode 285. Here are my solutions to them.

1: This Scot with a volume was a notebook closed in 2019.

Click for a solution

MacBook

This Scot (Mac) with a volume (book) was a notebook closed in 2019 (it was a notebook Mac discontinued in 2019).

2: Ledger for baptismal water manages typefaces.

Click for a solution

Font Book

Ledger (book) for baptismal water (a font) manages typefaces (what this app does).

3: Root -1 with bound paper as a companion to the iMac with a handle.

Click for a solution

iBook

Root -1 (in maths, i) with bound paper (a book) as a companion to the iMac (it was) with a handle (it’s one of the few computers that features a handle).

The common factor

Click for a solution

They each include the word book into their name.

I look forward to your putting alternative cases.

How Thunderbolt 5 can be faster or not

Early reports of Thunderbolt 5 performance have been mixed. This article starts from Thunderbolt 3 and dives deeper into the TB5 specification to explain why it might not deliver the performance you expect.

Origins

Thunderbolt 3 claims to deliver up to 40 Gb/s transfer speeds, but can’t actually deliver that to a peripheral device. That’s because TB3 includes both 4 lanes of PCIe data at 32.4 Gb/s and 4 lanes of DisplayPort 1.4 at up to 32.4 Gb/s, coming to a total of nearly 65 Gb/s. But that’s constrained within its maximum of 40 Gb/s.
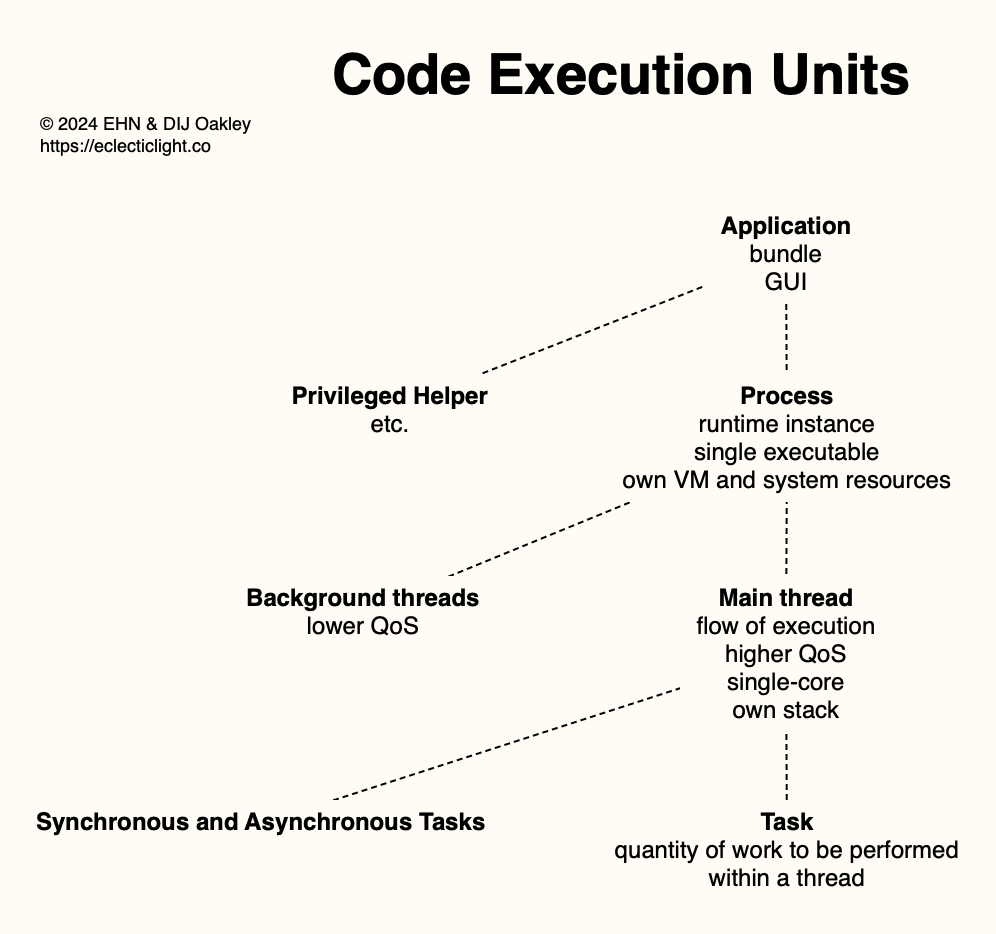
The end result is that the best you can expect from a Thunderbolt 3 SSD is a read/write speed of around 3 GB/s. Although that would be sufficient for many, Macs don’t come with arrays of half a dozen Thunderbolt 3 ports. If you need to connect external displays, the only practical solution might be to feed them through a Thunderbolt 4 dock or hub. As that’s fed by a single port on the Mac, its total capacity is still limited to 40 Gb/s, and that connection becomes the bottleneck.

Thunderbolt 5 isn’t a direct descendant of Thunderbolt 3 or 4, but is aligned with the second version of USB4. This might appear strange, but USB4 in its original version includes support for Thunderbolt 3. What most obviously changes with USB4 2.0 is its maximum transfer rate has doubled to 80 Gb/s. But even that’s not straightforward.

Architecture

thunderbolt5a

The basic architecture of a Thunderbolt 5 or USB4 2.0 connection is shown above. It consists of two lanes, each of which has two transmitter-receiver pairs operating in one direction at a time and each transferring data at up to 40 Gb/s. This provides a simultaneous total transfer rate of 80 Gb/s in each direction.

These lanes and transmitter-receiver pairs can be operated in several modes, including three for Thunderbolt 5 and USB4 2.0.

thunderbolt5b

Single-lane USB4 is the same as the original USB4 already supported by all Apple silicon Macs, and in OWC’s superb Express 1M2 USB4 enclosure, and in practice its full 40 Gb/s comfortably outperforms Thunderbolt 3 for data transfers.

thunderbolt5c

The first of the new high-speed Thunderbolt 5 and USB4 2.0 modes is known as Symmetric USB4, with both lanes bonded together to provide a total of 80 Gb/s in each direction. This is the mode that an external TB5 SSD operates in, to achieve claimed transfer rates of ‘up to’ 6 GB/s.

thunderbolt5d

The other new mode is Asymmetric USB4. To achieve this, one of the Lanes has one of its transmitter-receiver pairs reversed. This provides a total of 120 Gb/s in one direction, and 40 Gb/s in the other, and is referred to in Thunderbolt 5 as Bandwidth Boost. This can be used upstream, from the peripheral to the Mac host, or more commonly downstream, where it could provide sufficient bandwidth to support high-res displays, for example.

Direct host connections

In practice, these modes should work transparently and to your advantage when connecting a peripheral direct to your Mac. If it’s a display, then the connection can switch to Asymmetric USB4 with its three transmitters in the host Mac, to deliver 120 Gb/s to that display. If it’s for storage or another device moving data in both directions, then Symmetric USB4 is good for 80 Gb/s in each direction, and should deliver those promised 6 GB/s read/write speeds.

Docks and hubs

When it comes to docks and hubs, though, there’s the potential for disappointment. Connect three high-res displays to your dock, and you want them to benefit from Asymmetric USB4 coming downstream from the host Mac. If the dock correctly switches to that mode for its connections to the displays, then it won’t work properly (if at all) if the connection between the dock and host is Symmetric USB4, as that will act as an 80 Gb/s bottleneck for the dock’s downstream 120 Gb/s.

Using a Thunderbolt 5 dock or hub is thus a great enabler, as it takes just one port on your Mac to feed up to three demanding peripherals, but it requires careful coordination of modes, and even then could fall short of your expectations.

Consider a TB5 Mac with a dock connected to one large high-res display, and a TB5 SSD. If modes are coordinated correctly, the Mac and dock will connect using Asymmetric mode to deliver 120 Gb/s downstream to the dock, then Asymmetric again from the dock to the display. But that leaves the SSD with what’s left over from that downstream bandwidth, although it still has 40 Gb/s on the return from the SSD through the dock to the Mac. That TB5 drive is then likely to perform as if it was an old USB4 drive, with perhaps half its normal read/write speeds. Of course, that’s still better than you’d get from a TB4 dock, but not what you paid for.

There’s also the potential for bugs and errors. I wonder if reported problems in getting three 6K displays working through a TB5 hub might come down to a failure to connect from Mac to dock in Asymmetric mode. What if the Mac and dock agree to operate in Asymmetric mode when the sole connected display doesn’t require that bandwidth, thus preventing an SSD from achieving an acceptable read speed?

Who needs TB5?

There will always be those who work with huge amounts of data and need as much speed as they can get. But for many, the most important use for Thunderbolt 5 is in the connection between Mac and dock or hub, as that’s the bottleneck that limits everyday performance. MacBook Pro and Mac mini models that now support TB5 come with three Thunderbolt 5 ports and one HDMI display port. You don’t have to indulge in excess to fill those up: add just one Studio Display and external storage for backups, and that Mac is down to its last Thunderbolt port.

As a result, Thunderbolt docks and hubs have proved popular, despite their bottleneck connection to the Mac. For many, that will be where Thunderbolt 5 proves its worth, provided it can get its modes straight and deliver the better performance we’re paying for.

Last Week on My Mac: Tuning for performance

Perhaps the greatest subversion of EVs is their threat to car culture. Over more than a century, modifying and tinkering with internal combustion engines has become a popular obsession, and grown a huge industry devoted to tuning for performance. Replacing those lovingly crafted vehicles with battery-powered appliances seems too much to bear for all those enthusiasts.

Half the Mac articles posted here last week are about improving performance, whether in the CPU cores of the M4 or when connecting to external displays and storage. In comments we compared predictions, benchmarks and experience in our quest for improvement. Most telling, though, are those who report little improvement in the software they use to earn their livelihood, products that have been central to Macs for decades, such as Adobe Photoshop since 19 February 1990. If all that engineering effort has had so little effect, there’s something seriously amiss.

There’s much to be transferred from our experience of tuning vehicles to improving the performance of our apps. First is the appreciation that benchtests don’t necessarily translate into what happens on the road. Second is the need for objective measurements to assess performance relevant to our aims. Third is use of a systematic approach to improvement, in recognising where bottlenecks or constraints are, and addressing them methodically.

Benchtests

When each new Apple silicon chip becomes accessible, there’s a race to post its first Geekbench results and thereby demonstrate how performant it is. YouTube is now filling up with demonstrations of impressive or disappointing figures shown on the dials of Blackmagic speed tests on Thunderbolt 5 devices. It’s significant here that the Blackmagic test displays analogue meters taken from those on traditional car dashboards.

Few ever drill down and ask what those numbers returned by Geekbench mean, nor the relevance of disk speed tests to situations where transfer to or from storage limits app performance. Although Primate Labs provide details of the compendium of tests used to calculate Geekbench scores, it’s impossible to know how those might compare with code run by the apps we use. A Mac with impressive benchmark scores can still be dog-slow when running our daily tasks.

Blackmagic Disk Speed Test appears to report write and read speeds measured for a single file size of 5 GB, but tells you little about how storage might cope with large numbers of smaller files, or those much larger. As results vary between tests, it needs some method of providing the best estimate for a series of results, and a measure of the confidence in that number. As a quick, fun method of checking whether storage is up to the task of recording and playing back video files, it’s ideal, but it’s neither intended nor suitable for more general purposes.

Objective measurements

Subjective assessments are widely known for their power to mislead. If you ever want the thrill of your life, ride a recumbent trike at anything over 30 miles an hour down a steep and winding hill. Because your bum and eyes are so much closer to the road surface it feels like three times that speed in a car. You can see similar effects in non-linear progress bars. When they’re slow to start with and accelerate rapidly from midway on, they appear quicker than the reverse, with an apparently interminable wait for the last ten percent to complete.

My heart sinks when someone tells me that something is slow without being specific about what that something is, and providing numbers to support that impression. The only objective assessments are quantitative, in numbers rather than feelings.

But those numbers must also measure something meaningful. In the past we’ve tried simply timing how long a Mac takes to start up, or to launch an app, as if that’s what we spend all day waiting for. When you only launch an app once a day and restart your Mac every couple of weeks, who cares whether those take a few seconds more or less?

Ideally, you need to identify tasks that you have to wait for repeatedly, with discrete instants at the start and end that are separated by several seconds at least. Those can then be timed fairly accurately and reproducibly to form your own task-specific performance benchmark. Then when you come to the stage of testing out the effects of different settings and hardware, you can compare those times. This could become a bit more technical; when assessing the performance of the macOS Unified log, for instance, I’ve calculated the time in nanoseconds between log entries, but that level of precision is rarely needed.

Identification

Armed with comparisons of the time to perform relevant key tasks, we must then analyse what’s involved in each and determine which step is rate-limiting. Most tasks involve several stages, perhaps starting with reading of data from storage into memory, then processing that and displaying an outcome. Those in turn depend on effective read speed, memory capacity and access time, and a host of operations in CPU cores, GPU and possibly other units in the chip.

The key to understanding performance is Activity Monitor, in its different views. Developers also use Xcode’s valuable collection of Instruments, there are also Signposts widely used in the log, and if you really want to hone in on what’s happening in processor cores there’s always powermetrics. But well before you risk getting lost in those weeds, observations in Activity Monitor should provide a good picture of what’s going on, and where delays are occurring.

Activity Monitor does have its pitfalls, as with any other method of investigation. Perhaps its greatest shortcoming on Apple silicon Macs is in not displaying or taking into account frequencies of the two types of CPU core, but at least its CPU History window does show which type of core is bearing the brunt.

Goal

Behind all this is the need for a more critical approach when tuning our Macs for better performance. Fitting a new exhaust system to a car might make it sound good, but unless you go to the trouble of tuning it for performance, it might actually be slower on the road, all bark and no bite. Unlike Apple’s devices, our Macs haven’t become appliances, and in coming articles I’ll explore how you can tune yours.

Saturday Mac riddles 285

Here are this weekend’s Mac riddles to entertain you through family time, shopping and recreation.

1: This Scot with a volume was a notebook closed in 2019.

2: Ledger for baptismal water manages typefaces.

3: Root -1 with bound paper as a companion to the iMac with a handle.

To help you cross-check your solutions, or confuse you further, there’s a common factor between them.

I’ll post my solutions first thing on Monday morning.

Please don’t post your solutions as comments here: it spoils it for others.

A brief history of Mac servers

Although there’s little evidence of them today, Apple made a long succession of Mac servers and servers for Macs from 1988 to 2014, and only discontinued support for the last release of macOS Server in April 2022. Its first entry into the market was a special version of the Macintosh II running Apple’s own port of Unix way back in 1988.

A/UX

Apple itself used Sun servers internally, but with the advent of the Macintosh II in 1987, some of its engineers realised they at last had their own hardware platform capable of running Unix. The result was A/UX, the first of Apple’s server products and an abbreviation for Apple UNIX.

Although the idea to port Unix to the Mac II came from within Apple, at least part of the work was carried out under contract by UniSoft, a specialist Unix porting house who also ported Unix to Motorola’s 68030 and 88100 RISC processors. It was announced in February 1988, and version 1.0 was based on AT&T Unix System V.2.2 with many extensions to support streams, networking, the Fast File System (FFS), and more. It was fully compliant with POSIX and met US Government contract-bidding requirements.

Strategically it seemed important at the time, as without such an operating system, Apple wouldn’t have been able to bid for contracts to supply Macs to US Federal Government and its many funded organisation. On the strength of this, Apple formed a new business division to sell enterprise systems into large businesses, US government, and higher education.

However, A/UX wasn’t the flagship product it should have become, because of a combination of hardware limitations and its vanilla Unix port. At the end of 1991, when System 7 had already been available for six months, Apple released A/UX 3.0, its last major revision and for most users its zenith. By that stage the outgoing high-end Mac was the IIfx, with a Motorola 68030 running at a breakneck 40 MHz and integral MMU, and the first of the new Quadra models with their 68040 CPUs were starting to appear.

Apple enthusiastically pre-announced version 4 to be released in 1993 or 1994. This was to be developed in conjunction with IBM, combining parts of its AIX implementation of Unix, and run on the new PowerPC processors developed by Apple, IBM and Motorola in their AIM Alliance, but those never happened.

Indirection

In 1993, Apple changed course with the release of its first dedicated server models, Workgroup Servers 60, 80, and 95. The latter was based on the Quadra 950 with five SCSI hard drives and a CD-ROM or tape storage, and still ran A/UX 3. Those were in turn replaced by more powerful versions over the following years, and in 1996 Apple went into partnership with IBM to sell the Network Server 500 and 700, a huge system running IBM’s AIX and with hot-swappable hard drives. But they only ever attracted a dedicated following from a tiny number of customers. Apple also released one of its most curious products, Macintosh Application Environment (MAE) to run System 7 apps on Sun hardware.

Apple retreated to tweaked versions of its higher-end Power Macs from 1997, licking its wounds and pondering its next move. The 1999 Mac Server G3 Blue and White, based on the lookalike Power Mac, became the first Mac to run Mac OS X Server 1.0, released six months before the public beta of regular Mac OS X 10.0.

Xserve

Apple found new direction in 2002, with the first of its Xserve systems, running Mac OS X Server 10.1.5. These are distinctive 1U rack-mounted units resembling pizza boxes, initially coming with four front-mounted drive bays, and were over-engineered in some respects, and lacking in others. Bundled with them was an unlimited-user edition of Mac OS X Server.

Again there was a dedicated following. From 2003, special cluster node versions were assembled into supercomputers, which briefly caught the headlines. In 2006, the first Intel-powered Xserves shipped with up to two Intel Woodcrest Xeon 5100 CPUs, and hopes were high for their success.

serveradmin

Mac OS X Server came with its own Server Admin app that wrapped many of the tricky tasks in a familiar GUI, making administration a joy.

macosserver02

Xserves not only ran Mac OS X Server, but had their own Server Monitor app, letting you check on their hardware status from anywhere in the world.

macosserver01

As a server operating system, Mac OS X Server made a big difference to many smaller businesses, who found they could run sophisticated setups without having to employ specialist staff. Although Apple had put a brave new interface on many of its services, key features like DNS were never finished to the standard of competing commercial products. Simple setups were incredibly simple, but as requirements grew more complex, they quickly became just as admin-heavy as traditional Unix servers.

Consumer server

Until July 2011, Mac OS X Server had been a separate product, a complete system installation in itself. Apple then dropped the Xserve, and transformed OS X Server 10.7 by slashing its price to 10% of the previous version, and wrapping it all up in a neat app aimed at small business. For a decade, Server Admin had been the key application for administrators. Although accessible, Apple deemed it too complex for these new consumers.

server2

Lion Server had been something of an unfinished hybrid. It had three different interfaces in the traditional Server Admin app, Terminal’s command line for wizards, and its new and simplified Server.app, left incomplete even in 10.7.4. As with the regular version of Mountain Lion, OS X Server 2.2, as Mountain Lion Server was officially called, continued the trend in Lion Server (OS X Server 1.0) and almost finished the job.

serverstarted

Server.app was designed to be concise but rich in function, and sported the same interface it had in Lion. Select in the left hand pane to manage users and groups, monitor your server, control its services, manage hardware, and control system, network and storage settings. Below that the Next Steps button provides access to help topics and useful suggestions.

The main pane on the right then contains the detailed information for the function selected on the left. From its menus you could launch ancillaries, including Directory Utility to manage Directory Servers, Screen Sharing for remote management, System Image Utility to create and manage NetBoot/NetInstall/NetRestore images, and Xsan Admin if you still had an Xsan. All bar the last of these were accessible separately in the /System/Library/CoreServices folder, as their survivors remain today.

congratulations

At the end of its installation, OS X Server 2.2 even congratulated you.

Among these new features for consumers came the only one to be brought into mainstream macOS, the Content Caching Server, now just another of the Sharing services.

Server hardware consisted of lightly customised variants of other models, starting with the Mac mini of late 2009, and the Mac mini Server in mid 2010. Mac Pro Servers were offered from mid 2010 until they were discontinued in 2013. macOS Server lived on as version 5.0, released in September 2015, whose last update was in April 2022.

Apple stopped supplying servers a decade ago in 2014, but some of us are wondering whether it will try again with Apple silicon.

The Finder column width bug is over 11 years old

Among those things that never change in the Finder is a prominent bug that has affected its column view for at least the last 11 years, back to OS X Mavericks if not before. During beta-testing macOS Sequoia last summer, I thought for a while that Apple had fixed it, but when I looked for the bug in the release version of macOS 15.0 it hadn’t even gone into hiding, and it’s still there today in 15.1.1.

I must have written about it here for the first time back in 2015, and for a while checking for it became an annual event, but over the last few years there seemed little point in whingeing about it any more. No one seemed bothered that the Finder couldn’t handle its column views properly, as Apple silicon Macs are so much more exciting. Every so often it comes back to bite me, and I’m reminded how annoying it is, so please bear with my catharsis.

Like many of the most persistent and annoying bugs, the Finder column width bug might seem tricky to reproduce, but when you normally work in column views it will return to haunt you.

It’s straightforward to demonstrate. Open a new window in the Finder, and ensure it’s set to Column View. Select your Documents folder in the sidebar, then select another folder containing more files and folders in the first column, within Documents. It helps if some of those have long names, so they’re truncated using an ellipsis … in the name.

findercolbug01

Now click on your Applications folder in the sidebar to switch to that. Select an app, ideally one with a long name that has also been truncated with an ellipsis.

findercolbug02

Then click on the Back button to switch back to your previous view of the folder within Documents. More often than not, you’ll now see the second column fill the remaining width of the window, and browsing any deeper into those folders is almost impossible, as the column width settings have gone haywire.

findercolbug03

findercolbug04

The simple way to recover is to select a different folder in the first column, which should restore orderly column widths.

While this might appear to be obscure, and unlikely to trouble anyone in normal use, there’s one situation that causes it to occur frequently, when you like to park your Finder windows in column view, with two columns shown in the view, as in the first screenshot above. Because of this I have changed my behaviour over the last few years, and now leave Finder windows with just the first column filled, a solution I worked out over four years ago. But any lapse in concentration allowing me to park a window in the wrong configuration makes it likely the bug will return and bite back.

Over those 11 years, governments have come and gone, my grandchildren have grown up and one is now at university, we survived Covid, lost QuickTime and 32-bit code, and now use Apple silicon Macs. But one thing has remained unchanged through all of that, the Finder column width bug.

columnwidth

Inside M4 chips: CPU core management

Whether you’re a developer or user, gaining an understanding of how macOS manages the cores in an Apple silicon CPU is important. It explains what you will see in action when you open Activity Monitor, how your apps get to deliver optimal performance, and why you can’t speed up background tasks like Time Machine backups. In this series (links below) I’ve been trying to piece this together for the M4 family, and this article is my first attempt to summarise as much of the story as I know so far. I therefore welcome your comments, counter-arguments and improvements.

Scope

For the purposes of this article, I’ll consider a single thread that macOS is ready to load onto a CPU core for execution. For that to happen, five decisions are to be made:

  • which type of core, P or E,
  • which cluster to run it in,
  • which core within that cluster,
  • what frequency to run that cluster at,
  • the mobility of that thread between cores in the same cluster, and between clusters (when available).

Which type of core?

Since the early days of analysing M1 CPUs, it has been clear that the choice between P and E core types is made on the Quality of Service (QoS) assigned to the thread, availability of a core of that type, and whether the thread uses a co-processor such as the AMX. For the sake of generality and simplicity, I’ll here ignore the last of those, and consider only threads that are executed by the CPU alone.

QoS is primarily set by the process owning that thread, in the setting exposed to the programmer and user, although internally QoS is modulated by other factors including thermal environment. Threads assigned a QoS of 9 or less, designated Background, are allocated exclusively to E cores, while those with higher QoS of ‘user’ levels are preferentially allocated to P cores. When those are unavailable, they may be allocated to E cores instead.

This can be changed on the fly, reassigning higher QoS threads to run on E cores, but that’s not currently possible the other way around, so low QoS threads can’t be run on P cores. The sole exception to that is when run inside a virtual machine, when VM virtual cores are given high QoS, allowing low QoS threads within the VM to benefit from the speed of P cores.

Which cluster?

M4 Pro and Max variants have two clusters of P cores, so the next decision is which of those to run a higher QoS thread on:

  • if both clusters are shut down, one will be chosen and its frequency brought up;
  • if one cluster is already running and has sufficient idle residency (‘available residency’) to accommodate the thread, that will be chosen;
  • if one cluster already has full active residency, the other cluster will be chosen;
  • if both clusters already have full active residency, then the thread will be allocated to the E cluster instead.

This fills an active P cluster before allocating threads to the inactive one, and fills both P clusters before allocating a higher QoS thread to the E cluster.

m4coremanagement1

Cluster allocation is of course simpler on the base M4, where there’s only one E and one P cluster. Should Apple make an M4 Ultra as expected, then that would not only have four P clusters, but two E clusters. Until that happens, we can only speculate that similar would then apply, including the E clusters.

Which core within the cluster?

This is perhaps the simplest decision to make. If there’s only one core with available residency in that cluster, that’s the only choice. Otherwise macOS picks an arbitrary core from those available, apparently to ensure roughly even use of cores within each cluster.

What frequency?

For the E cluster, choice of frequency appears straightforward, with low QoS threads being run at minimum E core frequency of 1,020 MHz or slightly higher, and higher QoS threads spilt over from fully occupied P clusters are run at E core maximum frequency of 2,592 MHz.

P cluster frequency appears to be determined by the total active residency of that cluster after the new thread has been added. When that’s the only thread running in that cluster, maximum frequency of 4,512 MHz is chosen, but rising total active residency reduces that in steps down to about 3,852 MHz when all the cores in the cluster are at 100% active residency. In most cases, the big reduction in frequency occurs when going from about 200% to 300% total active residency. This currently appears to be part of a strategy to pre-emptively minimise the risk of thermal stress within the chip.

m4coremanagement2

Thread mobility

Once the thread has been loaded into a core in the optimal cluster running at the chosen frequency, it’s likely to be moved periodically, both to any other free core within that cluster, and to another cluster, when available. While this does occur in previous M-series CPUs, it appears particularly prominent in M4 variants.

Movement of threads within a cluster can occur quite frequently, every 0.1 second or so, particularly within the E cluster. Movement between clusters occurs less frequently, about every 4-5 seconds, and would only occur when the other cluster is shut down or idle, so free to run all the threads of the current cluster. This is most probably to ensure even thermal conditions within the chip.

Summary

The whole strategy is shown in the following diagram, also available as a tear-out PDF from here: m4coremanagement1

m4coremanagement3

Previous articles

Inside M4 chips: P cores
Inside M4 chips: P cores hosting a VM
Inside M4 chips: E and P cores
Inside M4 chips: CPU core performance
Inside M4 chips: CPU power, energy and mystery
Inside M4 chips: Matrix processing and Power Modes
Inside M4 chips: Controlling frequency

Explainer

Residency is the percentage of time a core is in a specific state. Idle residency is thus the percentage of time that core is idle and not processing instructions. Active residency is the percentage of time it isn’t idle, but is actively processing instructions. Down residency is the percentage of time the core is shut down. All these are independent of the core’s frequency or clock speed.

How is Thunderbolt 5 doing so far?

When Apple launched its first M4 Macs just over a month ago, I was surprised that models with M4 Pro or Max chips offered Thunderbolt 5. Although there are still relatively few computers in use with support for TB5, and a dearth of peripherals, this article summarises early experience with this exotic new bus.

What TB5 peripherals are available?

As far as I’m aware, as of today there’s only one Thunderbolt 5 peripheral shipping in quantity, the Kensington SD5000T5 Thunderbolt 5 Triple Docking Station, with a total of three downstream TB5 ports. I’m just completing a full review of this, due to appear in MacFormat and MacLife magazines early next year.

SSDs have been announced by OWC in its Envoy Ultra, and Sabrent. The first of OWC’s have apparently started to ship, although they aren’t expected to become readily available until the New Year, when Sabrent’s are also expected.

OWC has also announced a TB5 hub, but that’s unlikely to appear until next year.

Several PCs are now available with TB5 support, although that seems to be fiddly to configure in Windows. Among those is the Razer Blade 18, which is even more expensive than a MacBook Pro with an M4 Max.

Other than those, there are lots of expensive TB5 cables, just precious little to connect to the other end.

Multiple displays

Many of those rushing to buy into TB5 are doing so because of its promised support for multiple displays. For example, the Kensington dock claims to support up to three 6K displays at 60 Hz with the M4 Max, and two with the M4 Pro. Although I have been unable to test those combinations, there are already reports that the M4 Max works well with three displays connected direct, but only two of those work when using the Kensington dock.

This has apparently taken Kensington and Apple by surprise, but until this has been addressed, I wouldn’t assume that you’ll be able to use all three displays attached to the dock.

Multiple SSDs

In early 2023, when TB4 hubs were becoming available, I wrote a whole series of articles here analysing their performance with a range of different SSDs. Links to those are given at the end. Those predated OWC’s superb Express 1M2 USB4 enclosure that now offers consistent and reliable performance for Apple silicon Macs, but not Intel models, which unfortunately lack support for USB4.

I have recently been revisiting SSD performance, both directly connected to my Mac mini M4 Pro, and working through the Kensington dock. Although some results are impressive, there are others that shock.

sysinfotb5

As shown in System Information, this dock connects to the host at 80 Gb/s, and to each USB4 drive at the expected 40 Gb/s.

On the bright side, 1M2 enclosures that return direct read/write speeds of 3.7/3.7 GB/s read almost as fast when attached through the dock, but their write speed drops to 2.3 GB/s, similar to many TB3 SSDs attached directly. You can even connect a USB4 drive to each of the dock’s three TB5 ports to benchmark them simultaneously, and get read/write results of 2.1/2.1 GB/s on each of them. That performance represents the maximum total data transfer capacity, matching claims of 6 GB/s made of TB5 SSDs, and equating to 80 Gb/s in TB5/USB4v2 symmetric mode.

tb5tests

Results from TB3 SSDs are more worrying. An award-winning certified Thunderbolt 3 SSD that achieves 2.9/2.2 GB/s read/write attached direct maintained a good read speed through the dock at 2.8 GB/s, but it almost ground to a halt during the write test, at 422 MB/s, that’s roughly the speed you’d expect from a basic SATA SSD.

You can read similar experiences during early testing of this dock for PC World.

For the time being, TB5 performs well with USB4 and directly connected TB3 SSDs, and the dock is a good solution for those wanting high-speed access to two or three USB4 SSDs in OWC Express 1M2 enclosures. The dock does have serious problems when writing to TB3 SSDs, though, where it may fall far short of expectations. Hopefully these problems will be resolved early next year.

Recommendations

  • Although TB5 promises much, initial tests show that it currently has problems meeting that.
  • Reports indicate that it may not yet support M4 Max chips driving three 6K displays at 60 Hz from a TB5 dock.
  • Performance claimed for TB5 SSDs has not yet been confirmed in independent tests.
  • Performance of TB3 SSDs attached to a TB5 dock demonstrates some very poor write speeds.
  • Performance of USB4 SSDs attached to a TB5 dock demonstrates better and more consistent results, although their write speed also falls.
  • TB5 cables and peripherals are expensive.
  • Thunderbolt 5 is still at an experimental stage, and may take some time before it realises its potential.

Thunderbolt performance and TB4 hubs

General hub performance
Write speed throttling
How faster SSDs can impair performance of slower ones
Three SSDs on one hub
Getting best performance from Thunderbolt on Apple silicon Macs: a practical guide

Testing with Stibium

When using the ‘gold standard’ method of testing storage using my free Stibium, you don’t normally need to restart the Mac between write and read speed measurements. This has changed with the Mac mini M4 Pro, at least. If you go straight on to measure read speeds, results will be bogus because of what appears to be extensive caching of the files written during the previous write test. That results in absurdly high read speeds of more than 6 GB/s in most cases. This is surprising, as a total of just over 53 GB of files are written during the full write test, which seems far more than macOS should ever cache successfully!

For these tests on external SSDs, I therefore quit Stibium after measuring write speed, unmount the volume tested, remount it in Disk Utility, and open Stibium again to perform the read tests. This apparently clears caches reliably, and read speeds are consistent and in accord with those expected.

Interests

I bought my own Mac mini M4 Pro, Kensington SD5000T5 Thunderbolt 5 Triple Docking Station, and all the OWC Express 1M2 enclosures and their SSDs, at their regular retail prices. The only product tested here that has been provided by a manufacturer is, rather sadly, the TB3 SSD.

❌