Reading view

There are new articles available, click to refresh the page.

Inside M4 chips: CPU power, energy and mystery

Few comparisons or benchmarks for M-series chips take into account the reason for equipping Apple silicon chips with more than one CPU core type, according to Arm’s big.LITTLE architecture. Measuring single- or multi-core performance ignores the purpose of E cores, and estimating overall power use can’t compare those core types. This article tries to estimate the cost in terms of power and energy of running identical tests on M4 P and E cores, and thereby provide insight into some of the most distinctive features of Apple silicon, and their benefits.

Methods

To run these two in-core performance tests I use a GUI app wrapped around a series of loading tests designed to enable the CPU core to execute that code as fast as possible, and with as few extraneous influences as possible. Both tests used here are written in assembly code, and aren’t intended to be purposeful in any way, nor to represent anything that real-world code might run. Those are:

  • 64-bit floating point arithmetic, including an FMADD instruction to multiply and add, and FSUB, FDIV and FADD for subtraction, division and addition;
  • 32-bit 4-lane dot-product vector arithmetic (NEON), including FMUL, two FADDP and a FADD instruction;

Source code of the loops is given in the Appendix.

The GUI app sets the number of loops to be performed, and the number of threads to be run. Each set of loops is then put into the same Grand Central Dispatch queue for execution, at a Quality of Service of the maximum of 33. That ensures they are run preferentially on P cores, but will spill over to E cores when no P core is available, when more than 10 threads are run concurrently. Timing of thread execution is performed using Mach Absolute Time, and the time for each thread to be executed is displayed at the end of the tests.

For these tests, the total number of loops to be executed in each thread was set at 5 x 10^8 for floating point, and 3.5 x 10^9 for NEON. Those values were chosen to take 2-3 seconds per thread, to ensure the whole test period was available for analysis.

Immediately before running each test, I launch powermetrics from the command line, to gather core power and performance data in sampling periods of 0.1 second for a total of 50 samples. Its output is piped into a text file, which is then analysed using Numbers and DataGraph. All tests were conducted on a Mac mini M4 Pro with 10 P and 4 E cores, running macOS 15.1.1 in standard power mode.

Each test was inspected individually, and seen to contain the following phases:

  1. small initial activity resulting from bringing the GUI app into focus, and clicking the Run button;
  2. a brief period of low activity, typically with total CPU power at below 50 mW;
  3. 1-2 sample periods when threads are loaded onto the cores;
  4. 15-21 sample periods when threads are run, whose total CPU power measurements are collected for analysis;
  5. 1-2 sample periods when threads are unloaded;
  6. a return to low activity, typically with total CPU power returning below 50 mW.

Means and standard deviations were then calculated for each series of power measurements, and pooled with times taken to execute threads.

Power used by thread

The first pair of graphs shows average power use for the number of threads run, shown here with error bars giving the range of +1 standard deviation. These show two sections: for 1-10 threads, when all were running on P cores, and for 11-14 threads, when the 10 P cores were fully committed and 1-4 threads spilt over to run on E cores at their maximum frequency. Maximum power used during testing was just short of 34 W.

m4powerflopt1

That for the floating point test above, and NEON below, have regression lines fitted, indicating that:

  • Each additional floating point thread required 1,300 mW on P cores, and 110 mW on E cores.
  • Each additional NEON thread required 3,000 mW on P cores, and 280 mW on E cores.
  • P cores thus required 11-12 times the power of E cores, or E cores used 8-9% of the power of P cores.

m4powerneon1

Although linear regressions aren’t a bad fit, there’s consistent deviation from the linear relationship seen in previous analyses on M1 and M3 cores. More remarkably, the pattern of deviation is identical between these two tests, although they run in different units in these cores. In both cases, power use was high for 2 and 7 threads, while that for 3 and 8 threads was slightly lower. The only unusual pattern seen in powermetrics output was that, when running 2 and 7 threads, thread mobility was much higher than in other tests.

Previous tests on M1 and M3 P cores found that each additional floating point thread run on those requires about 935 mW, indicating a substantial increase in power used by M4 P cores when running at their higher maximum frequency. E cores in an M1 Pro require about 100 mW each when running at maximum frequency, similar to those in the M4.

Execution time

As power is the rate of energy use over time, the next step is to examine total execution time for all the threads running concurrently, which should form a linear relationship with different gradients for P and E cores. The next two graphs demonstrate that.

m4powerflopt2

For both floating point (above) and NEON (below), there’s a tight linear relationship between total execution time and numbers of threads. Floating point demonstrates that each thread costs 2.4 seconds on P cores and 3.6 seconds on E cores, making E core execution time 150% that of P cores. NEON is similar, at 2.5 seconds on P cores and 3.4 seconds on E cores, for a ratio of 136%.

m4powerneon2

Time taken for the slowest thread to complete execution shows interesting finer detail.

m4powerflopt3

For both tests, performance falls into several sections according to the number of threads run. With less than 5 threads run, there’s a sharp rise in time taken per thread. From 5-10 threads, time required remains constant, before increasing from 10-14 threads, when additional threads are spilt over onto E cores.

This has implications for anyone trying to measure core performance, as it demonstrates that a single thread can run disproportionately fast, compared with 3-10 threads. Basing any conclusion or comparison on a single thread completing in little more than 2 seconds, when 5 concurrent threads would take 2.34 seconds, 117% of the single thread, could be misleading.

m4powerneon3

Energy use

Although power use determines heat production, so is an important factor in determining cooling requirements, total energy required to execute threads is equally important for Macs running from battery. Simply reducing core frequency will reduce power used, but by extending the time taken to complete tasks, it may have no effect on energy used, and battery endurance. My final two graphs therefore show estimated total energy used when running test threads on P and E cores, the ultimate test of any big.LITTLE CPU design such as that in the M4.

m4powerflopt4

Graphs for floating point (above) and NEON (below) are inevitably similar in form to those for power, with a near-linear section from 1-10 cores, when the threads are run only on P cores, and from 11-14 cores when they also spill over to E cores.

Fitted regression lines provide the energy cost for each additional thread:

  • For floating point, each thread run on a P core costs 3.1 J, and for an E core 1.5 J, making the energy used by an E core 47% that of a P core.
  • For NEON, P cores cost 7.7 J per thread, and E cores 3.0 J, making the energy used by an E core 38% that of a P core.

It’s important to remember that the E cores here aren’t being run at frequencies for high efficiency, but at their maximum so they can substitute for the P cores that are already in use.

m4powerneon4

Considering the small deviations from those linear relationships, it appears that running 2, 6 or 7 threads on P cores requires slightly more energy than predicted from the regression lines shown.

Unfortunately, assessing the energy used by E cores running at low frequencies, as they normally do when performing background tasks, is fraught with inaccuracies due to their low power use. My previous estimate for floating point tests is that a slow-running E core uses less than 45 mW per thread, and for the same task requires about 7% of the energy used by a P core running at maximum frequency, but I have lower confidence in the accuracy of those figures than in those above for higher frequencies.

Key information

  • When running the same code at maximum frequency, E cores used 8-9% of the power of P cores.
  • Power use when running 2 or 7 threads was anomalously high, possibly due to high thread mobility.
  • Execution on E cores was significantly slower than on P cores, at 136-150% of the time required on P cores.
  • Single-core performance measurements may not be accurate reflections of performance on multiple cores.
  • When running the same code at maximum frequency, energy used by an E core is expected to be 38-47% that of a P core.

Previous articles

Inside M4 chips: P cores
Inside M4 chips: P cores hosting a VM
Inside M4 chips: E and P cores
Inside M4 chips: CPU core performance

Appendix: Source code

_fpfmadd:
STR LR, [SP, #-16]!
MOV X4, X0
ADD X4, X4, #1
FMOV D4, D0
FMOV D5, D1
FMOV D6, D2
LDR D7, INC_DOUBLE
fp_while_loop:
SUBS X4, X4, #1
B.EQ fp_while_done
FMADD D0, D4, D5, D6
FSUB D0, D0, D6
FDIV D4, D0, D5
FADD D4, D4, D7
B fp_while_loop
fp_while_done:
FMOV D0, D4
LDR LR, [SP], #16
RET

_neondotprod:
STR LR, [SP, #-16]!
LDP Q2, Q3, [X0]
FADD V4.4S, V2.4S, V2.4S
MOV X4, X1
ADD X4, X4, #1
dp_while_loop:
SUBS X4, X4, #1
B.EQ dp_while_done
FMUL V1.4S, V2.4S, V3.4S
FADDP V0.4S, V1.4S, V1.4S
FADDP V0.4S, V0.4S, V0.4S
FADD V2.4S, V2.4S, V4.4S
B dp_while_loop
dp_while_done:
FMOV S0, S2
LDR LR, [SP], #16
RET

A brief history of Mac CPUs

Macs have used four different architectures for their Central Processing Units over the last 40 years. From their launch by Steve Jobs on 24 January 1984, for the first decade they used Motorola 68K CPUs, then switched to PowerPCs designed by an alliance of Apple, IBM and Motorola, which were used for 12 years. After 14 years being built around Intel processors from 2006, Macs most recently changed a third time to use Apple’s own Arm-based chips.

Over those 40 years, continuous improvements in capabilities and performance of CPUs have transformed Mac OS and the apps it supports.

Motorola 68K

CPUs execute instructions in synchrony with a clock whose frequency determines the rate of instruction execution. The Motorola 68000 processor in the original Mac 128K ambled along at a clock speed of just 8 MHz. The last 68K models featuring 68040 CPUs had raised that to 33 MHz, and added specialist Memory Management Units (MMUs) and floating point units. The latter first appeared as 68881 and 68882 maths co-processors, but were later integrated into the 68040.

MMUs were particularly important for the implementation of virtual memory. When the Macintosh II was introduced in 1987, it was the first Mac that could be fitted with Motorola’s optional 68851 paged MMU, required for it to run Apple’s A/UX port of Unix with virtual memory support. Strangely, Apple’s own MMU fitted in the standard Mac II didn’t support virtual memory. Its 68020 CPU was also the first in Macs to use 32 bits rather than the 16 of the original 68000.

AIM PowerPC

When introduced in 1994, the first Power Macs came with PowerPC 601 or 601+ CPUs running at frequencies up to 110 MHz, nearly 14 times faster than the original Mac 128K. Just over a decade later, the last Power Mac G5 raised that to dual two-core CPUs at 2,500 MHz, more than 20 times the clock frequency, and the previous model had offered dual 2,700 MHz CPUs.

PowerPCs had their origins in IBM’s high-end POWER architecture based on a reduced instruction set (RISC) intended to be run at higher frequencies. Initially, these CPUs used a 32-bit design, but progressed to 64 bits. Not only do they have integrated floating point units that were extended for Apple, but later models include AltiVec vector processing for single-precision floating point and integer operations.

High CPU frequencies bring higher power consumption and heat output. A dual-core G5 with a PowerPC 970MP CPU used a maximum of 100 W at 2,000 MHz, and some of the last G5 Macs used liquid cooling to cope with the heat generated at higher frequencies. Those didn’t prove long-lived, with coolant leaks a common and fatal failing.

Intel x86

In early 2006 Apple started releasing its new range of Macs using Intel CPUs. With the exception of a base model of Mac mini, those came with 2-core Core Duo processors running at up to 2 GHz, and were soon followed by the first Mac Pros featuring two 64-bit 2-core Xeon 5100 CPUs (Woodcrest) at up to 3 GHz. By the following year, the first 8-core Mac Pro was available.

Earlier increases in CPU frequency gradually petered out. The last Intel Mac Pro was available with cores running at 2.5-3.5 GHz, boosted to a maximum of up to 4.4 GHz. Instead, high-end models offered as many as 28 cores and drew power up to 900 W. More typical of late desktop Macs were Intel Core i9 CPUs with 6-8 cores at similar frequencies. Adding more processor cores has been an effective way to run more code at the same time. Tasks are divided into threads that can run relatively independently of one another. Those threads can then be distributed across several CPU cores.

Rising power consumption and heat output were becoming even more of a problem in MacBook Pro models.

Apple Arm

Well before Apple had joined IBM and Motorola in the AIM alliance, it had co-founded the company based in Cambridge, England, that was to become ARM (for Acorn RISC Machines). Its RISC processor was used in Apple’s Newton MessagePad of 1993, and in 2010 Apple released its first iPhone and iPad designed around a single-core 32-bit Arm CPU running at a cool and economical 1 GHz.

From before macOS Mojave in 2018, Apple was preparing for its next migration, to its own integrated Systems on a Chip (SoC), starting with the M1 in 2020. The first iPhone to incorporate two CPU core types was the iPhone 7 of 2016, in its A10 Fusion SoC. Rather than simply adding more cores, Apple had adopted the Arm big.LITTLE architecture, in which background threads are run on slower, more efficient CPU cores, and higher priority user processes run on faster, more performant cores.

The first two families of M1 and M2 chips have cores grouped in clusters of no more than 4, but Apple increased cluster size to 6 in the M3 and M4. While the M1 family consists of two designs, one for the base variant, and the second for both Pro and Max, and doubled in the Ultra, M3 and M4 families have distinct designs for their Pro and Max variants. For the M4, this offers a full range from 8 to 16 cores in total, with an anticipated Ultra extending to 32. In addition to CPU cores with built-in vector processing (NEON), these chips incorporate specialist co-processors such as a neural engine and a proprietary matrix co-processor, AMX.

Performance (‘big’) cores have increased in maximum frequency, from 3.2 GHz in the M1 to 4.5 GHz in the M4 four years later.

Trends

The period 1984-2007 was dominated by increasing CPU frequency, as demonstrated in the two charts below.

maccpuhistoryfreqlin

This chart uses a conventional linear Y axis to demonstrate that frequency rose rapidly during the decade from 1997. As the form of this curve is S-shaped, the chart below shows the same data with a logarithmic Y axis.

maccpuhistoryfreqexp

Since about 2007, Macs haven’t seen substantial frequency increases. Many factors limit the maximum frequency that a processor can run at, including its physical dimensions, but among the most significant in practical terms are its power requirements and heat output, hence its need for cooling. Thus, the period 2005-2017 became dominated by increasing core count.

maccpuhistorycores

This chart shows how the number of processors and cores inside Macs didn’t start rising until around 2005, just as frequencies were topping out. Thus, many of the CPU performance improvements from 2007 onwards have been the result of providing more cores. But there’s a practical limit as to how many of those cores will get used, which is where processing more data becomes important, as it has from 1998 onwards.

It’s remarkable how much of Mac OS has survived if not flourished over those 40 years that our Macs have gone from a pedestrian Motorola 68000 processor to the 12 performance cores capable of 4.5 GHz in an M4 Max chip.

Arm 年度技术大会收官,下一代 AI 计算平台在路上了

今天下午,一年一度的 Arm Tech Symposia 年度技术大会在深圳圆满结束。

Arm 在本次大会上深入探讨了 AI 对计算的需求,并分享了如何通过硬件、软件、生态系统三大核心更好地把握 AI 的发展机遇,在场与会者也共同探讨了基于 Arm 的技术创新和 AI 发展趋势。

Arm 终端事业部产品管理副总裁 James McNiven 在深圳场的大会主题演讲中强调,Armv9 作为 Arm 最新的技术架构,推出伊始便是为支撑 AI 计算而设计,并持续迭代更新,通过 SVE、SVE2、SME 等关键技术,Arm 以架构创新和强大的软硬件协同能力不断优化移动端 AI 体验,赋能开发者实现卓越的 AI 性能。

在本次大会中,KleidiAI 软件是值得关注的亮点之一。

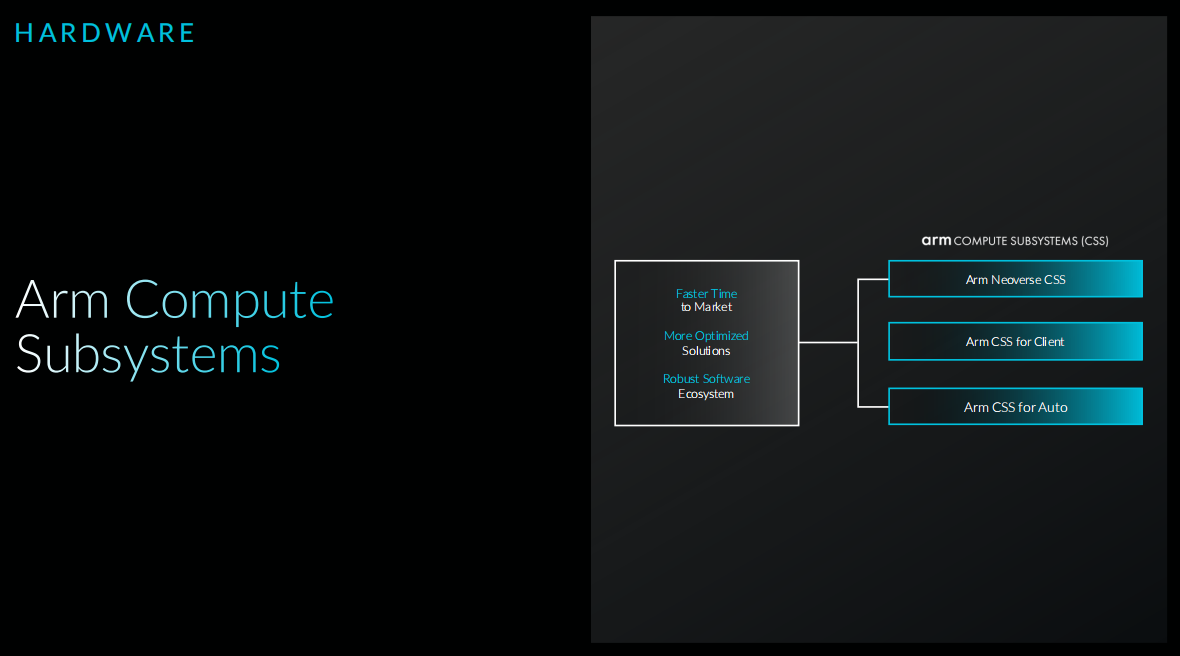
它实现了与主流 AI 框架的深度集成,能够为开发者提供丝滑的开发体验;当与 Arm CSS 搭配使用时,KleidiAI 通过整合 Neon™、SVE2 和 SME2 等一系列 Arm 加速技术,从而显著提升计算应用的性能表现。

据悉,KleidiAI 是一套专门面向 AI 框架开发者的高性能计算内核。

它能够帮助开发者在各种设备上轻松发挥 Arm CPU 上的最佳性能,并充分利用 Neon、SVE2 和 SME2 等关键 Arm 架构的核心特性。

此外,KleidiAI 还集成了 PyTorch、Tensorflow、MediaPipe 等热门 AI 框架,对 Meta Llama 3、Phi-3 等模型进行了性能优化,并且还采用了可前后兼容的设计。

这样做的好处是,确保 Arm 未来在引入更多技术时依然能适用未来市场的需求。

据介绍,KleidiAI 的集成显著提升了生成式 AI 的工作效率。

数据显示,与参考实现方案(基于 llama.cpp,但不含 Kleidi 软件优化)相比,在新的 Arm Cortex-X925 CPU 上,使用(集成了 KleidiAI 的)llama.cpp 的 Meta Llama 3 和微软 Phi-3 大语言模型 (LLM) 的词元 (Token) 首次响应时间加快了 190%。

KleidiAI 的另一大优势在于易于集成。

据悉,Arm 的工程团队只用不到 24 小时就完成了 Llama 3 的性能优化测试。

此外,KleidiAI 还通过 XNNPACK 与 MediaPipe 集成,为在移动设备上运行的开源 Gemma LLM 提供支持。得益于此,Google Pixel 8 Pro 智能手机上 Gemma 2B 的词元首次响应时间缩短了 25%。

与此同时,Arm 还与 Unity 合作开发端侧 AI 推理引擎——Sentis,可让游戏开发者在所有支持 Unity 游戏引擎的设备上打造全新的 AI 游戏体验。

另外,作为迄今速度最快的 Arm 计算平台,Arm 终端 CSS 在计算和图形性能方面实现了超过 30% 的提升,足以应对各类严苛的 Android 工作负载。

与此同时,Arm 终端 CSS 也提高了 59% 的 AI 推理速度,适用于更广泛的 AI/机器学习 (ML) 和计算视觉工作负载。

Arm 终端 CSS 的核心优势在于其搭载了 Arm 迄今性能最强、效率最高、功能最全面的 CPU 集群,致力于实现性能与能效的最佳平衡。

而凭借新一代 Arm Cortex®-X CPU,AI 优化的 Arm 终端 CSS 带来最高的 IPC 同比提升,性能提高 36%;新的 Arm Immortalis™ GPU 的图形性能提高 37%。

Arm Immortalis-G925 GPU 是 Arm 性能最强、效率最高的 GPU,在多款手游应用中实现了 37% 的性能提升,并在多个 AI 和 ML 网络上提升了 34% 的性能。

Immortalis-G925 主要面向旗舰智能手机市场。

而包括 Arm Mali™-G725 和 Mali-G625 GPU 在内的全新高可扩展性 GPU 系列,则面向从高端手机到智能手表和 XR 可穿戴设备等广泛的消费电子设备市场。

Arm 预计到 2025 年底,全球将有超过 1000 亿台具备 AI 能力的 Arm 设备。

从传感器、智能手机,到工业物联网、汽车和数据中心,就像建造摩天大楼需要坚实的地基,AI 技术的蓬勃发展也离不开强大而高效的计算平台作为支撑。

凭借在芯片架构与技术创新上的不懈努力,Arm 正在为这座「AI 摩天大楼」打造最可靠的基石,也将在这场技术变革中扮演愈发关键的角色。

#欢迎关注爱范儿官方微信公众号:爱范儿(微信号:ifanr),更多精彩内容第一时间为您奉上。

爱范儿 | 原文链接 · 查看评论 · 新浪微博


Inside M4 chips: CPU core performance

There’s no doubt that the CPUs in M4 chips outperform their predecessors. General-purpose benchmarks such as Geekbench demonstrate impressive rises in both single- and multi-core results, in my experience from 3,191 (M3 Pro) to 3,892 (M4 Pro), and 15,607 (M3 Pro) to 22,706 (M4 Pro). But the latter owes much to the increase in Performance (P) core count from 6 to 10. In this series I concentrate on much narrower concepts of performance in CPU cores, to provide deeper insight into topics such as core types and energy efficiency. This article examines the in-core performance of P and E cores, and how they differ.

P core frequencies have increased substantially since the M1. If we set that as 100%, M3 P cores run at around 112-126% of that frequency, and those in the M4 at 140%.

E cores are more complex, as they have at least two commonly used frequencies, that when running low Quality of Service (QoS) threads, and that when running high QoS threads that have spilt over from P cores. Low QoS threads are run at 77% of M1 frequency when on an M3, and 105% on an M4. High QoS threads are normally run at higher frequencies of 133% on the M3 E cores (relative to the M1 at 100%), but only 126% on the M4.

Methods

To measure in-core performance I use a GUI app wrapped around a series of loading tests designed to enable the CPU core to execute that code as fast as possible, and with as few extraneous influences as possible. Of the seven tests reported here, three are written in assembly code, and the others call optimised functions in Apple’s Accelerate library from a minimal Swift wrapper. These tests aren’t intended to be purposeful in any way, nor to represent anything that real-world code might run, but simply provide the core with the opportunity to demonstrate how fast it can be run at a given frequency.

The seven tests used here are:

  • 64-bit integer arithmetic, including a MADD instruction to multiply and add, a SUBS to subtract, an SDIV to divide, and an ADD;
  • 64-bit floating point arithmetic, including an FMADD instruction to multiply and add, and FSUB, FDIV and FADD for subtraction, division and addition;
  • 32-bit 4-lane dot-product vector arithmetic (NEON), including FMUL, two FADDP and a FADD instruction;
  • simd_float4 calculation of the dot-product using simd_dot in the Accelerate library.
  • vDSP_mmul, a function from the vDSP sub-library in Accelerate, multiplies two 16 x 16 32-bit floating point matrices, which in M1 and M3 chips appears to use the AMX co-processor;
  • SparseMultiply, a function from Accelerate’s Sparse Solvers, multiplies a sparse and a dense matrix, that may use the AMX co-processor in M1 and M3 chips.
  • BNNSMatMul matrix multiplication of 32-bit floating-point numbers, here in the Accelerate library, and since deprecated.

Source code of the loops is given in the Appendix.

The GUI app sets the number of loops to be performed, and the number of threads to be run. Each set of loops is then put into the same Grand Central Dispatch queue for execution, at a set Quality of Service (QoS). Timing of thread execution is performed using Mach Absolute Time, and the time for each thread to be executed is displayed at the end of the tests.

I normally run tests at either the minimum QoS of 9, or the maximum of 33. The former are constrained by macOS to be run only on E cores, while the latter are run preferentially on P cores, but may spill over to E cores when no P core is available. All tests are run with a minimum of other activities on that Mac, although it’s not unusual to see small amounts of background activity on the E cores during test runs.

The number of loops completed per second is calculated for two thread totals for each of the three execution contexts. Those are:

  • P cores alone, based on threads run at high QoS on 1 and 10 P cores;
  • E cores at high frequency (‘fast’), run at high QoS on 10 cores (no threads on E cores) and 14 (4 threads on E cores);
  • E cores at low frequency (‘slow’), run at low QoS on 1 and 4 E cores.

Results are then corrected by removing overhead estimated as the rate of running empty loops. Finally, each test is expressed as a percentage of the performance achieved by the P cores in an M1 chip. Thus, a loop rate double that achieved by running the same test on an M1 P core is given as 200%.

P core performance

As in subsequent sections, these are shown in the bar chart below, in which the pale blue bars are for M1 P cores, dark blue bars for M3 P cores, and red for M4 P cores.

m134coreperf1

As I indicated in my preview of in-core performance, there is little difference between integer performance between M3 and M4 P cores, but a significant increase in floating point, which matches that expected by the increased frequency in the M4.

Vector performance in the NEON and simd dot tests, and matrix multiplication in vDSP mmul rise higher than would be expected by frequency differences alone, to over 160% of M1 performance. The latter two tests are executed using Accelerate library calls, so there’s no guarantee that they are executed the same on different chips, but the first of those is assembly code using NEON instructions. SparseMultiply and BNNS matmul are also Accelerate functions whose execution may differ, and don’t fare quite as well on the M4.

E core slow performance

m134coreperf2

On E cores, threads run at low QoS are universally at frequencies close to idle, as reflected in their performance, still relative to an M1 P core at much higher frequency. Frequency differences account for the relatively poor performance of M3 E cores, and improvement in results for the M4. Those are disproportionate in vector and matrix tests, which could be accounted for by the M4 E core running those at higher frequencies than would be normal for low QoS threads.

Although the best of these, NEON, is still well below M1 P core performance (73%), this suggests a design decision to deliver faster vector processing on M4 E cores, which is interesting.

E core fast performance

m134coreperf3

Ideally, when high QoS threads overspill from P cores, it’s preferable that they’re executed as fast as they would have been on a P core. Those in the M1 fall far short of that, in scalar and vector tests only delivering 40-60% of a P core, although that seemed impressive at the time. The M3 does considerably better, with vector and one matrix test slightly exceeding the M1 P core, and the M4 is even faster in vector calculations, peaking at over 130% for NEON assembly code.

Far from being a cut-down version of its P core, the M4 E core can now deliver impressive vector performance when run up to maximum frequency.

M4 P and E comparison

Having considered how P and E cores have improved against those in the M1, it’s important to look at the range of computing capacity they provide in the M4. This is shown in the chart below, where pale blue bars are P cores, red bars E cores at high QoS and frequency, and dark blue bars E cores at low QoS and frequency. Again, these are all shown relative to P core performance in the M1.

m134coreperf4

Apart from the integer test, scalar floating point, vector and matrix calculations on P cores range between 140-175% those of the M1, a significant increase on those expected from frequency increase alone. Scalar and vector (but not matrix) calculations on E cores at high frequency are slower, although in most situations that shouldn’t be too noticeable. Performance does drop off for E cores at low frequency, though, and would clearly have impact for code.

Given the range of operating frequencies, P and E cores in the M4 chip deliver a wide range of performance at different power levels, and its power that I’ll examine in the next article in this series.

Key information

  • M4 P core maximum frequency is 140% that of the M1. That increase in frequency accounts for much of the improved P core performance seen in M4 chips.
  • E core frequency changes are more complex, and some have reduced rather than risen compared with the M1.
  • P core floating point performance in the M4 has increased as would be expected by frequency change, and vector and matrix performance has increased more, to over 160% those of the M1.
  • E core performance at low QoS and frequency has improved in comparison to the M3, and most markedly in vector and matrix tests, suggesting design improvements in the latter.
  • E core performance at high QoS and frequency has also improved, again most prominently in vector tests.
  • Across their frequency ranges, M4 P and E cores now deliver a wide range of performance and power use.

Previous articles

Inside M4 chips: P cores
Inside M4 chips: P cores hosting a VM
Inside M4 chips: E and P cores

Appendix: Source code

_intmadd:
STR LR, [SP, #-16]!
MOV X4, X0
ADD X4, X4, #1
int_while_loop:
SUBS X4, X4, #1
B.EQ int_while_done
MADD X0, X1, X2, X3
SUBS X0, X0, X3
SDIV X1, X0, X2
ADD X1, X1, #1
B int_while_loop
int_while_done:
MOV X0, X1
LDR LR, [SP], #16
RET

_fpfmadd:
STR LR, [SP, #-16]!
MOV X4, X0
ADD X4, X4, #1
FMOV D4, D0
FMOV D5, D1
FMOV D6, D2
LDR D7, INC_DOUBLE
fp_while_loop:
SUBS X4, X4, #1
B.EQ fp_while_done
FMADD D0, D4, D5, D6
FSUB D0, D0, D6
FDIV D4, D0, D5
FADD D4, D4, D7
B fp_while_loop
fp_while_done:
FMOV D0, D4
LDR LR, [SP], #16
RET

_neondotprod:
STR LR, [SP, #-16]!
LDP Q2, Q3, [X0]
FADD V4.4S, V2.4S, V2.4S
MOV X4, X1
ADD X4, X4, #1
dp_while_loop:
SUBS X4, X4, #1
B.EQ dp_while_done
FMUL V1.4S, V2.4S, V3.4S
FADDP V0.4S, V1.4S, V1.4S
FADDP V0.4S, V0.4S, V0.4S
FADD V2.4S, V2.4S, V4.4S
B dp_while_loop
dp_while_done:
FMOV S0, S2
LDR LR, [SP], #16
RET

func runAccTest(theA: Float, theB: Float, theReps: Int) -> Float {
var tempA: Float = theA
var vA = simd_float4(theA, theA, theA, theA)
let vB = simd_float4(theB, theB, theB, theB)
let vC = vA + vA
for _ in 1...theReps {
tempA += simd_dot(vA, vB)
vA = vA + vC
}
return tempA
}

16 x 16 32-bit floating point matrix multiplication

var theCount: Float = 0.0
let A = [Float](repeating: 1.234, count: 256)
let IA: vDSP_Stride = 1
let B = [Float](repeating: 1.234, count: 256)
let IB: vDSP_Stride = 1
var C = [Float](repeating: 0.0, count: 256)
let IC: vDSP_Stride = 1
let M: vDSP_Length = 16
let N: vDSP_Length = 16
let P: vDSP_Length = 16
A.withUnsafeBufferPointer { Aptr in
B.withUnsafeBufferPointer { Bptr in
C.withUnsafeMutableBufferPointer { Cptr in
for _ in 1...theReps {
vDSP_mmul(Aptr.baseAddress!, IA, Bptr.baseAddress!, IB, Cptr.baseAddress!, IC, M, N, P)
theCount += 1
} } } }
return theCount

Apple describes vDSP_mmul() as performinng “an out-of-place multiplication of two matrices; single precision.” “This function multiplies an M-by-P matrix A by a P-by-N matrix B and stores the results in an M-by-N matrix C.”

Sparse matrix multiplication

var theCount: Float = 0.0
let rowCount = Int32(4)
let columnCount = Int32(4)
let blockCount = 4
let blockSize = UInt8(1)
let rowIndices: [Int32] = [0, 3, 0, 3]
let columnIndices: [Int32] = [0, 0, 3, 3]
let data: [Float] = [1.0, 4.0, 13.0, 16.0]
let A = SparseConvertFromCoordinate(rowCount, columnCount, blockCount, blockSize, SparseAttributes_t(), rowIndices, columnIndices, data)
defer { SparseCleanup(A) }
var xValues: [Float] = [10.0, -1.0, -1.0, 10.0, 100.0, -1.0, -1.0, 100.0]
let yValues = [Float](unsafeUninitializedCapacity: xValues.count) {
resultBuffer, count in
xValues.withUnsafeMutableBufferPointer { denseMatrixPtr in
let X = DenseMatrix_Float(rowCount: 4, columnCount: 2, columnStride: 4, attributes: SparseAttributes_t(), data: denseMatrixPtr.baseAddress!)
let Y = DenseMatrix_Float(rowCount: 4, columnCount: 2, columnStride: 4, attributes: SparseAttributes_t(), data: resultBuffer.baseAddress!)
for _ in 1...theReps {
SparseMultiply(A, X, Y)
theCount += 1
} }
count = xValues.count
}
return theCount

Apple describes SparseMultiply() as performing “the multiply operation Y = AX on a sparse matrix of single-precision, floating-point values.” “Use this function to multiply a sparse matrix by a dense matrix.”

Sparse matrix multiplication

var theCount: Float = 0.0
let inputAValues: [Float] = [ 1.0, 2.0, 3.0, 4.0, 5.0, 6.0, 7.0, 8.0,
1.0, 2.0, 3.0, 4.0, 5.0, 6.0, 7.0, 8.0,
1.0, 2.0, 3.0, 4.0, 5.0, 6.0, 7.0, 8.0 ]
let inputBValues: [Float] = [
1, 2,
3, 4,
1, 2,
3, 4,
1, 2,
3, 4]
var inputADescriptor = BNNSNDArrayDescriptor.allocate(
initializingFrom: inputAValues,
shape: .imageCHW(3, 4, 2))
var inputBDescriptor = BNNSNDArrayDescriptor.allocate(
initializingFrom: inputBValues,
shape: .tensor3DFirstMajor(3, 2, 2))
var outputDescriptor = BNNSNDArrayDescriptor.allocateUninitialized(
scalarType: Float.self,
shape: .imageCHW(inputADescriptor.shape.size.0,
inputADescriptor.shape.size.1,
inputBDescriptor.shape.size.1))
for _ in 1...theReps {
BNNSMatMul(false, false, 1,
&inputADescriptor, &inputBDescriptor, &outputDescriptor, nil, nil)
theCount += 1
}
inputADescriptor.deallocate()
inputBDescriptor.deallocate()
outputDescriptor.deallocate()
return theCount

Inside M4 chips: E and P cores

In the two previous articles (links at the end), I explored some of the features and properties of Performance (P) cores in Apple’s latest M4 chips. This article looks at their Efficiency (E) cores by comparison.

M4 family

In the three current M4 designs, there are only two variations in terms of E cores:

  • Base M4, with 6 E cores, except for a cheaper variant with only 4 active E cores.
  • M4 Pro and Max, with 4 E cores, including ‘binned’ variants.

Apple is expected to release an Ultra variant in 2025, with two M4 Max chips in tandem, providing a total of 8 E cores. Apart from the number of cores, all E cores are the same, and different from P cores.

E core architecture

All E cores are arranged in a single cluster of 4 or 6, sharing common L2 cache, and running at the same frequency (clock speed). Analysis of M1 cores implies that each E core has roughly half the number of processing units, where there is more than one such unit in the P core, giving an M1 E core roughly half the compute capacity of the P core. I haven’t seen any comparable analysis of cores in later M families, although differences in power consumption imply there remain substantial differences in processing units and compute capacity.

Frequency

Like P cores, E cores can be set to run at any of 5 values between the minimum of 1,020 MHz and maximum of 2,592 MHz (1.0-2.6 GHz). When running macOS, cluster frequency is set by macOS at a kernel level; other operating systems may offer more direct control. This range of frequencies is significantly narrower than that of E cores in the M3, which range between 744-2,748 MHz.

E cores idle at 1,020 MHz, and although they can be shut down altogether, that’s exceptional given the steady demand for macOS background threads to be run on them. Nevertheless, powermetrics still reports their ‘down’ residencies separately from idle residencies.

Instruction set

This is believed to be identical to ARMv9.2-A without Scalable Vector Extension (SVE) supported by M4 P cores, enabling the same threads to be run on either core type.

Single thread comparisons

One way to appreciate the contrasts between core types is to compare a single intensive in-core thread run in each. For this purpose, I used a tight loop of floating point calculations, running at two different Quality of Service (QoS) settings, in macOS 15.1.

Single thread at high QoS on P cores

m4singlePflopt1

This thread was initially loaded onto P13 (red) in the second (P1) cluster, and after 3.7 seconds was moved to P5 (blue) in the first (P0) cluster. After a further 4.6 seconds running on that, it was moved back to the second (P1) cluster, to run on P11 (purple). During this run, there was almost no other activity on the two P clusters, and the inactive cluster was therefore shut down while this thread was running on the other.

m4singlePflopt2

The active cluster was run at the maximum frequency of 4,511 MHz throughout. Just before the thread was moved to a different cluster, that was brought up and run up to maximum frequency ready to run the thread.

m4singlePflopt3

Total CPU power remained similar throughout the period the thread was being executed, but there is a small and consistent difference according to which cluster was active: the first (P0) brought power use of about 2,520 mW, 50 mW higher than the second (P1) at about 2,470 mW. This matches the difference reported previously, and merits assessment in other M4 Pro chips to determine whether this is a general feature.

Single thread at high QoS on E cores

There are methods of running code, such as the in-core floating point loop test used here, on E cores: they can be run with a low QoS (Background), so that macOS allocates them to run on only E cores, or they can be spilt over from high QoS threads when there are more threads than available P cores. On an M4 Pro chip, that requires 11 threads, which results in one of those being allocated to the E cluster, as described next.

m4singlePonEflop1

This chart shows active residency on the four E cores with a single high QoS thread spilt onto them. While cores E1, E2 and E3 appear to handle other threads over this period of more than six seconds, core E0 appears to run at 90-100% active residency executing the spilt thread. Note that this thread wasn’t moved between cores over that period of over six seconds.

E cluster frequency remained constant throughout at its maximum of 2,592 MHz. CPU power use was inevitably dominated by the ten P cores running at 100% active residency and maximum frequency, remaining at just under 14,000 mW. Unfortunately, using powermetrics it’s not possible to estimate the power use of the E cluster directly.

Single thread at low QoS on E cores

This is very different from the spilt thread at high QoS.

m4singleEflop1

There’s no evidence here that any single core in the E cluster ran a thread at 100% active residency. Instead it appears to have been moved rapidly and freely around the cores, with many 0.1 second sampling intervals spanning its execution in more than one core over that period.

m4singleEflop2

Cluster frequency was a steady minimum of 1,050-1,060 MHz, with superimposed spikes when it rose briefly to the maximum of 2,592 MHz. This suggests that the single thread would most probably have been run at close to core minimum frequency, had there not been additional threads to run.

m4singleEflop3

A similar picture is seen in power use, with spikes from a low background of about 40-45 mW required by the single thread alone.

Single thread behaviours

These can be summarised as:

  • P core (high QoS) runs at 100% active residency on a single P core at maximum frequency, and is switched between clusters irregularly (about every 3.7-4.6 seconds). Total power use is about 2,500 mW.
  • High QoS spilt over to E cores runs at 90-100% active residency on a single E core at maximum frequency, and is either not switched between cores at all, or only infrequently.
  • E core (low QoS) runs at about 100% and is moved frequently between all E cores in the cluster, at close to minimum frequency. Total power use is about 40-45 mW.

Performance, power and efficiency

Although I’ll be returning to more detailed comparisons of performance and power use between P and E cores, I provide a single illustration here, for the in-core floating point task used above.

Running 2 x 10^9 loops in each thread, P cores at maximum frequency take 9.2-9.7 seconds per thread, and use about 2,500 mW per thread. E cores running low QoS threads at close to minimum frequency take about four times as long, 38.5 seconds, but use less than 45 mW power per thread. Total energy used to complete one thread is therefore over 23 J when run on P cores, and less than 1.7 J when run on E cores. E cores therefore use only 7% of the energy that P cores do performing the same task.

Key information

  • Current M4 chips feature 4-6 CPU E cores.
  • M4 E cores are arranged in a single cluster of 4 or 6, sharing L2 cache and running at a common frequency.
  • The E core cluster can be shut down (exceptionally), idling at their minimum frequency of 1,020 MHz, or at one of 6 set frequencies up to a maximum of 2,592 MHz, as controlled by macOS.
  • Their instruction set is the same as M4 P cores, ARMv9.2-A without its Scalable Vector Extension (SVE).
  • They use 40-45 mW when at low frequencies, but it’s not currently feasible to measure directly their maximum power use at high frequencies.
  • macOS allocates threads to E cores when their QoS is 9 (Background), and when a thread with higher QoS can’t be allocated to a P core because they are all busy. Management of frequencies and core allocation differ between those two cases.
  • High QoS threads on E cores are run at maximum frequency and appear not to move between cores.
  • Low QoS threads on E cores are run at close to minimum frequency and are highly mobile between cores.
  • Low QoS threads running on E cores run more slowly than higher QoS threads running on P cores, but E core power use is much lower, resulting in considerable saving in total energy use for the same computational task.

Previous article

Inside M4 chips: P cores
Inside M4 chips: P cores hosting a VM

Explainer

Residency is the percentage of time a core is in a specific state. Idle residency is thus the percentage of time that core is idle and not processing instructions. Active residency is the percentage of time it isn’t idle, but is actively processing instructions. Down residency is the percentage of time the core is shut down. All these are independent of the core’s frequency or clock speed.

Inside M4 chips: P cores hosting a VM

One common but atypical situation for any M-series chip is running a macOS virtual machine. This article explores how virtual CPU cores are handled on physical cores of an M4 Pro host, and provides further insight into their management, and thread mobility across P core clusters.

Unless otherwise stated, all results here are obtained from a macOS 15.1 Sequoia VM in my free virtualiser Viable, with that VM allocated 5 virtual cores and 16 GB of memory, on a Mac mini M4 Pro running macOS Sequoia 15.1 with 48 GB of memory, 10 P and 4 E cores.

How virtual cores are allocated

All virtualised threads are treated by the host as if they are running at high Quality of Service (QoS), so are preferentially allocated to P cores, even though their original thread may be running at the lowest QoS. This has the side-effect of running virtual background processes considerably quicker than real background threads on the host.

In this case, the VM was given 5 virtual cores so they could all run in a single P cluster on the host. That doesn’t assign 5 physical cores to the VM, but runs VM threads up to a total of 500% active residency across all the P cores in the host. If the VM is assigned more virtual cores than are available in the host’s P cores, then some of its threads will spill over and be run on host E cores, but at the high frequency typical of host threads with high QoS.

Performance

There is a slight performance hit in virtualisation, but it’s surprisingly small compared to other virtualisers. Geekbench 6.3.0 benchmarks for guest and host were:

  • CPU single core VM 3,643, host 3,892
  • CPU multi-core VM 12,454, host 22,706
  • GPU Metal VM 102,282, host 110,960, with the VM as an Apple Paravirtual device.

Some tests are even closer: using my in-core floating point test, 1,000 Mloops run in the VM in 4.7 seconds, and in the host in 4.68 seconds.

Host core allocation

To assess P core allocation on the host, an in-core floating point test was run in the VM. This consisted of 5 threads with sufficient loops to fully occupy the virtual cores for about 20 seconds. In the following charts, I show results from just the first 15 seconds, as representative of the whole.

vmpcoresm4pro0

When viewed by cluster, those threads were mainly loaded first onto the first P cluster (pale blue bars), where they ran for just over 1 second before being moved to the second cluster (red bars). They were then regularly switched between the two P clusters every few seconds throughout the test. Four cycles were completed in this section of the results, with each taking 2.825 seconds, so threads were switched between clusters every 1.4 seconds, the same time as I found when running threads on the host alone, as reported previously.

For most of the 15 seconds shown here, total active residency across both P clusters was pegged at 500%, as allocated to the VM in its 5 virtual cores, with small bursts exceeding that. Thus that 500% represents those virtual cores, and the small bursts are threads from the host. Although the great majority of that 500% was run on the active P cluster, a total of about 30% active residency consisted of other threads from the VM, and ran on the less active P cluster. That probably represents the VM’s macOS background processes and overhead from its folder sharing, networking, and other Virtio device use.

vmpcoresm4pro1

When broken down to individual cores within each cluster, seen in the first above and the second below, total activity differs little across the cores in the active cluster. During its period in the active cluster, each core had an active residency of 80-100%, bringing the cluster total to about 450% while most active.

vmpcoresm4pro2

In case you’re wondering whether this occurs on older Apple silicon, and it’s just a feature of macOS Sequoia, here’s a similar example of a 4-core VM running 3 floating point threads in an M1 Max with macOS 15.1, seen in Activity Monitor’s CPU History window. There’s no movement of threads between clusters.

vmm1maxtest1

P core frequencies

powermetrics, used to obtain this data, provides two types of core frequency information. For each cluster it gives a hardware active frequency, then for each core it gives an individual frequency, which often differs within each cluster. Cores in the active P cluster were typically reported as running at a frequency of 4512 MHz, although the cluster frequency was lower, at about 3858 MHz. For simplicity, cluster frequencies are used here.

vmpcoresm4pro3

This chart shows reported frequencies for the two P clusters in the upper lines. Below them are total cluster active residencies to show which cluster was active during each period.

The active cluster had a steady frequency of just below 3,900 MHz, but when it became the less active one, its frequency varied greatly, from idle at 1,260 MHz up to almost 4,400 MHz, often for very brief periods. This is consistent with the active cluster running the intensive in-core test threads, and the other cluster handling other threads from both the VM and host.

CPU power

Several who have run VMs on notebooks report that they appear to drain the battery quickly. Using the previous results from the host, the floating point test used here would be expected to use a steady 7,000 mW.

vmpcoresm4pro4

This last chart shows the total CPU power use in mW over the same period, again with cluster active residency (here multiplied by 10), added to aid recognition of cluster cycles. This appears to average about 7,500 mW, only 500 mW more than expected when run on the host alone. That shouldn’t result in a noticeable increase in power usage in a notebook.

In the previous article, I remarked on how power used appeared to differ between the two clusters, and this is also reflected in these results. When the second cluster (P1) is active, power use is less, at about 7,100 mW, and it’s higher at about 7,700 when the first cluster (P0) is active. This needs to be confirmed on other M4 Pro chips before it can be interpreted.

Key information

  • macOS guests perform almost as well as the M4 Pro host, although multi-core benchmarks are proportionate to the number of virtual cores allocated to them. In particular, Metal GPU performance is excellent.
  • All threads in a VM are run as if at high QoS, thus preferentially on host P cores. This accelerates low QoS background threads running in the VM.
  • Virtual core allocation includes all VM overhead from the VM, such as its macOS background threads.
  • Guest threads are as mobile as those of the host, and are moved between P clusters every 1.4 seconds.
  • Although threads run in a VM incur a small penalty in additional power use, this shouldn’t be significant for most purposes.
  • Once again, evidence suggests that the first P cluster (P0) in an M4 Pro uses slightly more power than the second (P1). This needs to be confirmed in other systems.
  • powermetrics can’t be used in a VM, not unsurprisingly.

Previous article

Inside M4 chips: P cores

Explainer

Residency is the percentage of time a core is in a specific state. Idle residency is thus the percentage of time that core is idle and not processing instructions. Active residency is the percentage of time it isn’t idle, but is actively processing instructions. Down residency is the percentage of time the core is shut down. All these are independent of the core’s frequency or clock speed.

Inside M4 chips: P cores

This is the first in a series diving deeper into Apple’s new M4 family of chips. This starts with details of its Performance (P) cores. Comparisons of their performance against cores in earlier M-series chips will follow separately when I have completed them.

M4 family

There are currently three M4 designs:

  • Base M4, with 4 P and 6 E cores, also available in a cheaper variant with only 4 active E cores, and a ‘binned’ variant for iPads with only 3 active P cores.
  • M4 Pro, with 10 P and 4 E cores, also available in a ‘binned’ variant with only 8 active P cores.
  • M4 Max, with 12 P and 4 E cores, also available in a ‘binned’ variant with only 10 active P cores.

Apple is expected to release an Ultra variant in 2025, consisting of two M4 Max chips connected and working in tandem, providing a total of 24 P and 8 E cores.

Apart from the number of cores in each design, their caches and memory, all P cores are the same, and different from E cores.

P core architecture

All CPU cores are arranged in clusters of up to 6. All cores within any given cluster share L2 cache, and are run at the same frequency (clock speed). The Base M4 has a single cluster of 4 P cores, while the Pro and Max have two clusters of 5 and 6 cores respectively.

Frequency

A prominent feature of both P and E cores is their variable frequency (clock speed). In the case of P cores, this can be set to any of 17 values between the minimum of 1,260 MHz and maximum of 4,512 MHz (1.3-4.5 GHz). When running macOS, cluster frequencies are set by macOS at a kernel level; other operating systems may offer more direct control.

P cores idle at 1,260 MHz, but can also be shut down altogether. Previous M-series chips have been reported by the powermetrics command tool as sometimes being idle at a frequency of 0 MHz, but the M4 is the first to have idle and down states reported separately, for example:
CPU 4 active residency: 0.00%
CPU 4 idle residency: 0.00%
CPU 4 down residency: 100.00%

when that core and its whole cluster are shut down rather than just idling. It’s not clear whether this is merely an administrative change, or M4 cores implement this state differently from previous cores.

Instruction set

There’s confusion over the Instruction Set Architecture (ISA) supported by M4 cores. This is explained in the LLVM source, where it’s claimed that they’re “technically” ARMv9.2-A, but without its Scalable Vector Extension (SVE). Some might consider that’s closer to ARMv8.7-A, one version more recent than the M3’s ARMv8.6-A.

Although this is now fully supported in LLVM clang, it’s not clear how fully it’s supported by Xcode, for example.

Power

When shut down, a P core consumes no power, of course, and at idle with no active residency, it uses only 1-2 mW, according to measurements reported by powermetrics.

Maximum power consumption rises to approximately 1,400 mW when running intensive floating point calculations at 100% active residency, and to approximately 3,230 mW when running NEON vector instructions at 100% active residency.

macOS core allocation

Threads are normally allocated by macOS to an available P core when their designated Quality of Service (QoS) is higher than 9 (Background), for example when using Dispatch, formerly branded Grand Central Dispatch (GCD). Running threads may also be moved periodically between P cores in the same cluster, and between clusters. Previous M-series chips appear to move threads less frequently, and may leave them to run to completion after several seconds on the same core, but threads appear to be considerably more mobile when running on M4 P cores.

VM4core4threadPcoresARes

This bar chart shows 4 threads from 4 virtual CPUs in a VM running for 3 seconds at 100% active residency. For almost all that period, the threads remain running on the 4 physical cores of the first P cluster in this M1 Max, with the second P cluster remaining idle for much of that time.

The following charts show 4 threads of intensive in-core floating point arithmetic running on the P cores of an M4 Pro.

m4threads1clusters

When viewed by cluster, those threads are loaded first onto the second P cluster (red bars), where they run for 0.4 seconds before being moved to the first cluster (pale blue bars). After running there for 1.3 seconds, they’re moved back to the second cluster for a further 1.3 seconds, before completing on the first cluster.

The next two bar charts show each cluster separately, illustrating thread mobility within them.

m4threads2cluster1

When running on the first cluster (above), threads appear to be moved to a different core approximately every 0.3 second, as they do when on the second cluster (below).

m4threads3cluster2

m4threads4frequency

Cluster frequency matches this movement, with each cluster being run up to maximum frequency (shown here averaged across the whole cluster) to process the threads running on its cores. The black line below those for the P clusters shows the small changes in average frequency for the E cluster over this period.

m4threads5power

This last chart shows the total CPU power use in mW over the same period. Of particular interest here is the consistent difference in power use reported by powermetrics between the two P clusters: the first (P0) used a steady 6,000 mW when running these four threads, whereas the second (P1) used slightly less, at 5,700-5,800 mW. That could be the result of measurement error in powermetrics, peculiar to this particular chip, or could reflect an underlying difference between the two clusters.

Thread mobility makes interpreting CPU History in Activity Monitor difficult, as the fastest frequency of sampling available there is every second, while powermetrics was sampling every 0.1 second when gathering the data above. As groups of threads may be moved between clusters every 1.3 seconds or so, this can give the impression that threads are being run on both clusters simultaneously. Once again, great care is needed when interpreting the data shown by Activity Monitor.

Key information

  • Current M4 chips offer 4-12 CPU P cores.
  • M4 P cores are arranged in clusters of up to 6, sharing L2 cache and running at a common frequency.
  • P core clusters can be shut down, idling at their minimum frequency of 1,260 MHz, or at one of 18 set frequencies up to a maximum of 4,512 MHz, as controlled by macOS.
  • Their instruction set is “technically” ARMv9.2-A, but without its Scalable Vector Extension (SVE).
  • They use 1-2 mW when idle, rising to peaks of 1,400 mW (floating point) or 3,230 mW (NEON vector code).
  • macOS preferentially allocates them threads at all QoS higher than 9 (Background).
  • Threads running on M4 P cores are mobile, and may be moved to another core in the same cluster frequently, and after just over a second may be transferred to a core in the other P cluster, when available.
  • Thread mobility makes interpretation of the CPU History window in Activity Monitor very difficult.

Explainer

Residency is the percentage of time a core is in a specific state. Idle residency is thus the percentage of time that core is idle and not processing instructions. Active residency is the percentage of time it isn’t idle, but is actively processing instructions. Down residency is the percentage of time the core is shut down. All these are independent of the core’s frequency or clock speed.

❌