Reading view

There are new articles available, click to refresh the page.

Inside the Unified Log 4: Log entries

For many years, I believed what the log command told me, that log entries could contain any of the 26 or more fields available, although they didn’t. It was only as I was developing utilities like LogUI that I discovered that log entries come in (at least) four types, each with its own format and set of fields. This article is a guide to those, and how they are displayed in LogUI.

Entry fields

Those available in the OSLog API are fewer in number than appear in log command output, and include some of limited interest. Those not exposed in LogUI include:

  • store category, which is invariably disk storage here.
  • format string, that used to format the contents of messages. This was introduced following serious security leaks in High Sierra.
  • components, linking in with the format string.

LogUI displays each entry using the same order of fields and colour-coding. Although they can’t all be seen together in any single log entry, the overall sequence is:

Standard levels are given as text, and chosen from one of the following: fault, error, notice, info, debug, undefined. These are only used with Regular log entries, not other types. LogUI always includes debug level entries when they’re available.

The four types of entry are:

  1. Regular
  2. Activity
  3. Boundary
  4. Signpost.

Regular entries

These are normally by far the most common, and are seen throughout the processes and subsystems writing log entries. They normally contain up to the following fields:
datestamp, [1], activity ID, category, level, sender, process, process ID, subsystem, thread ID, message

These examples include:
datestamp, 1, activity ID, category, level, sender, process, process ID, subsystem, thread ID, message
which is fairly normal.

Activities

These mark specific activities, and vary according to the process and subsystem. Some are valuable waypoints, and all are recognisably shorter than most regular entries, containing only the following fields:
datestamp, [2], activity ID, parent activity ID, sender, process, process ID, thread ID, message

These are examples of one of the most valuable activities reported, indicating a mouse-click or tap. They’re also complete, as they consist of:
datestamp, 2, activity ID, parent activity ID, sender, process, process ID, thread ID, message

Boundaries

These are rare but instantly recognisable because of their brevity. They consist of just three fields:
datestamp,[3], message

Two of the most important are the announcement of the start of kernel boot:

and adjustment of the internal clock:

These are also easy to search for, as their message contains the distinctive === string.

Signposts

By default, LogUI extracts omit Signposts, but if you tick the Show Signposts box before loading log entries, they will also be displayed. In parts, they can outnumber regular entries, and are unlikely to provide you with meaningful information unless you know internal details of their process. Each Signpost adds three type-specific fields, shown after the process ID:
datestamp, [4], activity ID, category, sender, process, process ID, signpost ID, signpost name, signpost type, subsystem, thread ID

These examples come from the most prolific user of Signposts, SkyLight for WindowServer, and contain
datestamp, 4, activity ID, category, sender, process, process ID, signpost ID, signpost name, signpost type, subsystem, thread ID
Note there’s no message field, as their meaning is determined by the signpost fields.

Datestamps and times

The OSLog API doesn’t currently give access to Mach times, only to opaque Date variables. From those, LogUI’s datestamps give:
year–month–day hour:minute:second.microsecond+timezone

All times and time zones given are those current when LogUI obtains that extract, not when that entry was written. This can become extremely confusing when clocks change to and from {summer time, daylight time, daylight saving time, daylight savings time, DST}, and when passing through time zones, and great care is required when reading logs containing such corrections. LogUI tries to make this easier, but care is still required.

If you have used the log command, you may be aware that can return Mach times as ticks, offering precision down to the nanosecond. This currently isn’t possible when using the OSLog API, but given the relatively slow clock of Apple silicon Macs, it’s no longer as useful as it used to be with Intel’s nanosecond Mach ticks.

Censorship

By default, all data in message fields is censored to protect the privacy of the user. This replaces chunks of text with the dreaded <private>, and can render many entries devoid of any useful information. In recent versions of macOS log privacy can be removed by installing a profile. However, that doesn’t apply retrospectively, only to log entries collected after the profile has been installed.

Removing privacy also increases the size in storage of log entries, and may reveal sensitive information. As soon as you have completed acquisition of the logs you need with privacy removed, you should therefore remove the profile, to allow normal censorship to resume.

A suitably signed profile is here: enablelogprivatedata

To install the profile, unzip the archive into a convenient folder and double-click it. You’ll be informed by a notification that you need to review the profile to install it. Open System Settings and select Device Management in its View menu, or search for it. Follow the instructions given there to install and activate it.

Sadly, this doesn’t cover all censorship. Some systems require additional configuration changes, for example CFNetwork diagnostic logging. Jeff Johnson explained how to enable that, but Apple has since blocked that, and I don’t know of a practical alternative. In some cases, additional detail can be obtained by adjusting log settings.

Summary

A short practical summary of LogUI’s log entries is provided in its Help book.

LogUI 1.0 build 74 adds a Diagnostics Tool for your logs

As promised earlier this week, I’m delighted to offer a new version of my log browser LogUI that provides a Diagnostics Tool to help you understand log folders and discover any problems with them.

Open its window using the Diagnostics Tool command in the Window menu, and you’re offered four tools at the top.

The first, Get Info, performs a simple analysis on the files in the selected diagnostics folder. By default, that’s your current live log, in the path /private/var/db/diagnostics, in your Data volume. After telling you how many log files there are in each of its three main folders, and the number of timesync files, it reports the date and time of the oldest Persist log file, marking the start of the continuous log record, in this case nearly 4 days ago.

You can use these tools on any diagnostics folder you can access through its dialog. This includes Time Machine backups, external boot disks, and other bootable systems. Don’t click on the Open button, though, until you’ve selected the diagnostics folder in the view above.

Locating the diagnostics folder in a Time Machine backup can be interesting, but once you’ve found it, LogUI will happily check it for you.

The Catalogue tool lists all the tracev3 log files in the folders inside diagnostics, starting with those in Persist. It gives each file’s creation and modification timestamps, indicating the range for log entries within them, their size in bytes, and an estimate of the period that file covers.

The Analyse tool extracts information from each of logd‘s statistics files, with the number of log entries broken down in frequency order. If you tick the CSV checkbox, they will be delivered in CSV format, ready to import into other software such as a spreadsheet.

The last of the tools, Save Text, saves the contents of the window to a text file for your records.

Further information about locations used for log files is in this article.

LogUI 1.0 build 74 is now available from here: logui174
from Downloads above, and from its Product Page.

Enjoy!

Inside the Unified Log 3: Log storage and attrition

By far the most common problem experienced with the Unified log isn’t its large number of entries, but a lack of entries. You go to check your Mac’s security using SilentKnight, or Skint runs its automatic daily check, and they can’t find any log entries recording XProtect Remediator scans. Since those are obtained by analysing the log for the previous 36 hours, when your Mac’s logs only go back 8-12 hours, entries for the last set of scans are likely to be missing. This article looks at why that happens, and how macOS maintains its log.

Traditional Unix-style logs are maintained according to their age. Every 24 hours, routine housekeeping procedures delete log files over a certain age, typically five days, in the process of rolling the log. Because the Unified log could over that five-day period have swallowed many GB of storage, its maintenance service logd deletes log records according to multiple criteria including the space they occupy, their age, and the type of entry. This is considerably more complex, and occurs in three phases, according to where the entry is stored.

Ephemeral entries

Log entries are initially written to memory, before logd writes most of them to permanent storage on disk.
mul102LogdFlow

The first substantial purging of entries thus occurs when logd decides which are ephemeral and won’t be written to disk. This can be seen by following the number of entries in a short period of high activity in the log, over time, and is shown in the chart below for a sample period of 3 seconds.
When fetched from the log within a minute of the entries being written, a total of 22,783 entries were recovered. Five minutes later there were only 82% (18,655) of those remaining. Attrition of entries then continued more slowly, leaving 80% (18,309) after 8 hours. Analysis suggests that over this period in which there were about 6,100 log entries per second written to disk, approximately 1,700 log entries per second were only kept in memory and never written to disk. That suggests about 22% were ephemeral, a proportion that’s likely to vary according to the origin and nature of log entries.

Persist entries

The great majority of log entries that survive to be written to permanent storage are kept in the tracev3 files in /private/var/db/diagnostics/Persist, where logd maintains them according to the total size of that folder, with a target of 520-530 MB. As each tracev3 file is up to 10.5 MB in size, that results in logd retaining about 50 files in that folder, although some are smaller than the maximum.

Two of my apps currently provide the datestamp of the start of the current collection of Persist log files as an indicator of the oldest log entry available from them: XProCheck, and Mints with its Logs button. This is a feature I intend adding shortly to LogUI.

However, not all log entries are stored in those Persist files. Looking back in time at total log entries available for a set ten minute period each day, you might see totals like:

  • 1 day old 33,827 in 10 minutes
  • 2 days old 98,534
  • 3 days old 59,296
  • 4 days old 10
  • 5 days old 1
  • 6 days old 40
  • 7 days old 0
  • 8 days old 358
  • 9 days old 1.

Those for the last 3 days are almost all Persist entries, but older entries are those retained in tracev3 files in the Special folder.

Special entries

Fault and Error log entries are normally written to the tracev3 files in the Special folder, and may contain additional message content kept in the warren of folders and files inside /private/var/db/uuidtext. logd purges entries from Special files separately, and apparently on the basis of their type and content rather than size. As a result, the Special folder can contain many tracev3 files of sizes ranging from over 2 MB to just a few KB, with their size tending to reduce with age. Any log entries recovered from dates before the oldest Persist file thus must have come from Special files.

Although files stored in the uuidtext folder are small, there can be a great many of them, and total size of that folder can exceed 1 GB. Those too are maintained by logd.

Other folders and files

tracev3 files stored in the Signpost folder contain only Signpost log entries used for performance assessment, and are purged at a slower rate than Persist files, but not retained as long as Special files. The High Volume folder appears seldom if ever used. The timesync folder contains time synchronisation data, small files that normally cover the whole period of Special files.

The /private/var/db/diagnostics folder contains several other files, including the logs of logd and logd_helper, and most significantly pairs of statistical summaries written during log maintenance, named logdata.statistics.[n] where n is a number starting from 0, in both .txt and .jsonl (JSON) format.

Each time logd performs maintenance on a tracev3 file, or on associated uuidtext files, it records data about the files in the current logdata.statistics files, both as plain text and in JSON format. The most useful of these records occurs when a Persist tracev3 file is rotated from being the file into which new log entries are written, to being retained without further additions. That entry records:

  • the name of the tracev3 file;
  • the time of rotation, thus the time immediately following the last log entry to be made to that file;
  • the total number of log entries in that file, for example 42,365,476;
  • for the top 20 processes that wrote entries in that period, the number of entries, the percentage of total entries, and the path to the process, listed in order of number of entries.

For example, in that tracev3 file containing a total of 42,365,476 entries, the kernel might have written 13,095,296 entries, 30.9%, and be top of the list, while runningboardd might only have written 1,223,157 or 2.9%. These statistics can be valuable in drawing attention to periods when there were problems, and for discovering which entries are limiting the coverage of Persist files, making it impossible for apps to recover entries for XProtect Remediator scans, for example.

Statistics entries for memory rollovers can also be useful, as are those for Special file rotation, although the latter contain fewer entries than Persist files.

Extending the period of log coverage

Currently, there doesn’t appear to be any way to set logd‘s size allowance for Persist files. When the Unified log was first introduced, it wasn’t unusual for that setting to preserve full log records covering a period of up to 20 days. As more processes now write copious entries in the log, a Mac that’s left awake and running at all times may only retain the last 20 hours of Persist entries, or even less.

Macs that don’t need to be awake and running at all times can extend their log coverage by sleeping or being shut down, when of course no entries can be written. If that isn’t possible, you can write your own XML property lists to /Library/Preferences/Logging to limit the retention of specific categories of entry. However, experience shows that only achieves small extensions to time coverage. It’s also worth bearing in mind that disabling privacy protection in the log will increase the size taken by most log entries, so shortening time covered by the retained logs.

Perhaps the wisest and most effective way to extend the time coverage of logs is to discover the causes of excess entries and address those, although that’s inevitably the most difficult solution.

One little-used technique is to turn log records in backups into logarchives, enabling old log entries to be accessed days or even years after they have been written. As an example of what can be achieved, the log entries below were written eight years ago, on 26 September 2017, saved in a logarchive, and browsed using LogUI on 26 September 2025.

I will explain how to do this in a future article in this series.

Summary

  • Log maintenance is a sophisticated managed process that discards log messages for several reasons, most generally to keep total log file size within limits, rather than removing entries purely on the basis of age.
  • A fifth of log entries are likely to be ephemeral, and lost from the log within the first minutes after they’re written. If you want the fullest entries possible, obtain the log excerpt as soon as possible after its entries have been written.
  • Most retained log entries are written in Persist logs, where tracev3 files are removed by age to keep their total size to just over 500 MB. Those should preserve log entries for hours or days after they’re written.
  • Entries for Faults and Errors are stored in Special logs, where they’re kept for longer, sometimes for weeks.
  • logdata.statistics files provide detailed statistics for log files as they’re rotated, and can tell you which processes wrote most entries.
  • As logs aren’t written during sleep, or when shut down, allowing sleep and shutting down will extend the duration of log records.
  • Time Machine and other backups can be used to recover old logs as logarchives.

Inside the Unified Log 2: Why browse the log?

Following the introduction of the Unified Log, a surprising number of folk you would expect to use it have stopped. Some experienced developers and those providing advice in Apple Support Communities seemingly take pride in their lack of log literacy, claiming that the log is now impossible to use, and only accessible to Apple’s engineers. While it does present obstacles, pretending that the log isn’t a vital tool in diagnosis and understanding is burying your head in the sand. This article shows why.

Why the log?

The log provides support for several purposes. It’s widely used to investigate events such as bugs and unexpected behaviours, to establish their cause before working out how to fix them, in diagnosis and troubleshooting. It’s also used to discover how subsystems within macOS work, and what they do. Examples of those include LaunchServices, DAS-CTS scheduling and dispatching, and RunningBoard, all of which are nearly invisible to other methods, but write copious and explicit entries in the log. With its precise time recording and special Signpost log entries, it’s also invaluable for measuring performance, hence in optimising code.

Concentrating on the log’s use in diagnosis, log entries can be used to answer most of the key questions:

  • What happened?
  • When did it happen?
  • Who made it happen?
  • How did it happen?
  • Why did it happen?
  • What can I do about it?

Diagnose a mystery update

To illustrate those in practice, I’ll use an example that happens to be fresh in my mind, the silent updating of XProtect data last week. The only two clues available outside the log were the fact that XProtect had been updated, and that had occurred at 06:46:43 GMT on the morning of 17 September. There was no record of this event anywhere else that might have given any better information on how it had occurred.

Browsing the log from one second earlier confirmed what and when that had happened. I quickly discovered who made it happen when I found the log entry
2025-09-17 06:46:42.615072 com.apple.duetactivityscheduler REQUESTING START: 0:com.apple.security.syspolicy.xprotect-update:7874AD
revealing that update had been accomplished by a background check scheduled and dispatched by DAS-CTS, and performed by an update service com.apple.security.syspolicy.xprotect-update.

That in turn fired up XProtectUpdateService, which recorded that it promptly completed and activated the update:
2025-09-17 06:46:42.695517 com.apple.xprotect Connecting to XProtectUpdateService
2025-09-17 06:46:42.744182 com.apple.security.XProtectFramework.XProtectUpdateService XProtectUpdateService booting
2025-09-17 06:46:43.157255 com.apple.security.XProtectFramework.XProtectUpdateService Attempting to apply update: [private]
2025-09-17 06:46:43.191178 com.apple.security.XProtectFramework.XProtectUpdateService Update completed. Activated update [private]

XProtectUpdateService initiated a connection to the iCloud service now used to update XProtect in Sequoia and later, but log entries didn’t show the update being downloaded from that source. Instead, there was an error reported in the entry
2025-09-17 06:46:43.193159 com.apple.syspolicy.activities Finished Xprotect update in 496.4100122451782 ms: Error Domain=XProtectUpdateError Code=2 "Activated update LocalUpdate[5315]" UserInfo={NSLocalizedDescription=Activated update LocalUpdate[5315]}

Although the messages in many of these log entries are opaque, that entry makes it clear that XProtectUpdateService hadn’t downloaded the new version from iCloud, but had activated a local update, which we know from experience means the copy already downloaded to the traditional XProtect location had been used to install that update in its new location. That used to be available to the user through the xprotect update command, but is no longer. Thus, the only way that update could have been installed was the result of com.apple.security.syspolicy.xprotect-update being run routinely.

If we can’t intervene and force the update manually, the final piece of information we need is how often com.apple.security.syspolicy.xprotect-update is run, and that’s revealed into a later log entry:
2025-09-17 06:46:43.202474 com.apple.duetactivityscheduler Submitted: 0:com.apple.security.syspolicy.xprotect-update:58B6CE at priority 5 with interval 86400 (Wed Sep 17 22:58:51 2025 - Thu Sep 18 18:58:51 2025)
i.e. every 86,400 seconds, or 24 hours.

Procedure

How difficult was that to discover? Even with minimal prior knowledge, consummately easy, and it only took a couple of minutes.

My starting point was the timestamp reported for the update by xprotect version, of 06:46:43 GMT. I therefore set LogUI to display 5 seconds of log starting from one second before that. In the screenshots below, times are shown in BST, one hour in advance of GMT.

This returned a total of 7,174 log entries, far too many to browse. Knowing that I was looking for entries concerning XProtect, I then typed that into the search box and pressed Return, to display only those entries whose message contained the text xprotect.

That narrowed down the number of entries to just 65, starting with the scoring and dispatch of com.apple.security.syspolicy.xprotect-update by DAS-CTS at 42.608967 seconds, and containing all the entries quoted above. Just to be certain that I hadn’t missed anything relevant, I then cleared the search box and pressed Return to display all log entries again, scrolled down to 42.608967 seconds, and checked through those for the period to 43.19315 seconds, when the update had completed.

Of course, not all log investigations are as simple or successful, but many are just as straightforward. The main limitation isn’t the excessive number of log entries, but those from subsystems that make very few entries, as occurs in Spotlight indexing and search. There’s always a way to filter out unwanted entries, but you can’t magic in entries that were never made in the first place.

Conclusions

Browsing the log might appear daunting, even overwhelming or terrifying at first, but as you become more familiar with it you appreciate the rich information it can provide. Log literacy is one of the basic skills required for anyone who wants or needs to dig deeper into their Mac or Apple device. Without it diagnosis, research and performance measurement are like trying to paint a landscape while wearing a blindfold.

Inside the Unified Log 1: Goals and architecture

The introduction of Mac OS X in 2000-01 brought conventional text-based logging to the Mac, with standard logs including system.log and console.log.

console2005

With the release of macOS 10.12 Sierra in 2016, those were almost completely replaced by the Unified Log, which has continued evolving since. Intended to provide a single efficient logging mechanism for user and kernel modes, its design goals are:

  • to maximise information collection with minimum observer effect;
  • as much logging on as much of the time as possible;
  • compression of log data for efficient use of space;
  • a managed log message lifecycle;
  • designed-in privacy protection;
  • to be common across all Apple’s operating systems;
  • all legacy APIs (NSLog, asl_log_message, syslog, etc.) to be redirected into the single log;
  • to support debugging, but not system administration or audit.

To achieve this, log entries are written using the OSLog API (or Logger from Swift), handled by the logd daemon and compressed into a buffer. From there entries are either retained in memory if intended to be ephemeral, or written out to a file. Log entries are only made from the start of kernel boot; earlier phases of the boot process instead save breadcrumbs that are largely inaccessible and unintelligible.

mul102LogdFlow

Performance of writing log entries is excellent, with a single process able to write sequential entries every 400 ns from a code loop, a rate of 2.5 million entries per second, although that rate is unlikely to be sustainable for long.

Log storage

There are two main groups of files that store log entries: those kept in /var/db/diagnostics/Persist/ in the form of tracev3 files containing regular log entries, and further tracev3 files in /var/db/diagnostics/Special/ containing additional shorter-life entries. Additional and lengthier log data can instead be stored in files named by UUID in /var/db/uuidtext/, and there’s also support for special Signpost entries intended for performance measurement, and scope for high-volume collection.

tracev3 files use a proprietary compressed binary format that remains undocumented to this day, but has been largely reversed. Apple’s APIs don’t give direct access to their contents, only through closed-source utilities such as the log command tool and programmatically through the OSLog API. Where users want a more portable format, Apple recommends conversion to a logarchive package, although that’s also undocumented and only directly accessible using log, the Console app and some third-party utilities. Logarchives still store all log entries in tracev3 files.

Collection and retention of entries from different subsystems is configured in logging profiles, XML property lists stored in /System/Library/Preferences/Logging (read-only, in the System volume) and /Library/Preferences/Logging, which the user controls. You can create your own custom profiles, or modify them on the fly using the log command.

The logd service maintains tracev3 files and their ancillaries, weeding them to remove time-expired entries. It does so to constrain the total size of log files in the system, rather than rolling them to retain all entries for a specified period. Most ephemeral entries are weeded within 5 minutes of being written to the log, leaving persistent entries to remain for the following days, depending on the volume of new entries being written. For example, in a 3 second period of collection, when all entries were obtained within a minute of being written, 22,783 entries were found. Five minutes after they had been written, only 82% of those remained, and over 8 hours later that had fallen to 80%, or 18,309.

Log content

In contrast to traditional text-based logs, entries in the macOS log contain structured data in set fields, such as the datestamp, subsystem and log message. The number of fields available from the log command has risen from 16 to over 25, but entries are constrained in which fields are available, according to their type. Currently there are four types, Regular, Activity, Boundary and Signpost.

Some log entries, notably those written to /var/db/uuidtext/, can have very long message fields, extending to dozens of lines. Among the most verbose is the com.apple.runningboard subsystem, which not infrequently writes the whole of its records for an app into the message field of a single log entry.

Privacy

Privacy protection censors content of log entries when they’re written, replacing sections of the message field with <private> in accordance with the formatting string for that message. This protection can be disabled, but as entries are censored when they’re written, that only affects those written after censorship has been removed, and can’t be applied retrospectively.

One significant change in macOS 26 Tahoe is that the message contents of all log entries written using the old NSLog interface are replaced with <private>, rendering them essentially useless. Since macOS 10.12.4, all access to log entries has required admin privileges.

Access

macOS provides users with two means of accessing entries in the log: the log command tool, and Console app. In common use, log generates text output, so losing the original data fields, one of the major advantages of the Unified Log. Console offers two methods of access: a live stream of entries, or browsing past entries in a saved logarchive.

I have four main tools that provide extensive log access:

  • LogUI, using the OSLog API and displaying entries as formatted SwiftUI Lists;
  • Mints, offering special-purpose browsers for Time Machine, APFS, and other domains;
  • Ulbow, using the log tool and displaying entries as formatted Rich Text using AppKit;
  • Consolation, using the log tool and displaying entries as formatted Rich Text using AppKit.

These are available from their product page, and here for Mints.

How to check if your Apple silicon Mac is booting securely

There are so many controls in macOS that sometimes you can’t see the wood for the trees. This can leave uncertainty over essentials, such as whether your Apple silicon Mac really is properly secure, or maybe there’s something sinister going on with it? This is a question I’m asked not infrequently, usually when someone has been spreading disinformation or FUD (fear, uncertainty, doubt). So how can you check that your Mac is properly locked down and boots securely?

Quick checks

There are two quick checks that cover the essentials. First, open System Information and select the Controller section in Hardware.

This provides a brief summary of your Mac’s boot security, which should read as shown above. If you still need to use a kernel extension or similar, your Mac might show Reduced Security with Allow All Kernel Extensions enabled, but you should do everything you can to avoid that.

Secure Boot is controlled using Startup Security Utility in Recovery mode, and if you care to start up in that mode, you can confirm or correct its settings there.

bootsec2

Back in normal user mode, open Privacy & Security settings and ensure you have FileVault enabled there.

filevault3

SilentKnight also checks that XProtect/Gatekeeper checks are enabled, and that security data are up to date, giving you complete confidence.

Details

Although those should be sufficient for most, some want to go further and verify that their Mac’s boot process and security systems are also working correctly. To do that, shut your Mac down, wait ten seconds or so, and start up normally with the startup chime sounding at a known time. Enter your password, wait a few seconds for the Finder to get set up and running, and open LogUI. Set its time to that of the startup chime, and get the first 10 seconds or 10,000 log entries. You may need to adjust the seconds to capture the full boot sequence. When you have, look through the log and identify the following waypoints.

In each of these log entries, I have emboldened a word or two that you can copy from here and paste into LogUI’s Search box, then press Return. That will display the log entry, and sometimes others you might find relevant. Times are given here in seconds, with the startup chime occurring at about 37 seconds. Version numbers shown are those for macOS 15.6.

The start of boot is recorded as
37.562774 === system boot: [UUID]
and a little while after that, the kernel declares its version details
42.759300 Darwin Kernel Version 24.6.0: Mon Jul 14 11:30:40 PDT 2025; root:xnu-11417.140.69~1/RELEASE_ARM64_T6041
for macOS 15.6.

Further down you’ll come across more information about key security components, including the Trusted Execution Monitor
43.060422 [Log]: Code Signing Monitor Image4 Module Version 7.0.0: Fri Jul 11 16:51:29 PDT 2025; root:AppleImage4_txm-320.100.22~1090
43.060447 [Log]: build variant: txm.macosx.release.TrustedExecutionMonitor_Guarded-135.100.37

Then the iBoot firmware version
43.061758 iBoot version: iBoot-11881.140.96
43.061760 iBoot Stage 2 version: iBoot-11881.140.96

CoreCrypto support is vital, and another Image4 extension
43.137635 FIPSPOST_KEXT [133796636] fipspost_post:154: [FIPSPOST][Module-ID] Apple corecrypto Module v18.3 [Apple silicon, Kernel, Software, SL1]
43.242334 Darwin Image4 Extension Version 7.0.0: Mon Jul 14 11:23:46 PDT 2025; root:AppleImage4-320.100.22~2585/AppleImage4/RELEASE_ARM64E

You should see entries reporting the loading of security policy components
43.242343 Security policy loaded: AppleImage4 hooks (AppleImage4)
43.242961 Security policy loaded: Apple Mobile File Integrity (AMFI)
43.243092 Security policy loaded: Seatbelt sandbox policy (Sandbox)

The Secure Enclave Processor or SEP is another key component that has to be started up
43.264594 "AppleSEPKeyStore":326:0: starting (BUILT: Jul 14 2025 23:34:10) ("normal" variant 🌽 , 1827.120.2)
43.264639 "AppleSEPKeyStore":471:0: _sep_enabled = 1

Apple System Policy should follow a bit later
43.760156 Security policy loaded: Apple System Policy (ASP)
43.760188 AppleSystemPolicy has been successfully started

The root of the file system is then identified in two entries whose origins go right back to the start of Mac OS X
43.940643 BSD root: disk3s1
43.940644 , major 1, minor 13

And APFS mounts the root file system, using the SSV snapshot
43.941048 apfs_vfsop_mountroot:2984: apfs: mountroot called!
44.034685 apfs_vfsop_mount:2763: disk3s1 Rooting from snapshot with xid 1724240.

One of the most important entries comes shortly after that, where successful validation of the SSV’s root hash is reported
44.038830 authenticate_root_hash:642: disk3s1 successfully validated on-disk root hash

It’s now time to start user space processes, and for that launchd must be loaded so it can launch everything else
44.103761 load_init_program: attempting to load /sbin/launchd

How Secure Boot works

Apple silicon Macs have a small ROM to support DFU mode in case a full Restore is required, and to check and load the first stage of the ‘firmware’, the Low-Level Bootloader or LLB. Only if that matches its signature will the ROM firmware hand over to it and proceed with the boot process. The LLB in turn performs the same checks on the second stage ‘firmware’, iBoot proper. That goes on to check the kernel, before loading that and handing over for kernel boot to take over.

iBoot ‘firmware’ doesn’t write anything in the log, but once the kernel takes over its log entries provide a detailed account of its progress. The great majority of its log entries are unintelligible to anyone outside Apple, but the waypoints I have given above identify some of the most important steps it takes. When it’s ready, the kernel validates the root hash for the SSV snapshot, as noted above, enabling the boot process to proceed to load and run other parts of macOS. The remaining hash checking of the SSV, to confirm that it’s exactly as Apple intends, proceeds in a ‘lazy’ fashion, as access is needed to its contents.

This chain of validation before loading the next stage ensures that nothing in the boot process can be tampered with or changed, and the boot is secure throughout. Apple provides further details in its Platform Security Guide.

What does RunningBoard do? 5 Log insights

If RunningBoard’s copious log entries record the life cycle of apps, can we use them to our advantage? To test this out, I’ve analysed a section of log using waypoints and information provided in RunningBoard’s entries.

Waypoints, or landmarks if you prefer, are essential for navigating the log. In an ideal world we would always know when any significant event occurred, timed to the millisecond. In practice we may only be able to estimate to the nearest few seconds or minutes. Without some means of discovering exactly when to obtain log extracts, you can waste many hours trying to pin down when something happened, and in many cases will be forced to abandon the hunt.

Methods

My aim was to separate RunningBoard log entries into those handling its assertions, which should represent life-cycle events, and job descriptions giving details of apps launched. To try this yourself, open LogUI and set the Start date and time to the start of the period of interest. Set the Period to at least 100 seconds, and Max entries to 2,000 or more. Then set the Predicate popup menu to read subsystem, and type in com.apple.runningboard so that LogUI only gets entries from that subsystem. Click on the Get Log tool in the toolbar, and check you get at least 1,000 entries.

Click on the Save JSON tool to save the whole of this excerpt. To view all the RunningBoard assertions acquired over that excerpt, type acquiring assertion in the search box at the top right, and press Enter.

The window name then changes to append the text from the search box.

To save this limited selection of entries, first click on the Reduce tool to discard all the others, then click on the Save JSON tool again and save the entries using a different filename. Repeat that using each of three search terms:

  • acquiring assertion to see RunningBoard’s outline of life cycle events,
  • constructed job to see job descriptions for newly launched apps,
  • extension overlay to see similar information for appexes and similar extensions.

In my case, I analysed a period of 4 minutes of user activity on a Mac mini M4 Pro running macOS 15.6, during which there were 6,580 RunningBoard entries, suggesting that the whole log would have had well over 50,000 entries in that time, far too many to attempt any more detailed analysis. My search terms found 305 assertions acquired, 3 job descriptions constructed, and 20 extension overlays submitted.

Job descriptions

The three captured represented the three apps I had launched over those four minutes, Cormorant, DelightEd and Consolation 3. Each of them has a platform ID of 1, as notarized macOS apps. I also noticed that one was run in app translocation, although this was long after its first run. Recent versions of macOS, Sequoia in particular, appear prone to this, when an app that should have cleared quarantine gets stuck in perpetual app translocation.

Extension overlays

While I had expected to find those three app launches, I didn’t expect to see any appexes being run over this period. Those encountered consisted of three widgets, none of which had ever been opened, and five QuickLook thumbnail extensions. Most of these were run multiple times, with ScappleThumbnail appearing on six occasions. All were platform 1, except for the widgets, all three of which are bundled in macOS, for the FindMy widget and NewsToday2. They were platform 6, and subject to RunningBoard’s resource controls.

RunningBoard’s log entries here give potentially valuable insights that might otherwise be missed.

Assertions

It’s straightforward to construct a narrative of the key events that took place over that period of 4 minutes using a selection of assertions acquired. Rather than reproduce the whole of each of those waypoints, here they are laid out in more readable form.

11:40:50.424950 Acquiring assertion targeting app application.co.eclecticlight.Cormorant.10809046.10809052(501)
description "LS launch co.eclecticlight.Cormorant" ID:424-620-716
target: application.co.eclecticlight.Cormorant.10809046.10809052(501)
attributes: domain:"com.apple.launchservicesd" name:"LaunchRoleUserInteractive" sourceEnvironment:"(null)"

This marks the start of the launch process for Cormorant, handled in the normal way through LaunchServices and RunningBoard.

11:41:18.304367 Acquiring assertion targeting app application.co.eclecticlight.DelightEd.10206240.10206246(501)
description "LS launch co.eclecticlight.DelightEd" ID:424-620-756
target: application.co.eclecticlight.DelightEd.10206240.10206246(501)
attributes: domain:"com.apple.launchservicesd" name:"LaunchRoleUserInteractive" sourceEnvironment:"(null)"

This is the same for DelightEd.

11:41:20.050166 Acquiring assertion targeting [xpcservice com.apple.appkit.xpc.openAndSavePanelService([app application.co.eclecticlight.DelightEd.10206240.10206246(501) :1553])(501) 1576:1576]
description "viewBridge:1576" ID:424-391-769
target: 1576
attributes: domain:"com.apple.launchservicesd" name:"RoleViewBridge" sourceEnvironment:"(null)"

DelightEd is here being used to open a document using the openAndSavePanelService, a separate process.

11:41:44.171636 Acquiring assertion targeting app application.co.eclecticlight.Consolation3.430650.430692(501)
description "LS launch co.eclecticlight.Consolation3" ID:424-620-788
target: application.co.eclecticlight.Consolation3.430650.430692(501)
attributes: domain:"com.apple.launchservicesd" name:"LaunchRoleUserInteractive" sourceEnvironment:"(null)"

This is the launch of Consolation 3, a user error on this occasion!

Two long runs of assertions were discovered, both involving syncing the address book for Contacts.

11:41:57.462118 Acquiring assertion targeting [osservice com.apple.AddressBook.SourceSync(501):1610]
description "App is holding power assertion" ID:424-362-811
target: 1610
attributes: domain:"com.apple.appnap" name:"PowerAssertion" sourceEnvironment:"(null)", RBSAcquisitionCompletionAttribute policy:AfterApplication

The first of these was to sync the Address Book with its source in iCloud, and lasted 12.181 seconds.

11:42:11.840349 Acquiring assertion targeting [osservice com.apple.AddressBook.abd(501):1625]
description "Contacts shared filesystem lock" ID:424-1625-857
target: 1625
attributes: domain:"com.apple.common" name:"FinishTaskUninterruptable" sourceEnvironment:"(null)", RBSAcquisitionCompletionAttribute policy:AfterApplication

Shortly after that completed, synced data was updated by a service abd (Address Book Daemon?) that I had been unaware of. This only lasted 2.238 seconds.

RunningBoard’s assertions seldom appear for single-shot shell commands, and most commonly handle executable bundles rather than bare Mach-O binaries. They also don’t appear to provide clear information recording when apps are quit normally.

Conclusions

  • RunningBoard entries can readily provide accurate waypoints for many events in the log.
  • Establishing waypoints on the strength of RunningBoard log entries is straightforward in LogUI.
  • Job descriptions are readily found, and provide useful information on apps launched.
  • Extension overlays provide details of appexes that might otherwise be overlooked.
  • Acquisition of assertions identify various events in the app life cycle.
  • Once RunningBoard entries have provided precise times of events, attention can be focussed on obtaining more detail using short log extracts.

Last Week on My Mac: Search and you’ll find

One thing we humans are good at is searching. It’s a task we engage in from a few moments after birth until the time we slip away in death, we search everything around us. Locating and identifying that bird of prey wheeling high, finding the house keys, and that book we mislaid some time last week, meeting the perfect partner, discovering the right job, choosing the best education, looking through a Where’s Wally? or Where’s Waldo? book, and so on. Searching has transformed some into explorers like Christopher Columbus, and was the purpose of the chivalric quest. It’s what researchers in every field do, and thanks to Douglas Adams can be answered by the number 42.

Last week my searching took two new turns.

Spotlight

The first was more of a meta-search, in trying to discover more about the internals of Spotlight. Following the example of Maynard Handley, who has used them so successfully in understanding how M-series CPUs work, I looked through patents that have been awarded to Apple for the work of its search engineers. Yesterday’s slightly fuller history of Spotlight search is one result, and there are more to come in the future as I digest those patents concerned with performing search.

There’s a tinge of irony here, as many of my searches have been conducted using Google Patents, alongside Google Scholar one of the remaining search engines that doesn’t yet use AI and attempt to provide its own answers.

Logs

The other marks a new phase in my quest to get more information from the Unified log. Looking back to my first comment here, I realise how wildly over-optimistic I was when I wrote that it “should make my life a lot easier”, and that “a new version of Console will provide improved features to help us wade through logs.” Nine years later, I look wistfully at what remains of Console and realise how wrong I was on both counts.

When RunningBoard arrived in macOS Catalina, I soon noticed how “its log entries are profuse, detailed, and largely uncensored for privacy.” Since then it has proved garrulous to the point where its apparently ceaseless log chatter is a distraction, and can overwhelm attempts to read other log entries. I suspect it has contributed significantly to those advanced Mac users who now refuse to even try to make sense of the log.

One answer might be to tweak log preferences to shut out this noise, but given the purpose of RunningBoard in monitoring the life cycle of apps, why not try to use the information it provides? To do that, it’s first necessary to understand RunningBoard’s idiosyncratic language of assertions, and its protocols under which they’re acquired. The only way to do that without documentation is by observation: catalogue over 30 of those assertions for an interesting example like Apple’s Developer app, and see what they reveal.

By far the most informative entries from RunningBoard are those announcing that it’s acquiring an assertion, such as
Acquiring assertion targeting [app<application.developer.apple.wwdc-Release.9312198.9312203(501)>:2946] from originator [osservice<com.apple.uikitsystemapp(501)>:748] with description <RBSAssertionDescriptor| "com.apple.frontboard.after-life.subordinate" ID:424-748-2228 target:2946 attributes:[
<RBSDomainAttribute| domain:"com.apple.frontboard" name:"AfterLife-Subordinate" sourceEnvironment:"(null)">
]>

In a log often censored to the point of being unintelligible, this contains frank and explicit detail. The app is identified clearly, with the user ID of 501 and process ID of 2946. The originator is similarly identified as com.apple.uikitsystemapp with its PID of 748, which is confirmed in the middle digits in the Assertion ID. This is explicitly related to FrontBoard and an attribute named AfterLife-Subordinate. There’s not a single <private> to blight this entry, although further knowledge is needed to decode it fully.

Normally to get such information from a running process would require its source code to be instrumented with calls to write log entries, many of which would be lost to <private>, yet RunningBoard seems happy, for the moment, to provide that information freely. You can see what I mean by applying the predicate
subsystem == "com.apple.runningboard" AND message CONTAINS "Acquiring assertion t"
in LogUI, to obtain a running commentary on active apps and processes. Once you’ve identified a relevant assertion, you can focus attention on other log entries immediately prior to that. I will be following this up in the coming week, with fuller instructions and some demonstrations.

Although neither patents nor assertions have the significance of the number 42, in their own ways they show how the art and science of search aren’t dead yet, nor have they succumbed to AI.

Updates for file integrity (Dintch/Fintch), compression (Cormorant) and LogUI build 70

This is the last batch of ‘simple’ updates to my free apps to bring them up to the expectations of macOS 26 Tahoe. With them comes a minor update to my log browser LogUI, which is recommended for all using Tahoe, as it fixes an annoying if fundamentally cosmetic bug.

Preparing these updates for release was a little troublesome, as I attempted this using developer beta 3 of Tahoe and Xcode 26 beta 3. Little did I realise when I got all four rebuilt, tested and notarized, that this combination had stripped their shiny new Tahoe-compliant app icons. That made these new versions unusable in Sequoia and earlier, as they each displayed there with the generic app icon, despite working fine in Tahoe.

Eventually I discovered that I could build fully functional versions using Xcode 26 beta 2 in Sequoia 15.5, so that’s how they have been produced.

File integrity

Five years ago I build a suite of two apps and a command tool to enable checking the integrity of file data wherever it might be stored. This uses SHA256 hashes stored with each checked file as an extended attribute. At that time, the only alternative saved hashes to a file in the enclosing folder, which I considered to be suboptimal, as it required additional maintenance whenever files were moved or copied to another location. It made more sense to ensure that the hash travels with the file whose data integrity it verifies.

The three are Fintch, intended for use with single files and small collections, Dintch, for larger directories or whole volumes, and cintch, a command tool ideal for calling from your own scripts. As the latter has no interface beyond its options, it continues to work fine in macOS 26.

Since then other products have recognised the benefits of saving hashes as extended attributes, although some may now use SHA512 rather than SHA256 hashes. What may not be apparent is the disadvantage of that choice.

Checking the integrity of thousands of files and hundreds of GB of data is computationally intensive and takes a lot of time, even on fast M4 chips. It’s therefore essential to make that as efficient as possible. Although checksums would be much quicker than SHA256 hashes, they aren’t reliable enough to detect some changes in data. SHA algorithms have the valuable property of amplifying even small differences in data: changing a single bit in a 10 GB file results in a huge change in its SHA256 hash.

At the same time, the chances of ‘collisions’, in which two different files share the same hash, are extremely low. For SHA256, the probability that two arbitrary byte sequences share the same hash is one in 2^256, roughly one in 1.2 x 10^77. Using SHA512 changes that to one in 2^512, which is even more remote.

However, there ain’t no such thing as a free lunch, as going from SHA256 to SHA512 brings a substantial increase in the computational burden. When run on a Mac mini M4 Pro, using its internal SSD, SHA256 hashes are computed from files on disk at a speed of around 3 GB/s, but that falls to 1.8 GB/s when using SHA512 hashes instead.

dintchcheck14

Dintch provides two controls to optimise its performance: you can tune the size of its buffer to cope best with the combination of CPU and storage, and you can set it to run at one of three different QoS values. At its highest QoS, it will run preferentially on Apple silicon P cores for a best speed of 3 GB/s, while run at its lowest QoS it will be confined to the E cores for best energy economy, and a speed of around 0.6 GB/s for running long jobs unobtrusively in the background.

The two apps and cintch are mutually compatible, and with their earlier versions going back to macOS El Capitan. In more recent versions of macOS they use Apple’s CryptoKit for optimum performance.

Dintch version 1.8 is now available from here: dintch18
Fintch version 1.4 is now available from here: fintch14
and from their Product Page, from where you can also download cintch. Although they do use the auto-update mechanism, I fear that changes in WordPress locations may not allow this to work with earlier versions.

Compression/decompression

Although I recommend Keka as a general compression and decompression utility, I also have a simple little app that I use with folders and files I transfer using FileVault. This only uses AppleArchive LZFSE, and strips any quarantine extended attributes when decompressing. It’s one of my testbeds for examining core allocation in Apple silicon Macs, so has extensive controls over QoS and performance, and offers manual settings as well as three presets.

Cormorant version 1.6 is now available from here: cormorant16
and from its Product Page. Although it does use the auto-update mechanism, I fear that changes in WordPress locations may not allow this to work with version 1.5 and earlier.

LogUI

Those using this new lightweight log browser in Tahoe will have discovered that, despite SwiftUI automatically laying out its controls, their changed sizes in Tahoe makes a mess of the seconds setting for times. This new version corrects that, and should be easier to use.

LogUI version 1 build 70 is now available from here: logui170

There will now be a pause in updates for macOS Tahoe until Apple has restored backward compatibility of app icons, hopefully in the next beta-releases.

WWDC25 设计课程合集【中英字幕】

因为想了解苹果对 Liquid Glass 的定义和执行,以及对设计和开发的建议和约束,通过这些来进一步分析这套全新的设计语言究竟意味着什么,所以在翻看官方资料的过程中也顺便就把这些视频给翻译(用 AI 辅助)了。我集中上传到了自己的B站主页,为了方便其他人,我也在 blog 这里建立一个合集页面。

这六条并不是设计相关内容的全部视频,官方课程中还有其他视频,只是这六条是我自己比较关心的部分,和我后续的视频要分析的东西相关,因此挑选了这六条。如果你有其他关心的主题,可以前往以下官方页面寻找对应的内容。

https://developer.apple.com/videos/wwdc2025/

WWDC25新设计-01|了解新的设计系统 Get to know the new design system

深入了解新的设计系统,探索视觉设计、信息架构和核心系统组件的关键变化。了解该系统如何重塑界面与内容之间的关系,让您能够创建动态、和谐且跨设备、屏幕尺寸和输入模式一致的设计。

WWDC25新设计-02|认识液态玻璃 Meet Liquid Glass

Liquid Glass 统一了 Apple 平台的设计语言,同时提供了更具活力、更富表现力的用户体验。了解 Liquid Glass 的设计原理,探索其核心的光学和物理特性,并了解它的适用场景和使用原因。

WWDC25新设计-03|从创意到界面的设计基础 Design foundations from idea to interface

优秀的应用给人以清晰、直观、使用便捷的感觉。在本课程中,您将探索应用设计如何提升功能性、传达目标、引导用户浏览内容,以及如何巧妙地运用组件,在保持简洁体验的同时又不失影响力。本课程面向各种技能水平的设计师和开发者,以及所有对设计感兴趣的人士。

WWDC25新设计-04|设计交互式片段 Design interactive snippets

代码片段是由 App Intent 调用的紧凑视图,用于显示来自您 App 的信息。现在,代码片段可以让您的 App 为 Siri、Spotlight 和快捷指令 App 带来更多功能,方法是在 Intent 中包含按钮和状态信息,从而提供额外的交互性。在本课程中,您将学习设计代码片段的最佳实践,包括布局、排版、交互和 Intent 类型的指导。

WWDC25新设计-05|迎接应用图标的新外观 Say hello to the new look of app icons

概览 iOS、iPadOS 和 macOS 的全新 app 图标外观,包括明暗色调和清晰选项。学习如何运用雾面和半透明效果,让你的 app 图标更加鲜明、动感、富有表现力,以及如何确保你的图标与镜面高光完美契合。

WWDC25新设计-06|使用 Composer 创建图标 Create icons with Icon Composer

了解如何使用 Icon Composer 为 iOS、iPadOS、macOS 和 watchOS 制作更新的 app 图标。了解如何从您选择的设计工具中导出素材,将它们添加到 Icon Composer,应用实时玻璃属性和其他效果,以及如何预览并根据不同的平台和外观模式进行调整。

预言在应验:五年前所讨论的未来人机交互的新范式_6.ylog

从 2024 年的今天,回望 2019 年的 Apple 和 Ive 团队,我们会发现有些变化和趋势似乎是早已注定的。在过往的观察和分析中,我们所预言的事情正在成为现实和主流。常言道以史为镜可以知兴替,今天再看当时的 Apple 和 Ive 团队,关于产品的演进思路和设计策略的变化都早有端倪,也能预见在 AI 席卷的浪潮下,Apple 将会如何应对。

在这一期,你会听到:

—- 二十年前的专利文件:通体透光的 iPhone

—- 国产厂商和 Apple 在设计上的差异

—- 成功的设计:AirPods 只是剪掉线的 EarPods

—- 塑料手机的设计巅峰:iPhone 5c

—- 刘海与机器视觉:早早布局的 AI 伏笔

—- 未来十年的人机交互:人和人之间怎么交互?

—- 设计策略上的「S型曲线」体现在哪里?

—- 产品路径上迷路的 iPad

—- 光洁的划痕:是矫情还是哲学?

—- 史上最佳手机壳:iPhone 5c 的多彩硅胶壳

—- 拟物化的残党,现在理解扁平化的先进性了吗?

|相关图片|

首款 Unibody 设计于 2008 年 10 月发布
截图来自:Designed by Apple in California

查看更多图片和设计讨论:Mac Pro 2019

|拓展阅读|

如何评价 iPhone X 的工业设计?

交互的王,时代的狂!万字详解灵动岛的今生来世!

十年轮回?经典进化!工业设计师深入解读 iPhone12!

从技术寿命 S 曲线,看阳极氧化铝的设计

抽象的产品,用户「界面」的设计

如何看待 Evans Hankey 从 Apple 设计团队离职?

注定会离职的 Jonathan Ive 和科技产品的设计趋势

|登场人物|

苏志斌:工业设计师,车联网智能硬件产品经理 / 联创,《设以观复》作者

王汉洋:AI 行业从业者,多档播客主播,《拯救东北1910》《山有虎》作者

|相关链接|

若你所使用的播客客户端未能完整显示插图,或遇网络问题未能正常播放,请访问:

荒野楼阁 WildloG 的地址:https://suithink.me/zlink/podcast/

阅读设计相关的各类文章:https://suithink.me/zlink/idea/

|其他社交网络媒体|

苏志斌 @ 知乎|SUiTHiNK @ 即刻 / 微博

苏志斌SUiTHiNK @ Bilibili / YouTube / 小红书

|联络邮箱|

suithink.su@gmail.com

欢迎在 小宇宙、Spotify、YouTube、Apple Podcast 收听本节目,期待你的留言。

面向产品设计的 Web 前端分享会(分享会记录)

最近听说部门里面的产品或本地化运营对 Web 前端相关的内容比较感兴趣,正好我有相关的实践经验,所以在公司做了一个 Web 前端相关的分享会。分享内容包含:

  1. 使用 Devtools:介绍 Chrome 浏览器内的模拟、编辑和审查工具;
  2. 网页和部署:介绍 HTML, CSS, JavaScript, React,以及网站的部署和托管;
  3. 网页性能指标:介绍网页性能常用指标和测量工具;
  4. 资源分享:分享浏览器插件、网站和课程推荐。

与以往不同的是,这次分享会中加入了互动环节。我做了一个代码 Playground,尝试帮助观众了解 React,以及 React Props 的概念,并留了两个小任务,给观众尝试去实践对 React 项目进行编码。

完整的分享内容内容请继续浏览本文。

使用 Devtools

这个章节主要介绍 Chrome Devtools 一些可能不为人知的功能,来帮助我们提高日常工作中的效率和解决一些问题。先介绍 Devtool 里面「模拟」相关的功能。

模拟设备和屏幕尺寸

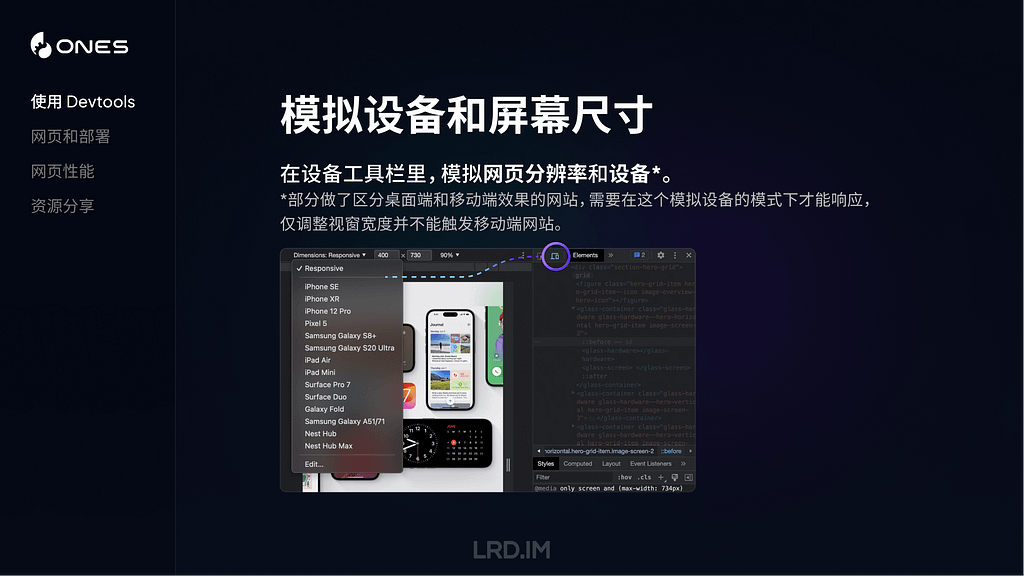
在 Devtool 里打开设备工具栏,在这里除了能够自由调整网页宽高,还能够模拟各种主流设备的屏幕。

甚至还能读取到网页里面的断点样式,提供快捷切换各种断点的方式。

需要注意的是,这里模拟的设备是会带上 UA 的,所以如果想在电脑里调试一些做了移动端特化处理的网站(比如访问主域名时,判断到是手机设备,则会跳到移动端的专门网站),是需要用到这个功能的。

模拟伪类

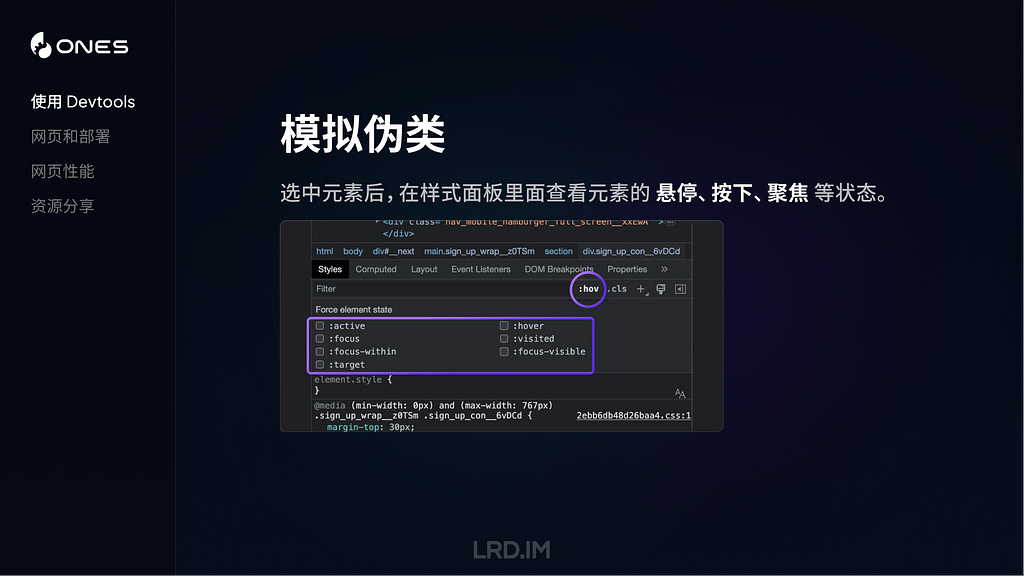
Devtools 还可以帮助我们排查各种交互状态下的样式问题,最常用的是,比如说我们想仔细排查某个元素的悬停和按下状态的样式,则可以在选中元素之后,勾选对应的伪类选项。

模拟媒体

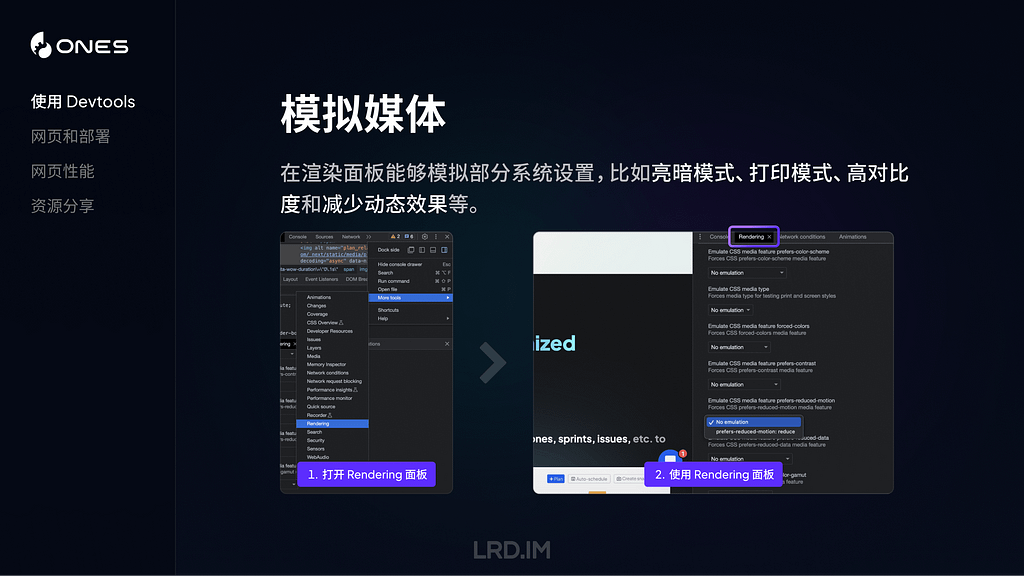
在渲染面板(需要手动开启,浏览器默认是没有打开这个面板的)能够模拟部分系统设置,比如亮暗模式、打印模式、高对比度和减少动态效果等。

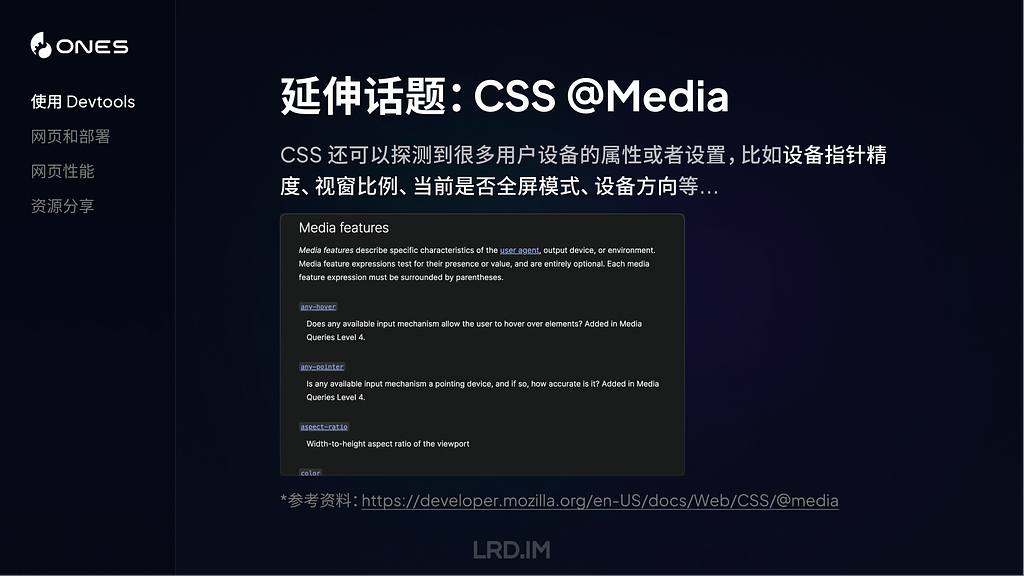
与之对应地,可以扩展一个概念叫做 CSS 的媒体查询,CSS 还可以探测到很多用户设备的属性或者设置,比如设备指针精度、视窗比例、当前是否全屏模式、设备方向等…

能探测的内容很多,但实际能用起来的可能只有寥寥数个,最全面的信息可以取 MDN 上查看。

编辑网页文字样式

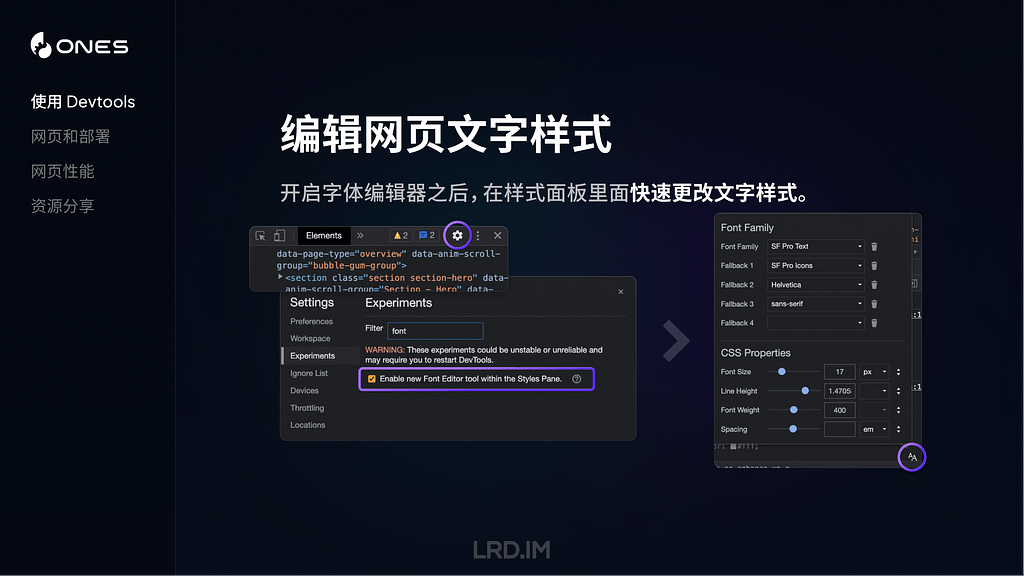
Devtools 还提供了一个新的字体编辑器,能够让我们实时更改网页中的字体家族、字体大小、字重等属性。

编辑网页内容

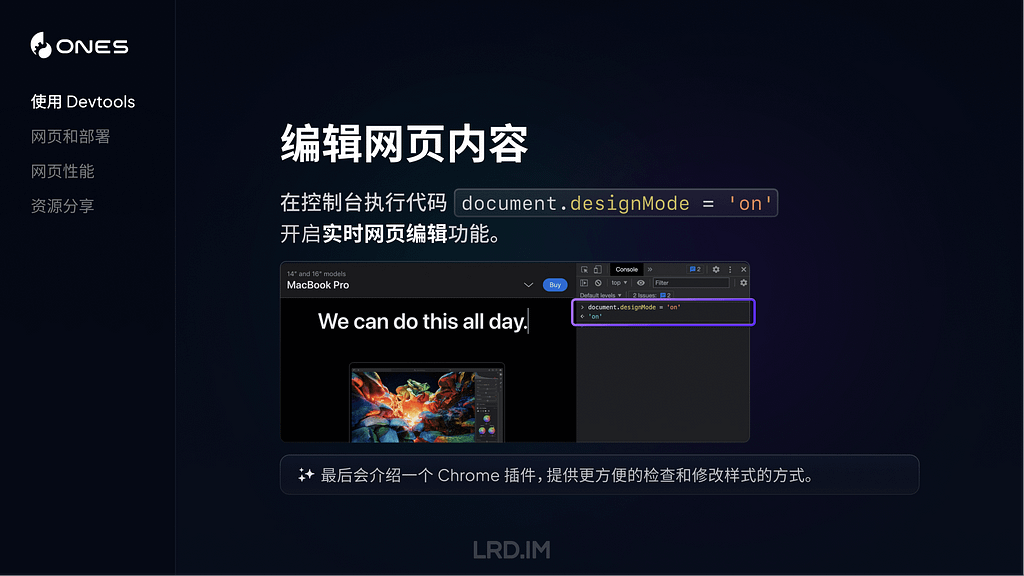
我们在 Devtools 控制台里面执行代码document.designMode = 'on' 后,就可以实时在本地修改网页文字内容了,就跟平常打字一样。很适合用在测试文案长度的场景。最后也会分享一个浏览器插件,能够对网页做更多的编辑。

审查 React 组件

最后介绍一个审查 React 组件的方法,有时候我们想看某个元素是不是用的组件库,或者这个组件包含了什么属性之类的,可以下载 React Developer Tools,然后点选网页中的任意元素,进行审查。

网页和部署

接下来我介绍一下网页构成和网站部署相关的内容。

通常来说,HTML, CSS, JavaScript 是构成网站的三个要素。其中:

  • HTML 用来用于定义网页的结构和内容,可以用来创建网站的各个部分,比如标题、段落、图片、链接等。
  • CSS 用来定义网页的样式和布局,这个可能会是咱们设计师比较熟悉的部分,我们能够利用 CSS 来定义 HTML 元素的各种样式,控制它们的布局和位置。
  • JavaScript 用来实现各种功能逻辑和操作交互。比如响应点击事件、动态修改网页内容,根据条件执行动画效果或展示特定内容等。

CSS 预处理器

上述的三种语言,都有各自对应的语法规则。而 CSS 预处理器,则改进了原有的 CSS 语法,使我们能使用更复杂的逻辑语法,比如使用变量、代码嵌套和继承等。

简单来说,CSS 预处理器能让我们写样式代码的过程更顺畅,使代码有更良好的可读性和扩展性,帮助我们更好地维护代码。

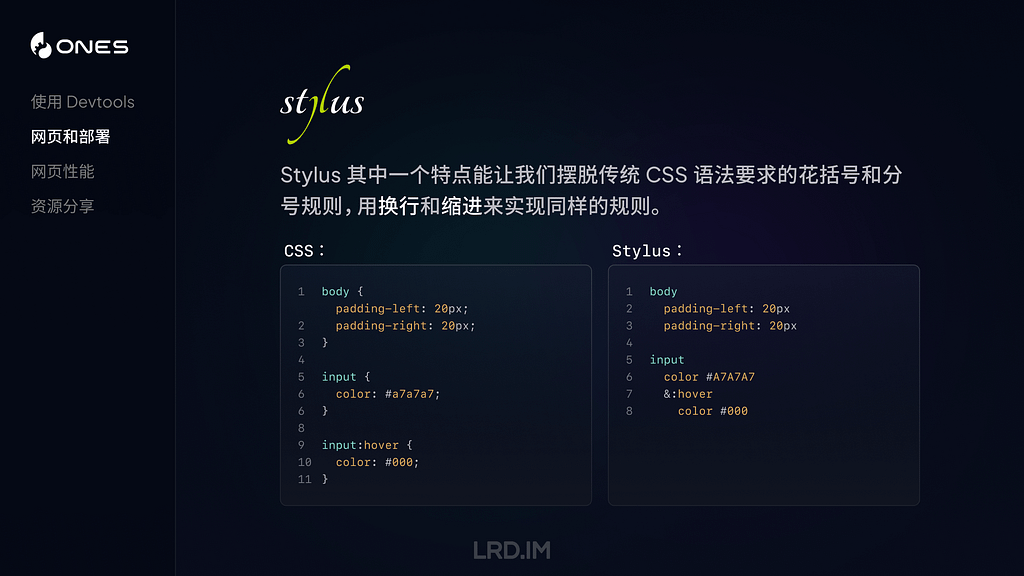
举个简单的例子,比如原本的 CSS 语法中要求我们给每一个元素写样式时,必须以花括号开始和结尾,而且每一条样式规则直接都要以分号隔开,而 Stylus 则能够让我们跳出这个限制。直接用换行和缩进来代替。

CSS 框架

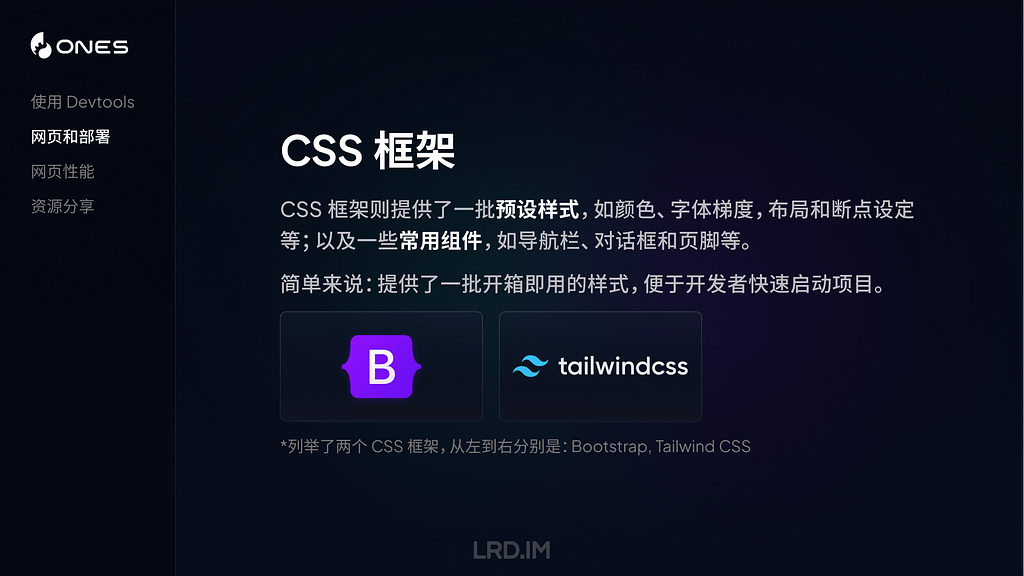
另一个值得一提的概念是 CSS 框架。CSS 框架则提供了一套预设样式,比如颜色板、字体梯度,布局和断点设定等;以及一些常用组件,如导航栏、对话框和页脚等。

简单来说,就是提供了一批开箱即用的样式,便于开发者快速启动项目,同时也会保留高度自定义的空间,用于支持各种各样的需求。通常 CSS 框架都会包含使用某个 CSS 预处理器,甚至内置了一些图标库,主打一个 “开箱即用”。

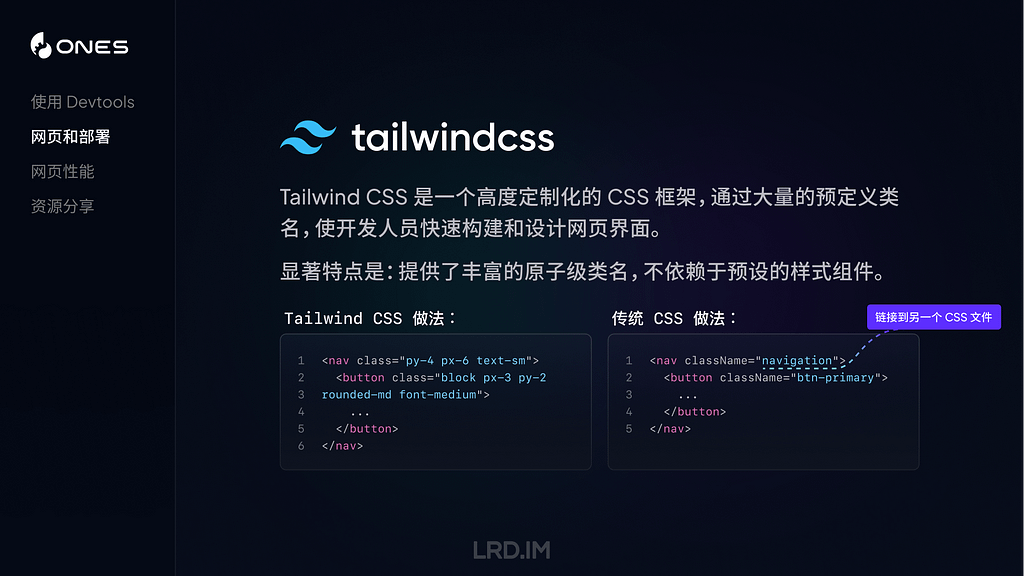
这里稍微介绍一下一个 CSS 框架:Tailwind CSS。是一个高度定制化的 CSS 框架,通过大量的预定义类名,使开发人员快速构建和设计网页界面。

与其他 CSS 框架相比,有一个显著的特点是 Tailwind CSS 本身不会包装一个组件出来,比如按钮、输入框的样式,没有预设好的。取而代之的是,Tailwind CSS 将各种原子级的 CSS 类名包装起来,比如:

  • 设置左右两边的 Padding,用 px-[...] 类名来实现;
  • 设置一个元素为块级元素, 用block 类名来实现…

如果想要在 TailwindCSS 中,使用打包好的组件,达到开箱即用的效果,可以通过各种官方/非官方的模版或组件生态来进行。比如:

React

接下来介绍另一个概念:React。这是一个用于构建 Web 和原生交互界面的库(是的,它能够用来做 App,不仅仅是网页)。而且引入了 JSX 语法,将 HTML 和 JS 结合起来,以一种更直观和易于理解的方式描述界面的结构和内容。

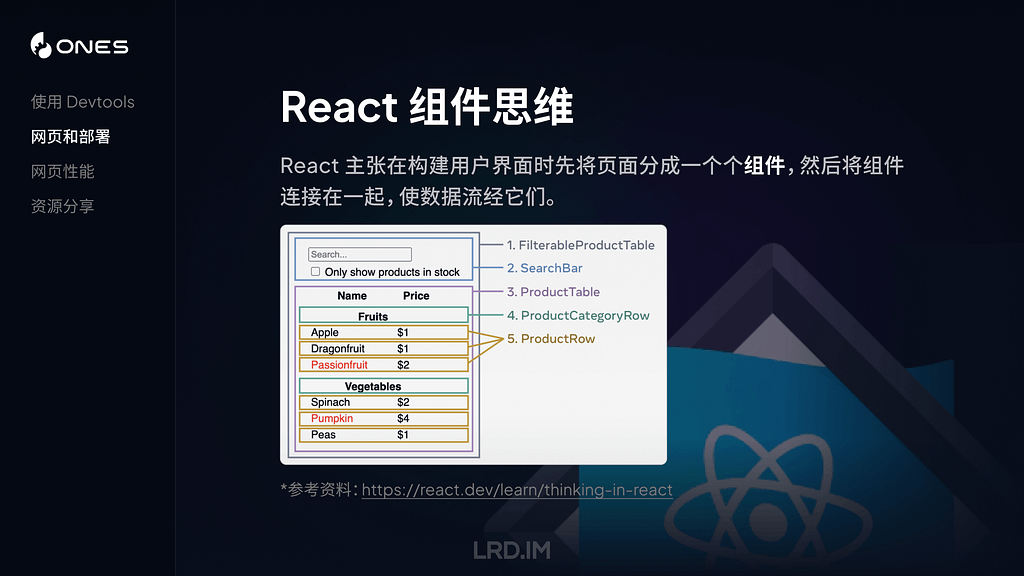
React 有一点和我们的设计稿很像,就是它的组件思维。在构建用户界面时,React 主张先把内容分解成一个个可以复用的组件(把具体的交互、功能逻辑写在组件里面)。然后在页面中将各个组件连接起来,使数据流经它们。

下图引用了官网中的一个例子,其中:

  1. 完整的应用,可以理解为由多个组件拼接成的完成网页;
  2. 搜索组件,用来获取用户输入;
  3. 数据列表,会根据用户搜索来过滤和展示内容;
  4. 每个列表的表头;
  5. 表格内每条数据。

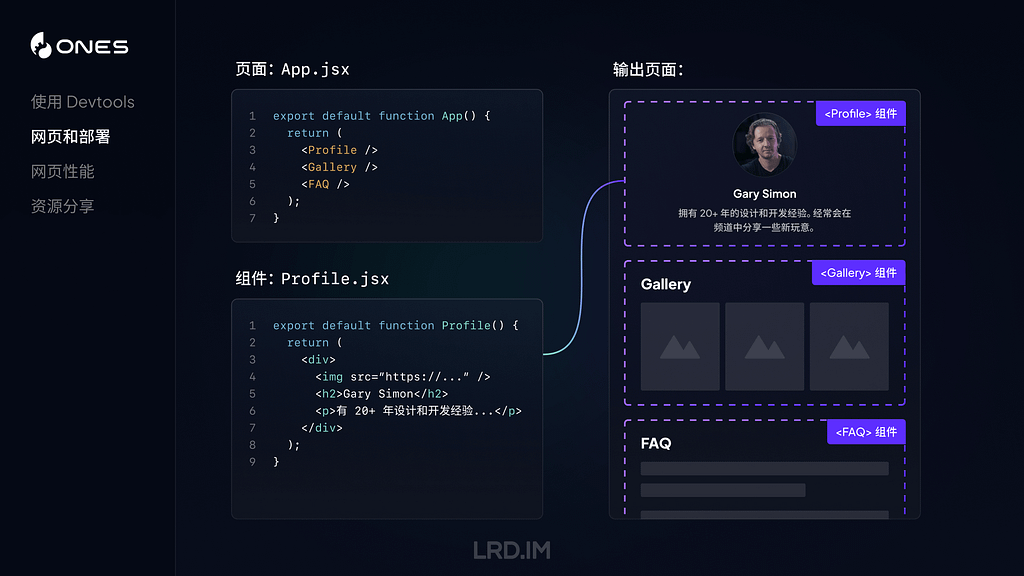
现在我们用一个具体例子来简单介绍下 React 的组件。

在上图中,展示了一个页面页面 App.jsx 包含了 Profile、Gallery 和 FAQ 组件,以及 Profile.jsx 组件的代码。右侧是输出页面,展示了三个组件拼接而成的页面效果示意图,其中 Profile 组件模块里展示的内容,是和 Profile.jsx 文件内代码一一对应的。

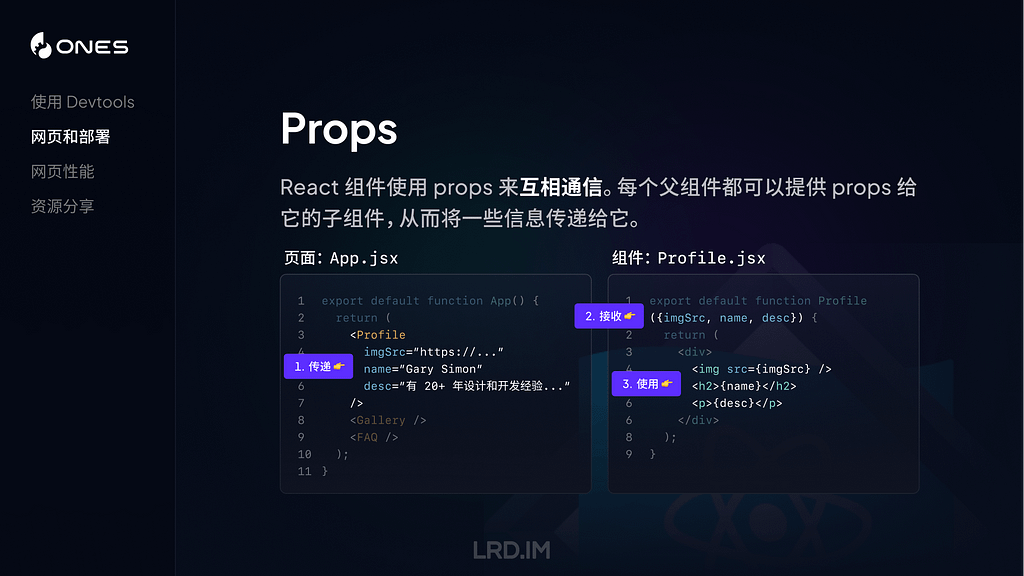
上述的组件只是将一个模块包装起来,使其能够被其他地方复用。但组件内容是固定的。接下来会为大家展示如何向组件传递 Props,实现上文提到的一句话 “使数据流经他们” 。

在上图中,我们先将一些 Props 传递给组件 Profile(比如这里传递了图片的地址、人物姓名和描述),然后在 Profile 组件内接收这些 Props,并在组件代码内使用这些数据。

现在,我们就做出了一个可以复用的组件了,可以根据不同的内容来展示相关的人物信息。

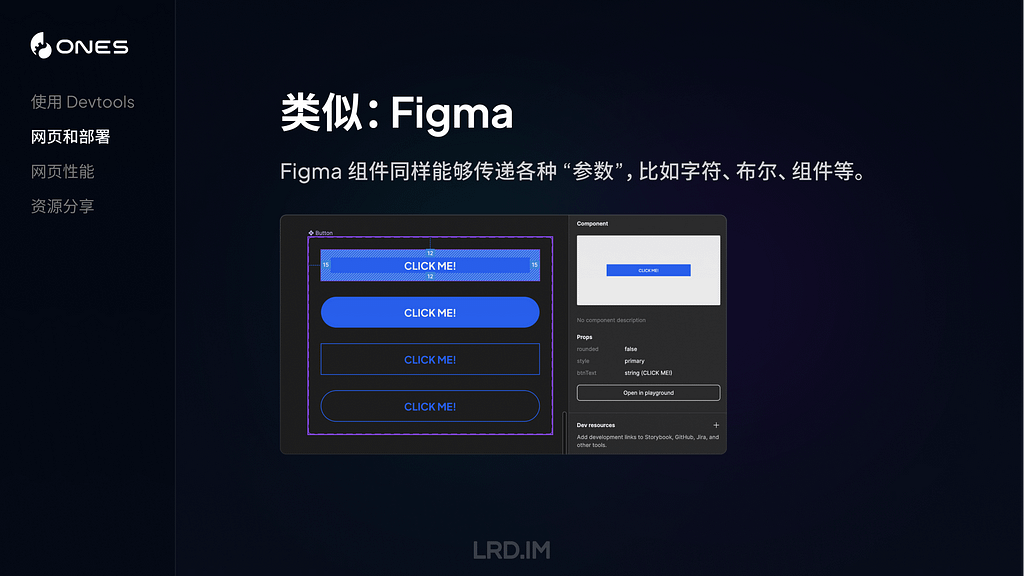
大家有没有觉得这种做法有点熟悉?是的,在 Figma 中,我们的组件里面也有类似的做法。Figma 组件同样同样传递字符串、布尔和组件等内容。

实际上 React 组件可以传递的参数不仅仅只是上面例子中的字符串和布尔值,还能传递数值、函数、对象、Node 类型甚至另一个组件等。

我做了一个简单的 Playground,提前封装好了一个 Profile 组件,会传递一些字符串、布尔值(是否展示网站标签)以及数值(圆角大小),帮助大家更好地理解。

🛝 Playground

我做了一个 🛝 Playground ,大家可以在里面看到这个组件的具体的情况,实际看一遍代码可能会帮助理解 React 的组建和 Props 概念。

同时我也写了两个小任务给到大家去尝试,大家可以在上面的编辑器中自由尝试。

发布网站

到了这里,相信大家对构建一个网站已经有了初步的认识,接下来我为大家介绍下如何将构建好的网站发布的互联网当中,能够真正地被世界各地的人们浏览。

方法一:部署到服务器

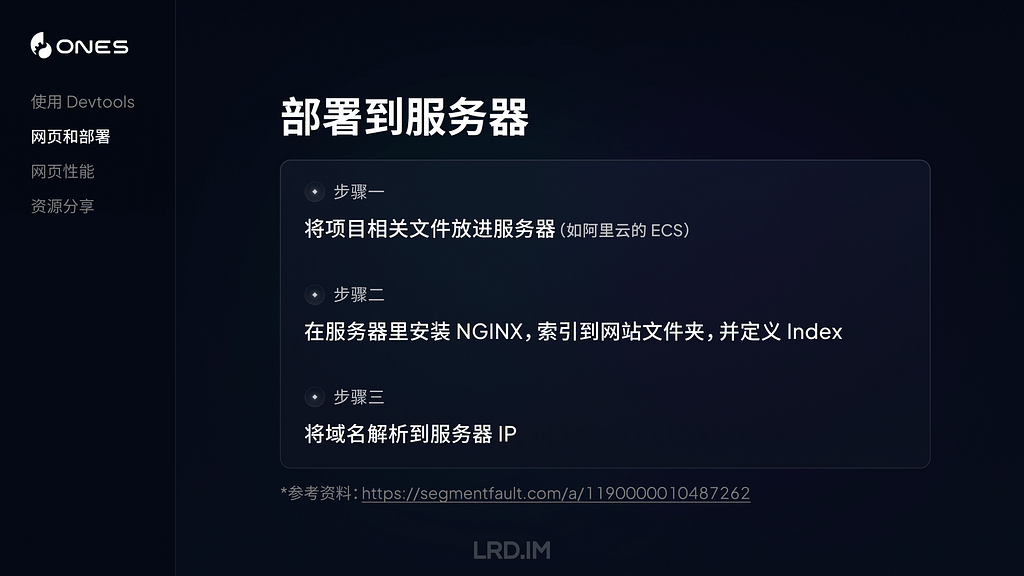
这是比较传统的方法,先将项目相关的文件放进服务器里面(比如阿里云 ECS,或轻量服务器等)。然后在服务器内安装 NGINX,索引到项目文件夹,定义好首页、端口、404 等场景,最后将域名解析到服务器 IP。之后我们的网站就能在互联网上被人们访问了。

方法二:托管到服务商

这种是相对省心的方法,将我们项目所在的 GitHub 仓库,链接到服务商的托管服务当中。等于是由服务商来帮我们部署、发布项目,不用自己来配置服务器的各种内容了。下图列举了几种常见的网站托管服务商,分别是:Vercel,Github Pages 和 Netlify。

以 Vercel 来举例,除了能够托管网站之外,对每一次发布进行管理,甚至能够是对不同代码分支进行独立发布,还能收集网站访问数据等。

网页性能

接下来为大家介绍网页性能相关的内容。通常一个网站性能好不好,我们能够在体验时主观地感受到,比如打开时很慢、滚动时卡顿,或者点击按钮后很久才响应等等。但如果要准确地判断到网页的性能到底如何,是需要依赖具体指标的。

下面介绍三个常用的指标,分别是:FCP(首次内容绘制)、LCP(最大内容绘制)以及 CLS(积累布局偏移)。

FCP(首次内容绘制)

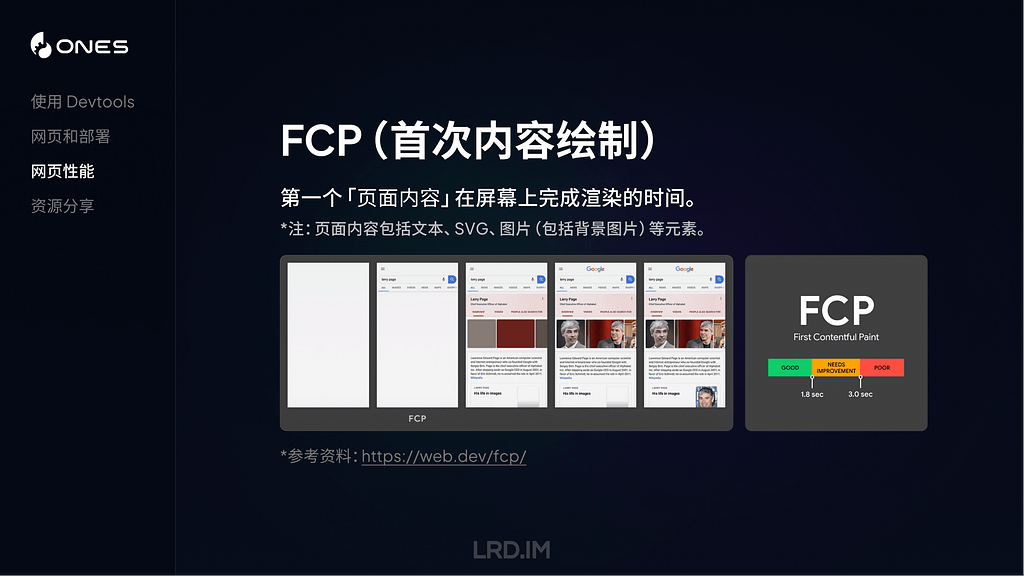
FCP 是一个关键指标,用来测量页面从开始加载到第一个页面内容在屏幕上完成渲染的时间。越快的 FCP 时间能够让用户感知到网页有在正常运行,而不是停滞、无响应。

这里提到的 “内容” ,指的是文本、图像(包括背景图像)、<svg>元素或非白色的<canvas>元素。如下图所示,FCP 出现在第二帧。

LCP(最大内容绘制)

LCP 指的从页面开始加载到可视区域内可见的「最大图像」或「文本块」完成渲染的时间。

这里提到的「最大图像」或「文本块」,具体来说是包含<img>元素、内嵌在<svg>元素内的<image>元素、块级文本等。

而测量方式,则是在页面加载过程中,记录视窗内的元素的渲染大小,取尺寸最大的元素,回溯这个元素被完整渲染的时间。注意,如果元素的有一部分在视窗外,在视窗外的部分不会参与到尺寸比较当中。

如下图所示,LCP 发生在第二帧,因为这个时候渲染尺寸最大的文本块被渲染出来了。后续帧当中,可能渲染出了一些图片,但尺寸都比文本块小,所以文本块依然是这个视窗内的最大元素。

CLS(积累布局偏移)

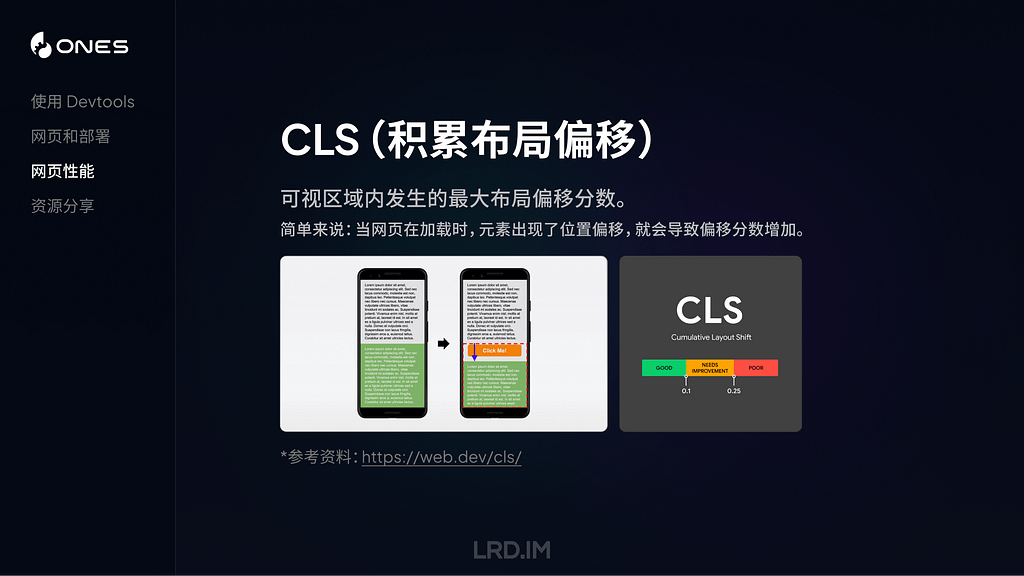
CLS 是指可视区域内发生的最大布局偏移分数。简单来说就是测量页面在加载时,元素的位置出现意外的偏移情况,如果元素尺寸大,而且位置偏移比较远,那么 CLS 分数就会显著增高。

这个指标会跟实际的用户操作或者体验有直接相关,所以应该也会是咱们设计师需要重点关注的内容,因为有时候布局偏移,是会比较影响用户获取信息、或者进行操作,甚至引发一些不可挽回的损失。

然后我来介绍一下测量网页性能的工具吧。我自己用过这两个,发现其实没啥差别,大家看喜好使用即可:

两个工具都能模拟桌面设备或者移动设备,记录多项关键指标的数据,并给出改进建议。

观察页面性能情况,不仅仅是前端技术人员要做的事情,了解到设计师也是可以参与到其中的。

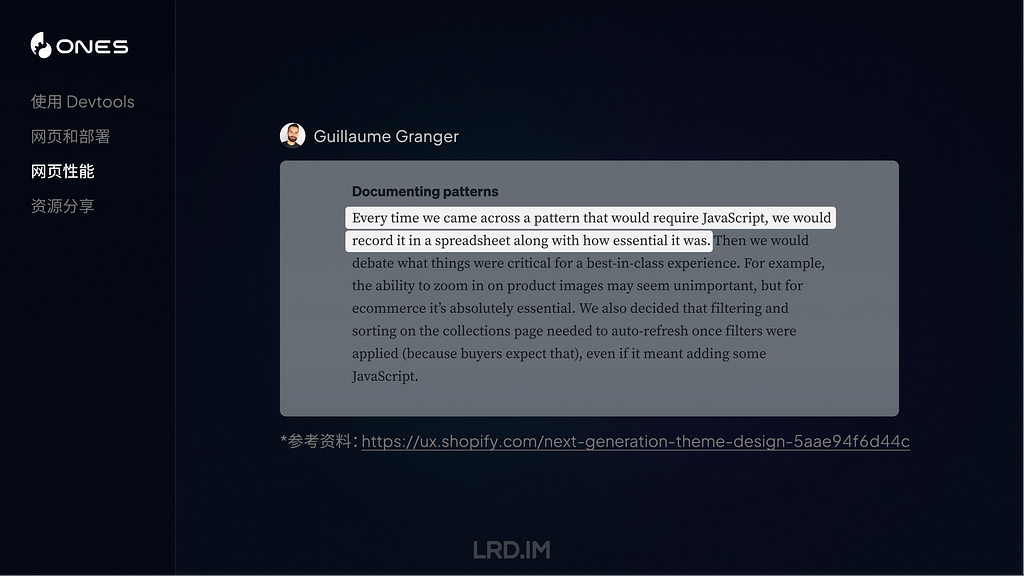
比如 Guillaume Granger,他会比较想控制页面中 JavaScript 的数量,所以它提到,他会将所有用了 JavaScript 相关信息记录在表格当中。之后每次在网页中使用 JavaScript 时,都会跟之前的记录进行比对,判断重要性,决定是否在这个位置上使用 JavaScript。

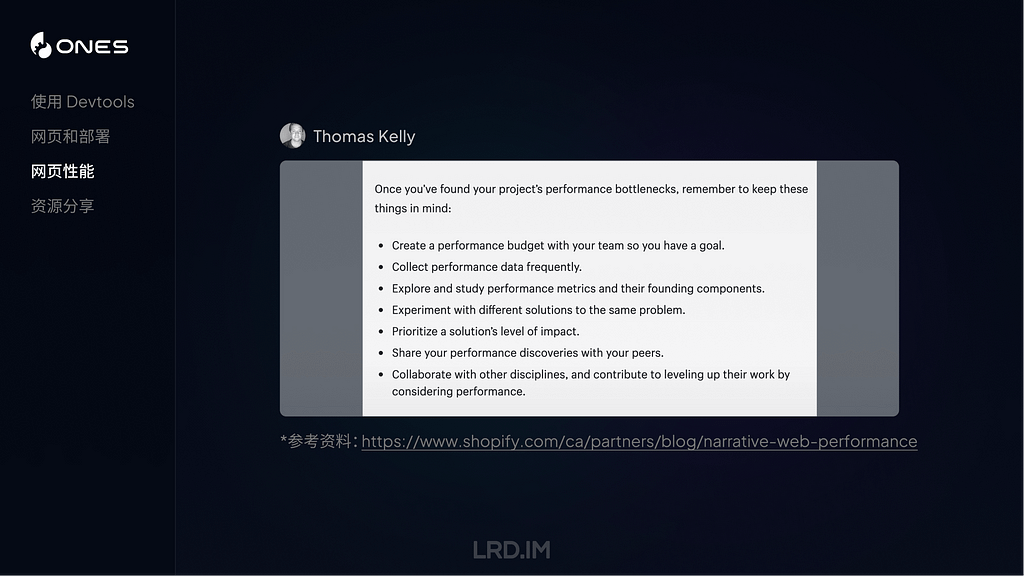
开发者 Thomas Kelly 则提出了当意识到页面性能出现瓶颈时,需要做的事情,比如:

  • 制定一个目标,团队一起往这个目标前进;
  • 高频收集页面性能数据;
  • 尝试用不同方式来解决同一个问题;
  • 与同伴分享对性能的一些新发现…

资源分享

最后来分享一下相关的资源吧,包含两个插件、三个学习网站以及一个 React 课程。

插件:VisBug

介绍一个谷歌官方出品的插件:VisBug,主要用来帮助用户在浏览网页时进行调试和设计,包括编辑和可视化页面的 CSS,尺寸和字体等元素。

插件:Motion DevTools

Motion DevTools 是一个检查网页动效的插件,可视化和分析用户交互设计中的滚动、动画效果,并支持实时编辑、预览或导出等功能。

网站推荐

接下来介绍三个在国内外拥有较高知名度和影响力的设计师和开发人员。他们的观点、经验分享往往能给我带来一些新的启发。尤其是他们对钻研新技术的热情,是非常强烈的。

课程推荐

最后强烈推荐一门 React 课程——The Joy of React,这个课程我在年初的文章也有提到过,是以互动式课程的形式,由浅入深地讲解 React。从基础的组件 props 和 JSX 知识,到 Hooks、API 设计等等,讲述非常清晰,强烈推荐。

分享会感想

分享完之后感觉效果可能还不错,大家都有各自的收获。而且分享会中也不时有人提出相关问题,我也一一进行解答了。

或者也有对我分享内容的一些补充,比如我在分享完 Devtools 环节的时候,有同事也分享了一个在 Application — Cookie 面板里快速切换网页语言的方法。

后面了解到大家对于 CSS 和 React 那块听的比较迷糊,因为原本没有实践过的话,会对这些没有什么概念。而且大家好像对 🛝Playground 没有什么兴趣,并没有人对里面的内容有什么提问和看法之类的,可能到这一步都比较迷糊?🤔

指标那块倒是有不少同事关心,问了几个问题,比如有哪些方法来去改进几个指标的数据,或者在设计过程中是否可以提前避免性能问题等等。

总体来说和之前的分享会相比,这次分享会的参与度比较不错。

MIUI稳定版12.0直升12.5开发版方法

从网络反馈来看,最新的 MIUI 12.5 无论是在系统流畅性上还是隐私保护上,都有非常明显的提升,我在升级之后的第一感受就是系统真的很流畅,比我上一个 MIUI 12.0.7 稳定版有非常大的提升。MIUI 12.5 虽然是测试版系统,但是稳定性和完成度上都很高,推荐大家都升级。关于 MIUI 12.5 的官方介绍页面:https://home.miui.com/MIUI 测试版系统的常规升级方法,是需要去官方申请内测或公测名额。但是现在官方内测和公测通道都已经关闭,想借用别人已经有权限的小米账号,又有隐私泄露的风险。这里就介绍一个非常规方法,也被很多人戏称为替换安装包的「偷渡法」。【方法及步骤简介】1、下载好可以升级的 MIUI 12.5 内测版安装包(A包);这是小米官方 MIUI 安装包的 GitHub 下载页面:https://github.com/mooseIre/

❌