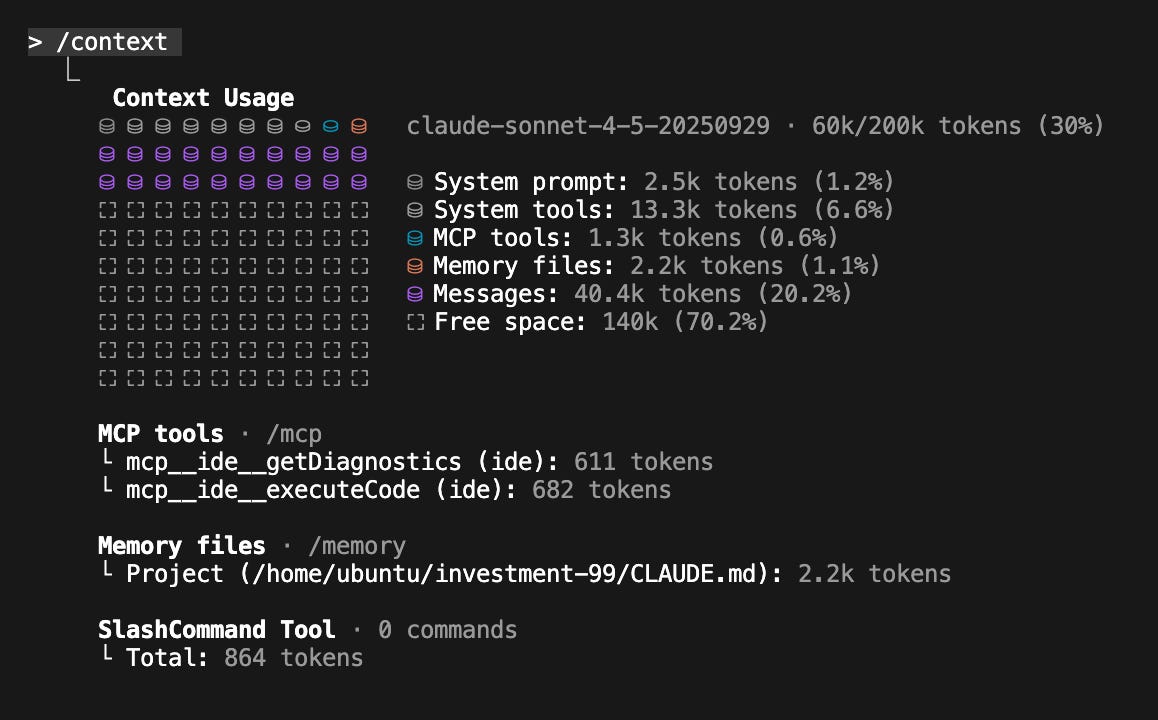
对于 Claude 应用用户来说,长对话不会再被打断了。Claude 会在需要的时候自动总结早期上下文,让对话持续下去。
Anthropic 研究产品管理负责人 Dianne Na Penn 在接受采访时表示:
「我们在 Opus 4.5 的训练过程中提升了对长上下文的整体处理能力,但光有更长的上下文窗口是不够的。知道哪些信息值得记住,同样非常关键。」
这些改进也实现了 Claude 用户长期呼吁的一项功能:「无尽对话」。这功能能够让付费用户在对话超过上下文窗口限制时也不会中断,模型会自动压缩上下文记忆,而不用提醒用户。
Claude for Chrome 也已经向所有 Max 用户开放了,可以让 Claude 直接在浏览器多个标签页之间执行任务。
Claude for Excel 的 Beta 测试范围已经扩展到 Max、Team 和 Enterprise 用户了。
对于能使用 Opus 4.5 的 Claude 和 Claude Code 用户,Anthropic 已经取消了和 Opus 相关的使用上限。
对于 Max 用户和 Team Premium 用户,Anthropic 也提高了整体使用限额,用户可使用的 Opus token 数量与之前使用 Sonnet 时大致相同。随着未来更强模型的出现,配额也会根据情况相应更新。
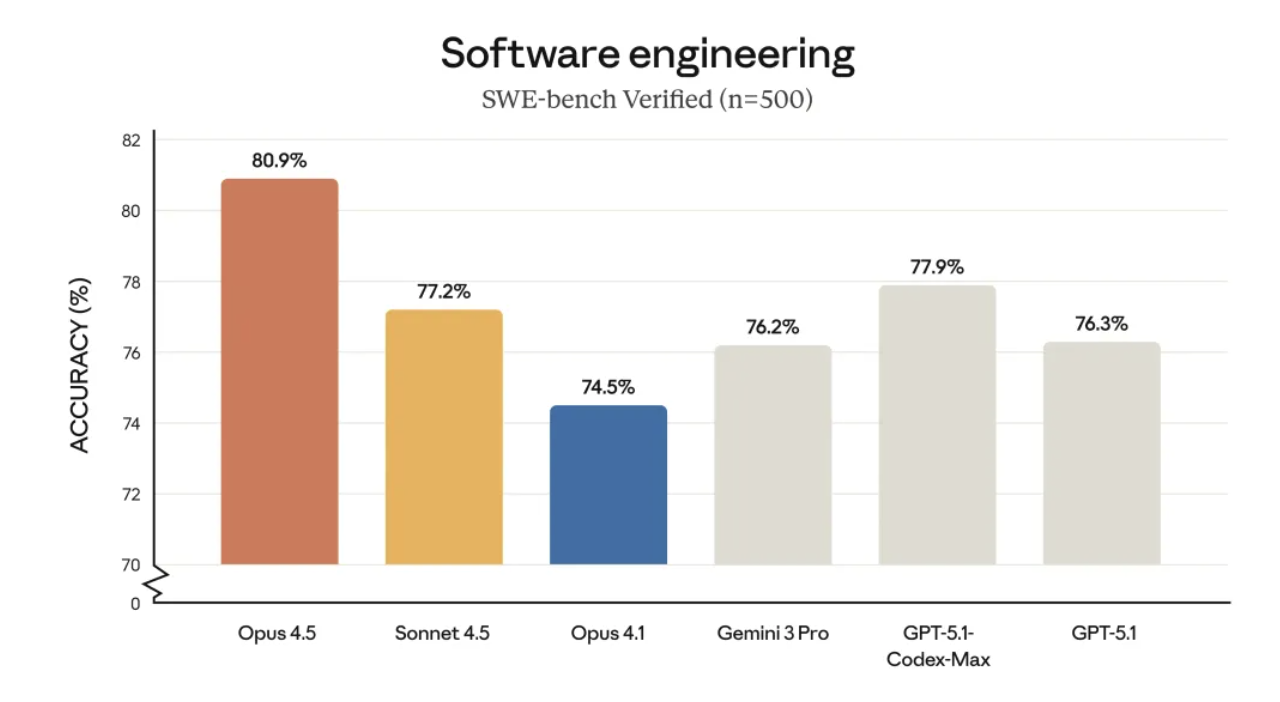
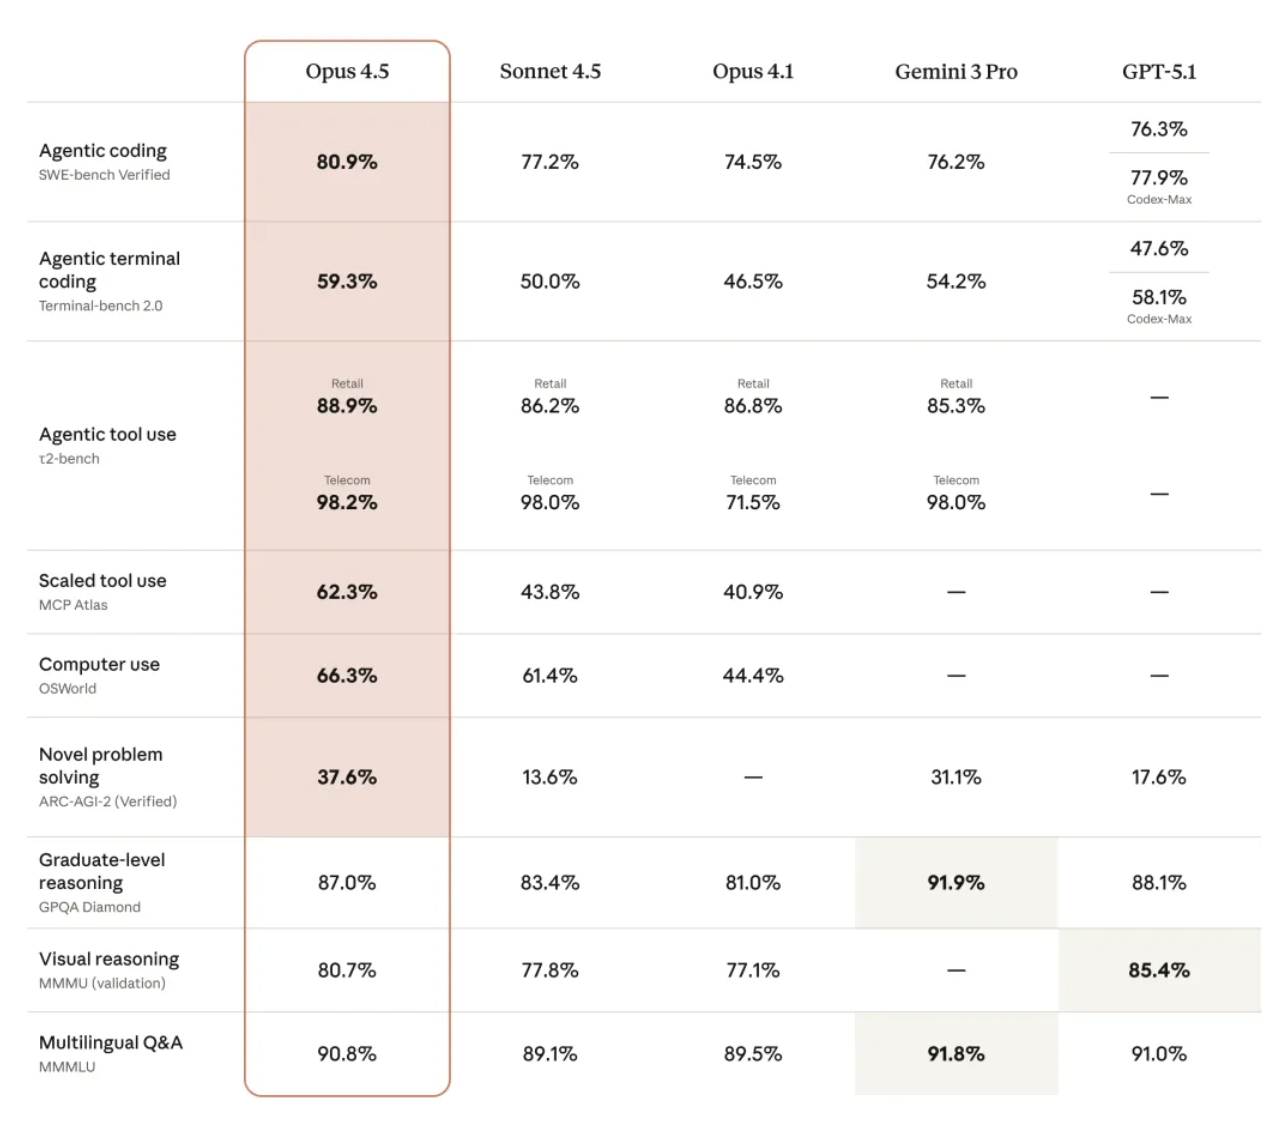
让模型「更聪明也更省」,Opus 4.5 迎来底层大升级
随着模型变得更聪明,它们能用更少的步骤解决问题:减少反复试错、降低冗余推理、缩短思考过程。
Claude Opus 4.5 和前代模型比,在实现相同甚至更优结果的情况下,用的 tokens 数量明显少了。
Diagnosing problems using the Unified log is a complicated business that requires understanding, insight, experience and a systematic approach. As few of us feel competent to wade through thousands of log entries trying to spot where things go wrong, this might seem an ideal opportunity for the use of AI. I’m very grateful to one of our regular readers for the opportunity to demonstrate how Claude coped with diagnosing a troublesome problem they’ve been having with the Clock app in Tahoe.
Signs and symptoms
When you’re diagnosing any problem, you should start with a clear account of its signs and symptoms before even thinking of resorting to the log. A good physician may take an hour or more obtaining a full history and examining a patient before they start thinking about performing any special investigations. Even though signs and symptoms may not lead you to a diagnosis, they should help you direct your investigations to best effect.
In this case, although the Clock app is launching, when displaying some views the content is missing. We therefore agreed to capture the log from the moment of launch from the Finder until one of the problematic views displayed. That’s easy to achieve by double-clicking the app when the menu bar clock has just turned to display 00 seconds, then checking the time again when the view has been displayed. Add a couple of seconds to the latter to determine the period to view in LogUI.
What’s normal?
Recognising what’s abnormal in the log is only possible if you know what the normal looks like. It’s often perfectly normal to see error messages, but knowing which are relevant is more difficult. In this case, I cheated and obtained a matching log extract from launching the Clock app on another Mac running the same version of Tahoe, making it simple to compare the two.
An interesting exercise for the reader is to submit a perfectly normal log extract to AI, with a vague description like “problems starting the app”, and seeing if it reports that as being normal. I doubt that it would.
Preparing a log extract for submission to AI
LogUI can provide log extracts saved to Rich Text Format, preserving the entry fields, although I doubt whether any AI will be able to interpret those correctly. Perhaps the best route is to save the extract in RTF, and save that in turn as plain text. A longer way round is to:
Save the whole extract as a JSON file, to preserve the whole record.
Use the Search tool to display the entries you want to submit for analysis.
Click on the Reduce tool to remove the unwanted entries.
Save the remaining entries in Rich Text, then save that in plain text format.
That also allows you to submit a shorter extract.
Claude’s report
AIs like Claude are thoroughly professional in their reporting, even when they’re utterly incorrect. In this case, Claude’s report is headed Complete Analysis of the Problem, and appears a confident and detailed assessment presented logically. It first establishes:
The App DOES Launch Successfully
Main Issue: Continuous Assertion Invalidation
Infinite State Loop
Critical Errors Identified
supporting those with digested “quotations” from the log, although in fact most of them are rendered in Claude’s words, not those in the log entries themselves.
It then leaps on to give the Final Diagnosis that the Clock app:
Fails to maintain the assertions necessary to remain active
The system continuously invalidates its resource requests.
Those are embellished with appropriate and emoji.
Following those conclusions, it cites what it terms Key Log Evidence in support of that diagnosis. Among those are the following.
Critical Error at Launch
For this, it quotes part of the message from 00.968273 error com.apple.runningboard [app[application.com.apple.clock.1152921500311884024.1152921500311884029(501)]:1921] Memorystatus failed with unexpected error: Invalid argument (22)
and a similar entry.
However, it doesn’t point out that those are rapidly followed by 00.969966 com.apple.runningboard [app[application.com.apple.clock.1152921500311884024.1152921500311884029(501)]:1921] set Memory Limits to Soft Inactive (800)
00.970684 com.apple.launchservices LAUNCH: Successful launched 0x0-0x3b03b pid=1921 com.apple.clock '[private]'
which would appear to contradict this being a “critical error”.
Kernel Warning
Claude’s report next misquotes one of the log entries as reporting Clock[19237] triggered unmask of range (1 of 16384:0000->0x1ce000000 of DVLD shared region in VM map 0x5c946dd8d4c72dbbf
when in fact the full entry reads 10.891949 kernel Clock[19237] triggered unnest of range 0x1e8000000->0x1ea000000 of DYLD shared region in VM map 0x5c946da0d472dbbf. While not abnormal for debuggers, this increases system memory footprint until the target exits.
It gives no reason for changing unnest to unmask,DYLD (which makes sense) to DVLD (which is nonsense), or changing the range given.
For interest, I used LogUI’s Gloss feature to submit that entry to ChatGPT for its explanation: This log entry is a system notice from the kernel indicating that a portion of the DYLD shared region in the virtual memory (VM) map has been unnested. […] In short: The macOS kernel is reporting that the process Clock caused a part of the shared dynamic library cache to become private memory. This is expected behaviour when certain debugging or memory operations occur, but it will temporarily use more RAM until the process exits.
Continuous Assertion Cycle and Scene Management Loop
Claude then claims that the perfectly normal entries made by RunningBoard and FrontBoard demonstrate a continuous assertion cycle and scene management loop. Anyone who has read my account of RunningBoard would realise that is a misreading of what is both common and normal.
Claude’s Possible Solutions
Nearing the end of the report, Claude recommends four possible solutions:
Reset system permissions: sudo tccutil reset All com.apple.clock
Rebuild launch services cache: /System/Library/Frameworks/CoreServices.framework/Frameworks/LaunchServices.framework/Support/lsregister -kill -r -domain local -domain system -domain user
Verify system integrity: sudo /usr/libexec/repair_packages --verify --standard-pkgs
If everything fails: This could be a specific bug in macOS Tahoe with the Clock app that requires a system update.
The first is misleading, as TCC has nothing to do with system permissions, but privacy controls. Although Claude has made no comments at all on entries by TCC, I have checked through those thoroughly and there’s no evidence of any problem with that subsystem. The command recommended isn’t likely to do anything useful, either.
Despite Claude having provided no evidence of any problem with LaunchServices, its second solution is to perform a full reset of the LaunchServices registry (not cache), although I’m not sure the command given is correct for that. This used to be a popular panacea in the past, but is now more trouble than it’s likely to be worth. The last time I reviewed this for Sequoia, I wrote:
“Running either of those in recent versions of macOS including Sequoia is likely to wreak havoc, though. While this appears to be effective with the Open With… list, its effects on System Settings can be catastrophic. This can remove its entire contents, and even blow the wallpaper away. Normal function should start to return after restarting the Mac, but even then problems can persist.”
Yet Claude gives no warnings of any adverse effects.
The third solution given is the most puzzling. repair_packages was used to repair System permissions in versions of macOS up to El Capitan. It hasn’t been used since, makes no sense at all in Tahoe with SIP and the SSV, and that command no longer exists anyway. I find it surprising that Claude should be recommending a course of action from ten years ago.
The final recommendation is manifestly ineffective, as this problem has persisted across updates from 26.0 to 26.0.1 and now 26.1.
Nowhere does Claude recommend the obvious course of action to contact Apple Support.
Claude’s Summary
The slick summary rounding off Claude’s Complete Analysis of the Problem states confidently that its root cause “appears to be either:”
“A system-level bug in macOS Tahoe’s memory status handling for this specific app”
“Corruption in the app’s entitlements or sandbox configuration”
“A conflict between the app’s resource requirements and what the system is willing to grant”
with the parting comment: The error code 22 (EINVAL – Invalid argument) in the memorystatus call suggests the app is requesting memory limits or priority settings that the kernel considers invalid for its configuration.
None of those comments is supported in reality, nor by the evidence in the log extract.
My final test was to compare the log entries that Claude singled out as being diagnostic of the problem it has ‘completely analysed’, with those from my Mac mini M4 Pro, whose Clock app works perfectly. You won’t be surprised to learn that, in those respects at least, the two logs are identical. For the avoidance of doubt, that includes the “Kernel Warning” and “Critical Error at Launch” entries that Claude considered diagnostic.
My Summary
When presented with a log extract, Claude misidentified and misread log entries, and introduced errors in reporting what it claimed were the most important diagnostic entries. Its recommended solutions were ineffective, unwise, or a decade out of date. Neither did it give any warnings for their adverse effects, or recommend contacting Apple Support.
This doesn’t say that AI can’t help interpret macOS Unified log entries, and can’t do better in the future. But I hope it demonstrates the reality of what it will do today.
Postscript
Following up on Claude’s suggested solutions, I can confirm that the suggested tccutil command is ineffective, and that Tahoe has removed the -kill option from lsregister “because it was dangerous and no longer useful”. As the third solution was removed years ago, that leaves only the last of its suggestions that is valid.
Anthropic 的内部团队正在利用 Claude Code 彻底改变他们的工作流程。无论是开发者还是非技术人员,都能借助它攻克复杂项目、实现任务自动化,并弥补那些曾经限制生产力的技能鸿沟。
为了深入了解,我们采访了以下团队:
通过这些访谈,我们收集了不同部门使用 Claude Code 的方式、它对工作带来的影响,以及为其他考虑采用该工具的组织提供的宝贵建议。
数据基础设施团队负责为公司内所有团队整理业务数据。他们使用 Claude Code 来自动化常规的数据工程任务、解决复杂的基础设施问题,并为技术和非技术团队成员创建文档化工作流,以便他们能够独立访问和操作数据。
利用截图调试 Kubernetes
当 Kubernetes 集群出现故障,无法调度新的 pod 时,团队使用 Claude Code 来诊断问题。他们将仪表盘的截图喂给 Claude Code,后者引导他们逐个菜单地浏览 Google Cloud 的用户界面,直到找到一个警告,指出 pod 的 IP 地址已耗尽。随后,Claude Code 提供了创建新 IP 池并将其添加到集群的确切命令,整个过程无需网络专家的介入。
为财务团队打造纯文本工作流
工程师向财务团队成员展示了如何编写描述其数据工作流程的纯文本文件,然后将这些文件加载到 Claude Code 中,以实现完全自动化的执行。没有任何编程经验的员工只需描述“查询这个仪表盘,获取信息,运行这些查询,生成 Excel 输出”等步骤,Claude Code 就能执行整个工作流,甚至会主动询问日期等必要输入。
为新员工提供代码库导览
当新的数据科学家加入团队时,他们会被指导使用 Claude Code 来熟悉庞大的代码库。Claude Code 会阅读他们的 Claude.md 文件(文档),识别特定任务所需的相关文件,解释数据管道的依赖关系,并帮助新人理解哪些上游数据源为仪表盘提供数据。这取代了传统的数据目录和发现工具。
会话结束时自动更新文档
在每项任务结束时,团队会要求 Claude Code 总结已完成的工作并提出改进建议。这创建了一个持续改进的循环:Claude Code 根据实际使用情况帮助优化 Claude.md 文档和工作流指令,使后续的迭代更加高效。
跨多个实例并行管理任务
在处理耗时较长的数据任务时,团队会为不同项目在不同的代码仓库中打开多个 Claude Code 实例。每个实例都能保持完整的上下文,因此即使在数小时或数天后切换回来,Claude Code 也能准确地记住他们当时正在做什么以及任务进行到哪里,从而实现了无上下文丢失的真正并行工作流管理。
无需专业知识即可解决基础设施问题
解决了通常需要系统或网络团队成员介入的 Kubernetes 集群问题,利用 Claude Code 诊断问题并提供精确的修复方案。
加速新员工上手
新的数据分析师和团队成员无需大量指导,就能迅速理解复杂的系统并做出有意义的贡献。
增强支持工作流
Claude Code 能够处理比人类手动审查大得多的数据量,并识别异常情况(例如监控 200 个仪表盘),这是人力无法完成的。
他们建议使用 MCP 服务器而不是 BigQuery 命令行界面,以便更好地控制 Claude Code 的访问权限,尤其是在处理需要日志记录或存在潜在隐私问题的敏感数据时。
分享团队使用心得
团队举办了分享会,成员们互相演示他们使用 Claude Code 的工作流程。这有助于传播最佳实践,并展示了他们自己可能没有发现的各种工具使用方法。
Claude Code 产品开发团队使用自家的产品来为 Claude Code 构建更新,扩展产品的企业级功能和 AI 智能体循环功能。
通过“自动接受模式”快速构建原型
工程师们通过启用“自动接受模式”(Shift+Tab)并设置自主循环,让 Claude 编写代码、运行测试并持续迭代,从而实现快速原型开发。他们将自己不熟悉的抽象问题交给 Claude,让它自主工作,然后在接手进行最后润色前,审查已完成 80% 的解决方案。团队建议从一个干净的 git 状态开始,并定期提交检查点,这样如果 Claude 跑偏了,他们可以轻松回滚任何不正确的更改。
同步编码开发核心功能
对于涉及应用程序业务逻辑的更关键功能,团队会与 Claude Code 同步工作,提供带有具体实现指令的详细提示。他们实时监控过程,确保代码质量、风格指南合规性和正确的架构,同时让 Claude 处理重复的编码工作。
构建 Vim 模式
他们最成功的异步项目之一是为 Claude Code 实现 Vim 快捷键绑定。他们要求 Claude 构建整个功能,最终实现中大约 70% 的代码来自 Claude 的自主工作,只需几次迭代即可完成。
生成测试和修复 bug
在实现功能后,团队使用 Claude Code 编写全面的测试,并处理在代码审查中发现的简单 bug。他们还使用 GitHub Actions 让 Claude 自动处理像格式问题或函数重命名这样的 Pull Request 评论。
代码库探索
在处理不熟悉的代码库(如 monorepo 或 API 端)时,团队使用 Claude Code 来快速理解系统的工作方式。他们不再等待 Slack 上的回复,而是直接向 Claude 提问以获取解释和代码参考,从而大大节省了上下文切换的时间。
更快的功能实现
Claude Code 成功实现了像 Vim 模式这样的复杂功能,其中 70% 的代码由 Claude 自主编写。
尽管对“JavaScript 和 TypeScript 知之甚少”,团队仍使用 Claude Code 构建了完整的 React 应用,用于可视化强化学习(RL)模型的性能和训练数据。他们让 Claude 控制从头开始编写完整的应用程序,比如一个 5000 行的 TypeScript 应用,而无需自己理解代码。这一点至关重要,因为可视化应用相对上下文较少,不需要理解整个 monorepo,从而可以快速构建原型工具,以便在训练和评估期间了解模型性能。
处理重复的重构任务
当遇到合并冲突或半复杂的文件重构时——这些任务对于编辑器宏来说太复杂,但又不足以投入大量开发精力——他们就像玩“老虎机”一样使用 Claude Code:提交当前状态,让 Claude 自主工作 30 分钟,然后要么接受解决方案,要么在不成功时重新开始。
创建持久性分析工具而非一次性笔记本
团队现在不再构建用完即弃的 Jupyter 笔记本,而是让 Claude 构建可重复使用的 React 仪表盘,这些仪表盘可以在未来的模型评估中重复使用。这很重要,因为理解 Claude 的性能是“团队最重要的事情之一”——他们需要了解模型在训练和评估期间的表现,而这“实际上并非易事,简单的工具无法从观察一个数字上升中获得太多信号”。
零依赖任务委托
对于完全不熟悉的代码库或语言中的任务,他们将整个实现委托给 Claude Code,利用其从 monorepo 中收集上下文并执行任务的能力,而无需他们参与实际的编码过程。这使得他们在自己专业领域之外也能保持生产力,而不是花时间学习新技术。
在让 Claude 工作之前保存你的状态,让它运行 30 分钟,然后要么接受结果,要么重新开始,而不是试图费力去修正。重新开始的成功率通常比试图修复 Claude 的错误要高。
必要时为了简化而打断它
在监督过程中,不要犹豫,停下来问 Claude “你为什么这么做?试试更简单的方法。” 模型默认倾向于更复杂的解决方案,但对于简化方法的请求反应良好。
产品工程团队致力于开发如 PDF 支持、引用和网页搜索等功能,这些功能将额外的知识引入 Claude 的上下文窗口。在大型、复杂的代码库中工作意味着不断遇到不熟悉的代码部分,花费大量时间来理解特定任务需要检查哪些文件,并在进行更改前建立上下文。Claude Code 通过充当向导,帮助他们理解系统架构、识别相关文件并解释复杂的交互,从而改善了这种体验。
第一步工作流规划
团队将 Claude Code 作为任何任务的“第一站”,要求它确定在进行 bug 修复、功能开发或分析时需要检查哪些文件。这取代了传统上在开始工作前手动浏览代码库和收集上下文的耗时过程。
跨代码库独立调试
团队现在有信心处理不熟悉代码库部分的 bug,而无需向他人求助。他们可以问 Claude “你觉得你能修复这个 bug 吗?我看到的行为是这样的”,并经常能立即取得进展,这在以前由于所需的时间投入是不可行的。
通过内部测试进行模型迭代测试
Claude Code 自动使用最新的研究模型快照,使其成为他们体验模型变化的主要方式。这为团队在开发周期中提供了关于模型行为变化的直接反馈,这是他们在之前的发布中从未体验过的。
消除上下文切换的开销
他们不再需要复制粘贴代码片段并将文件拖入 Claude.ai,同时还要详细解释问题,现在可以直接在 Claude Code 中提问,无需额外的上下文收集,从而显著减少了心智负担。
增强了处理不熟悉领域的信心
团队成员可以独立调试 bug 并调查不熟悉代码库中的事故。
在上下文收集中节省了大量时间
Claude Code 消除了复制粘贴代码片段和将文件拖入 Claude.ai 的开销,减轻了心智上的上下文切换负担。
加速轮岗员工上手速度
轮岗到新团队的工程师可以快速熟悉不熟悉的代码库并做出有意义的贡献,而无需与同事进行大量咨询。
提升开发者幸福感
团队报告称,随着日常工作流程中的摩擦减少,他们感到更快乐、更高效。
将其视为迭代伙伴,而非一次性解决方案
不要指望 Claude 能立即解决问题,而是把它当作一个与你一起迭代的合作者。这种方法比试图在第一次尝试中就获得完美的解决方案效果更好。


 and
and  emoji.