Reading view

There are new articles available, click to refresh the page.

How long does the log keep entries?

One of the most contentious questions arising from yesterday’s critical examination of ChatGPT’s recommendations, is how long does the Unified log keep entries before they’re purged? ChatGPT seemed confident that some at least can be retained for more than a month, even as long as a year. Can they?

Traditional text logs are removed after a fixed period of time. One popular method is to archive the past day’s log in the early hours of each morning, as part of routine housekeeping. Those daily archives are then kept for several days before being deleted during housekeeping. That’s far too simple and restrictive for the Mac’s Unified log.

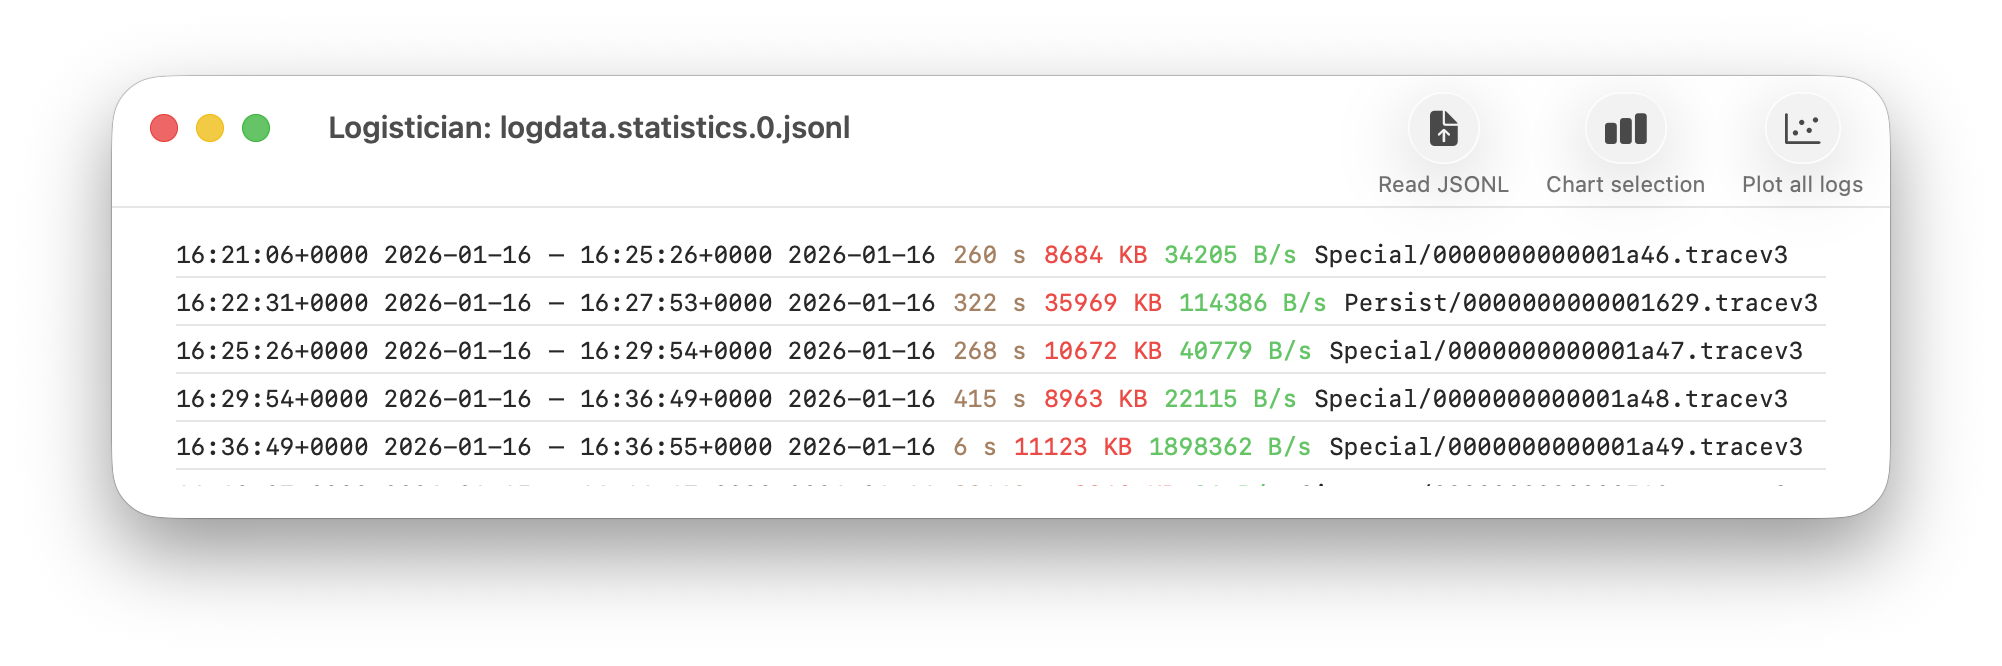
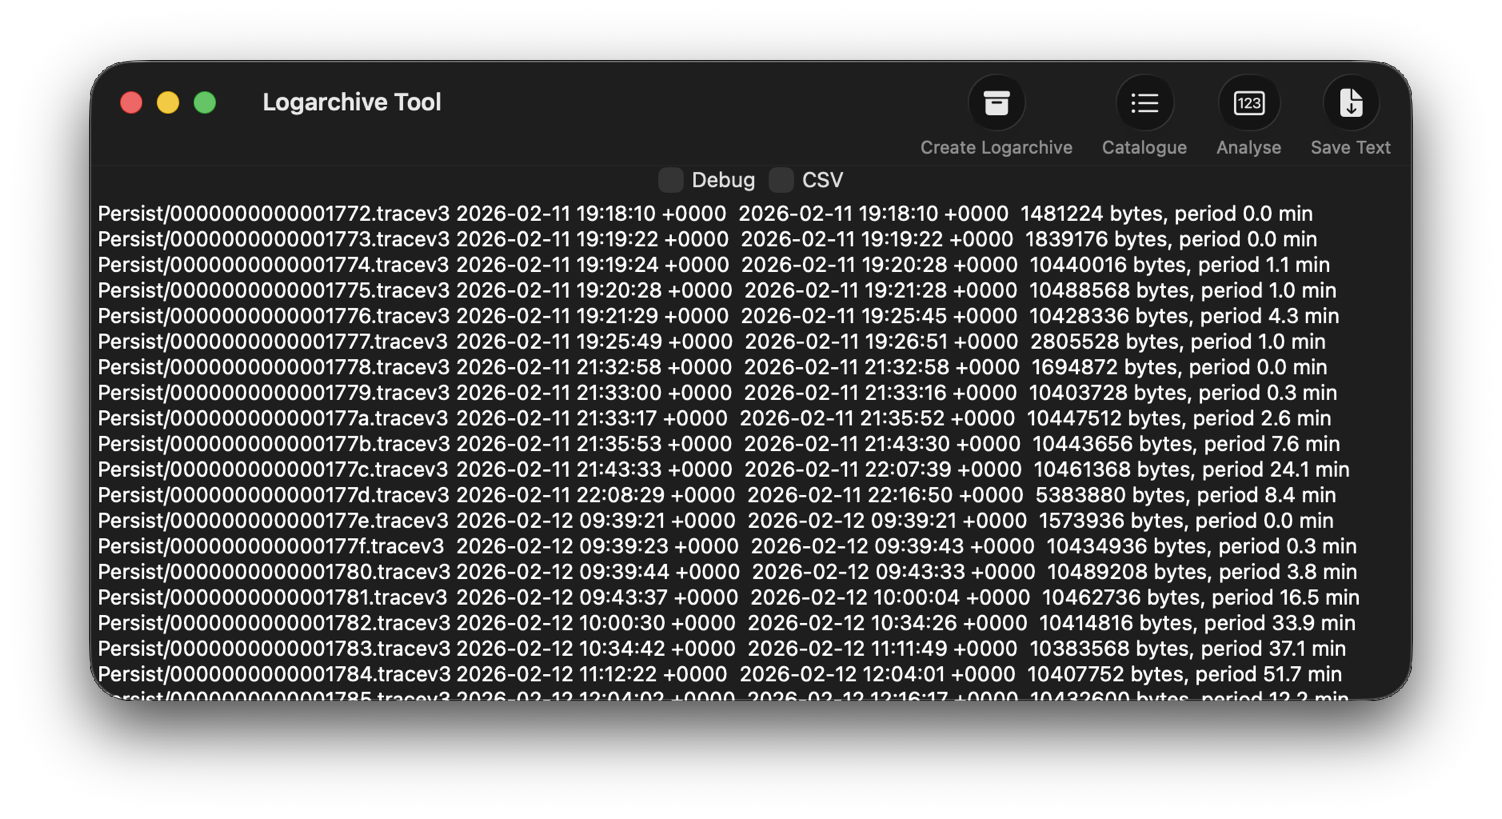
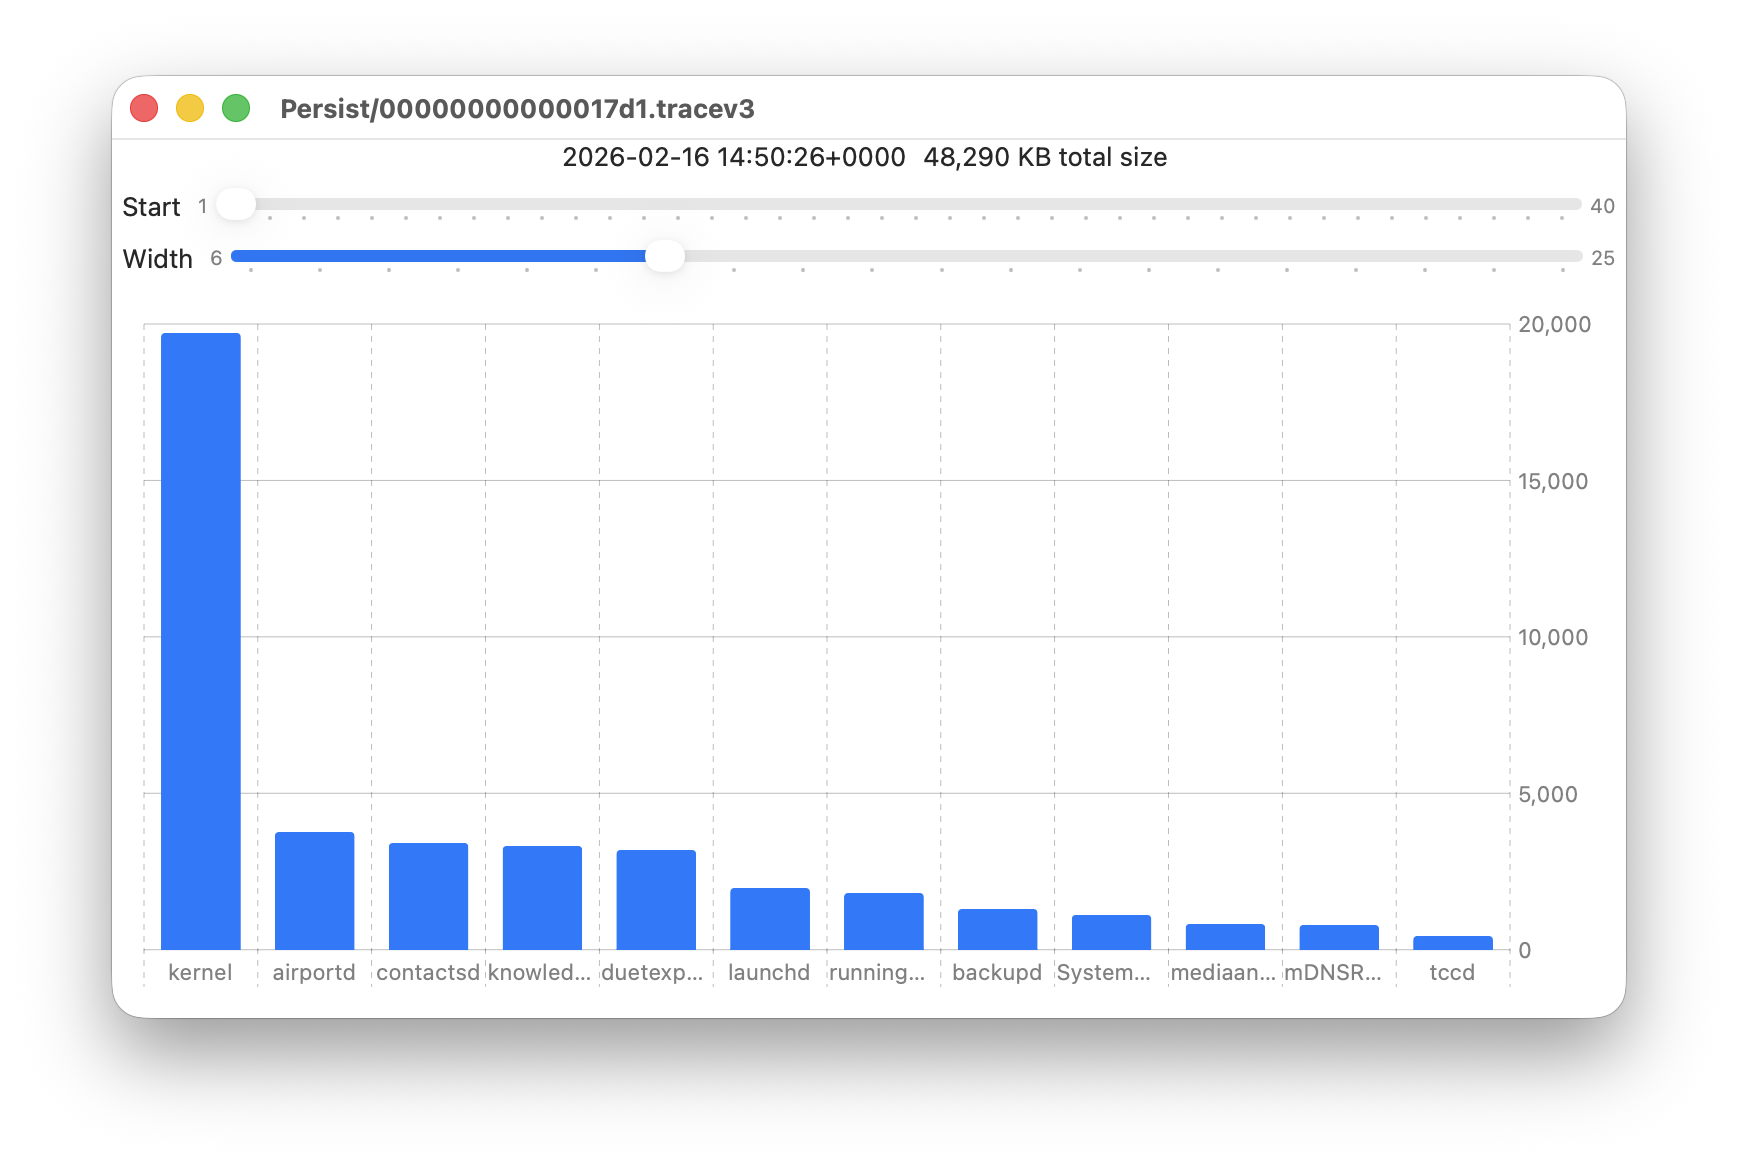
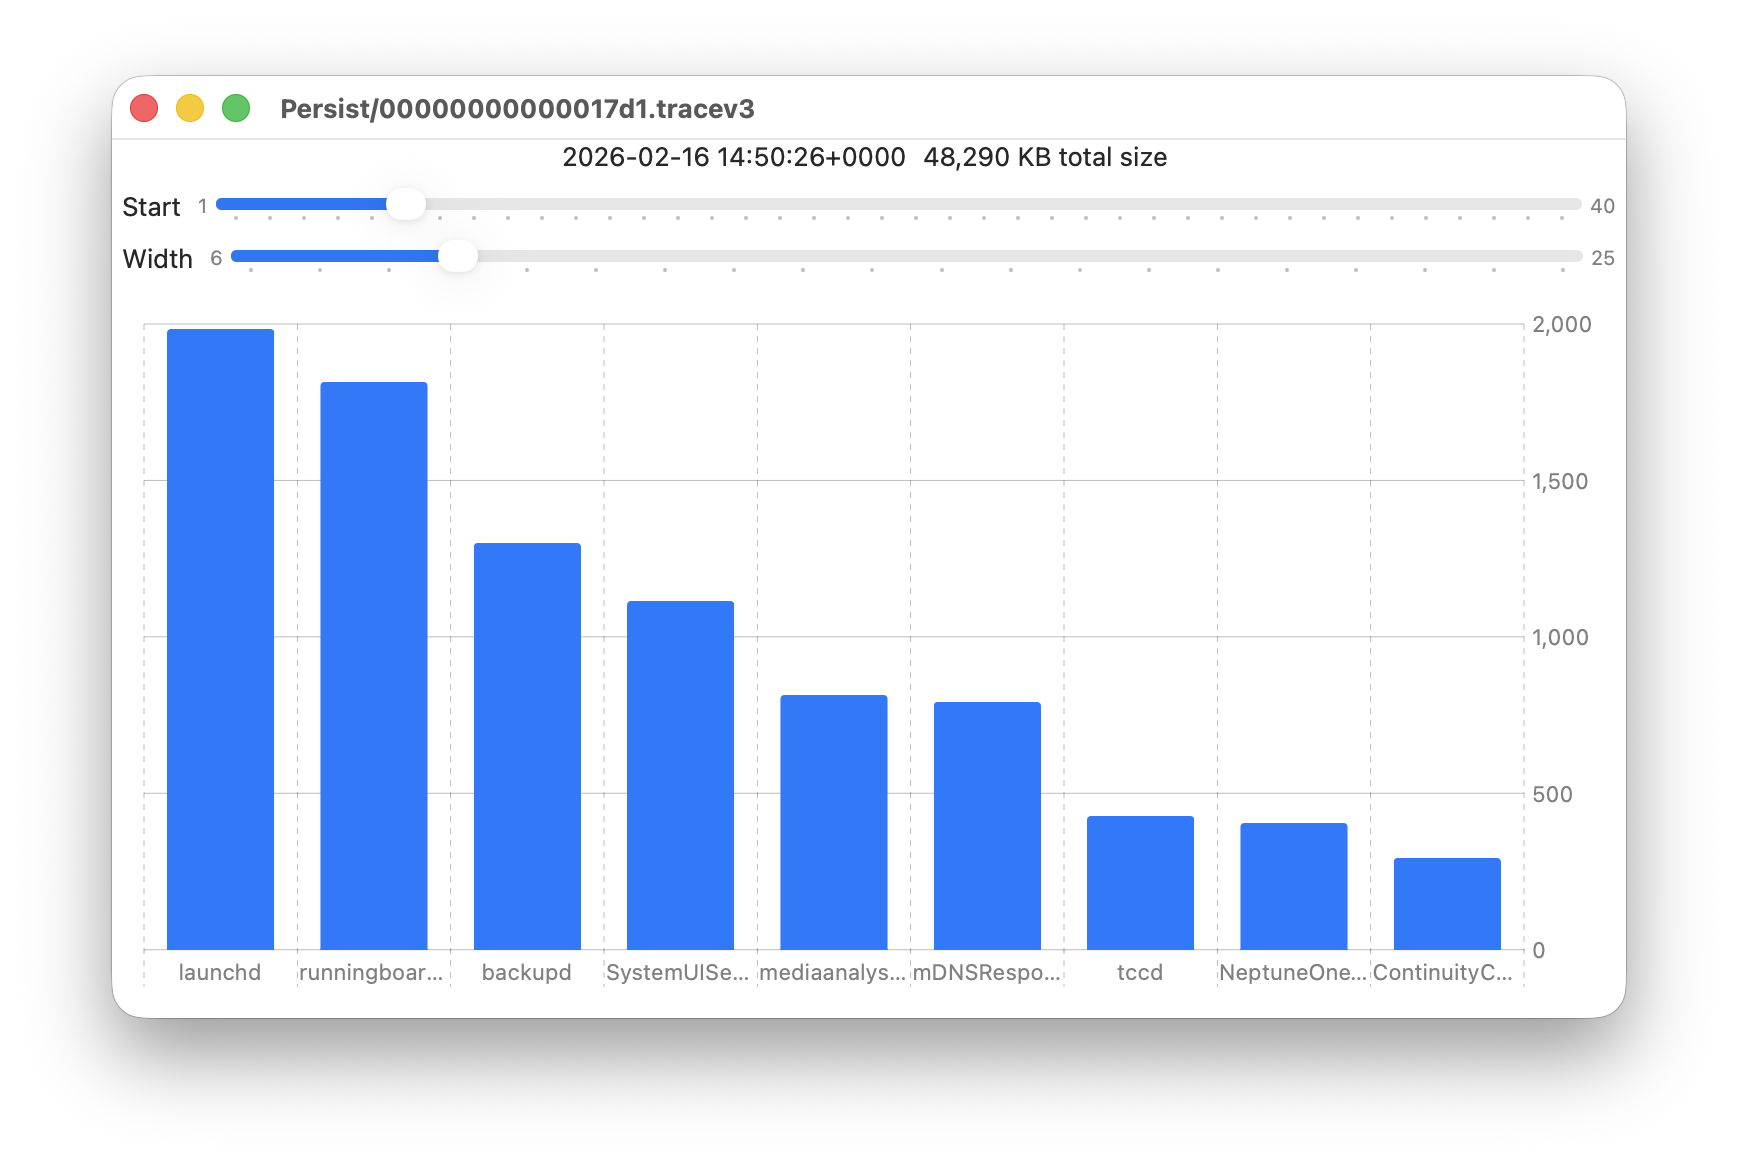
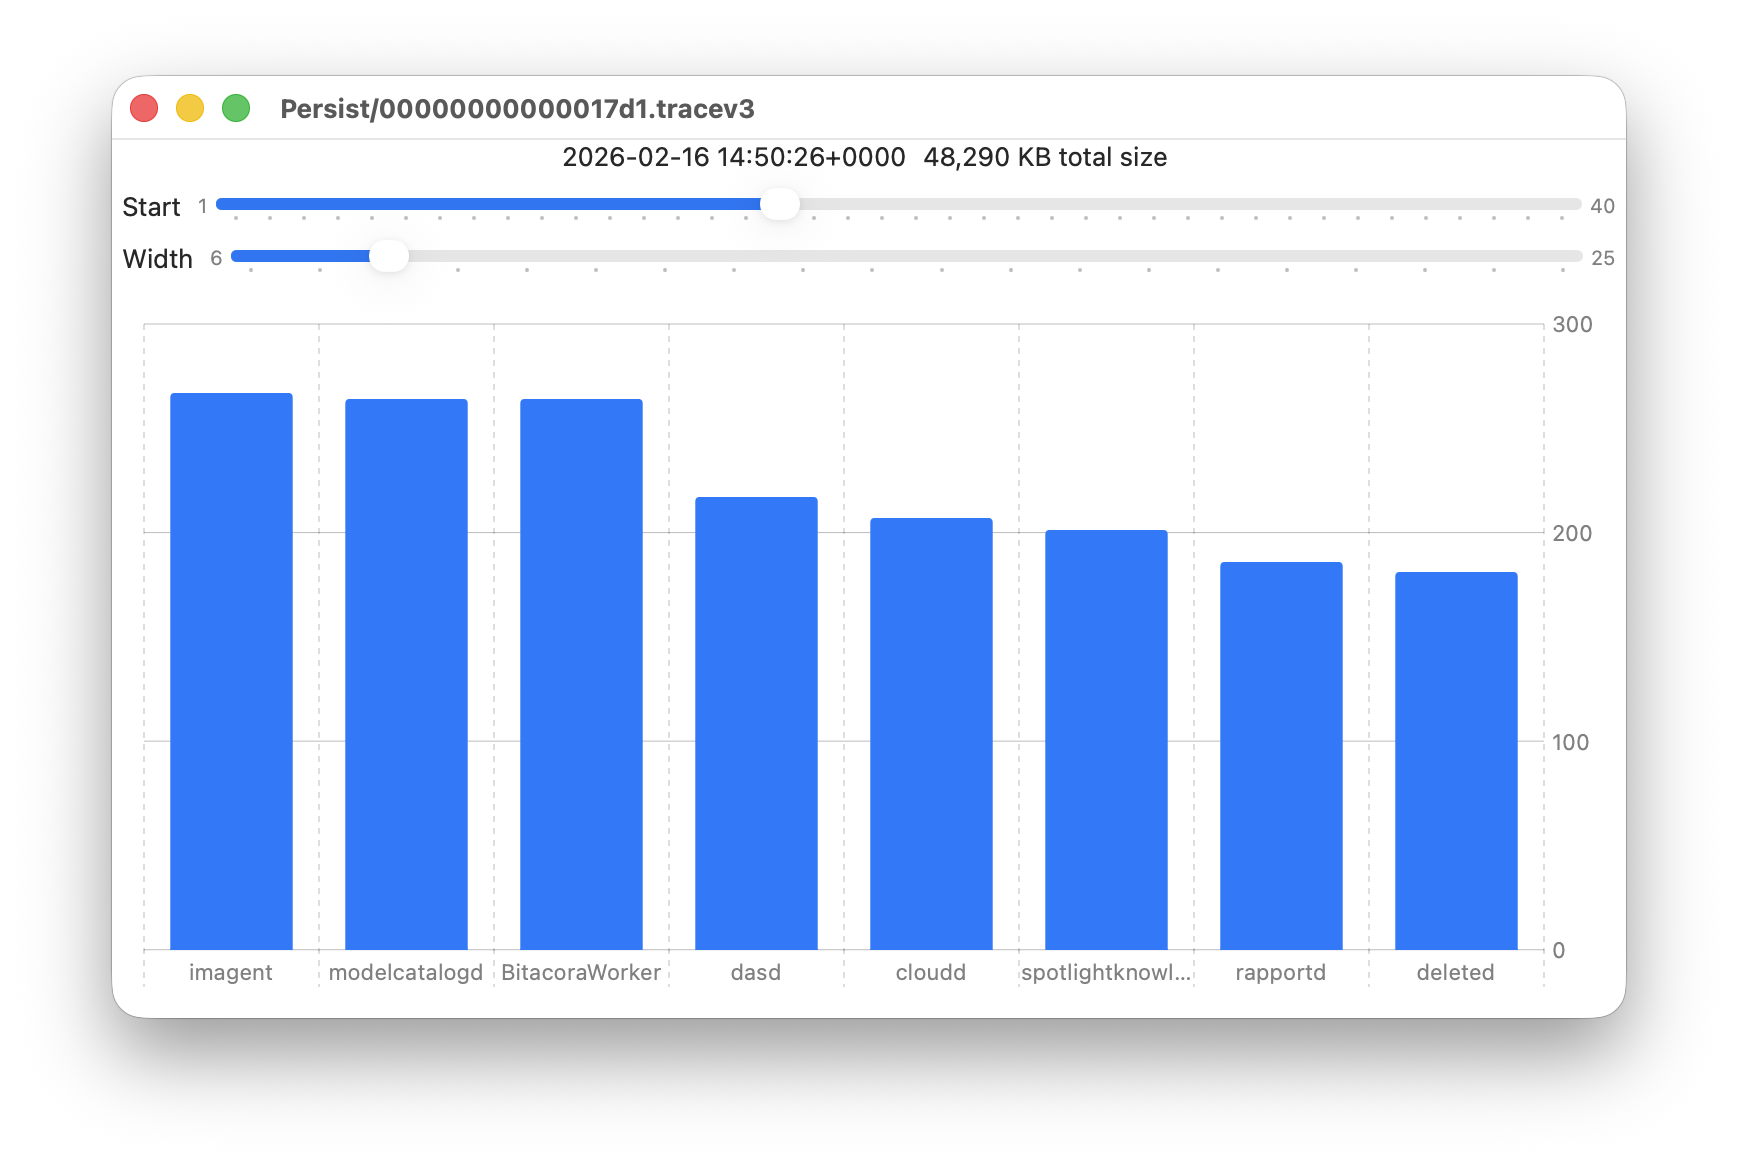
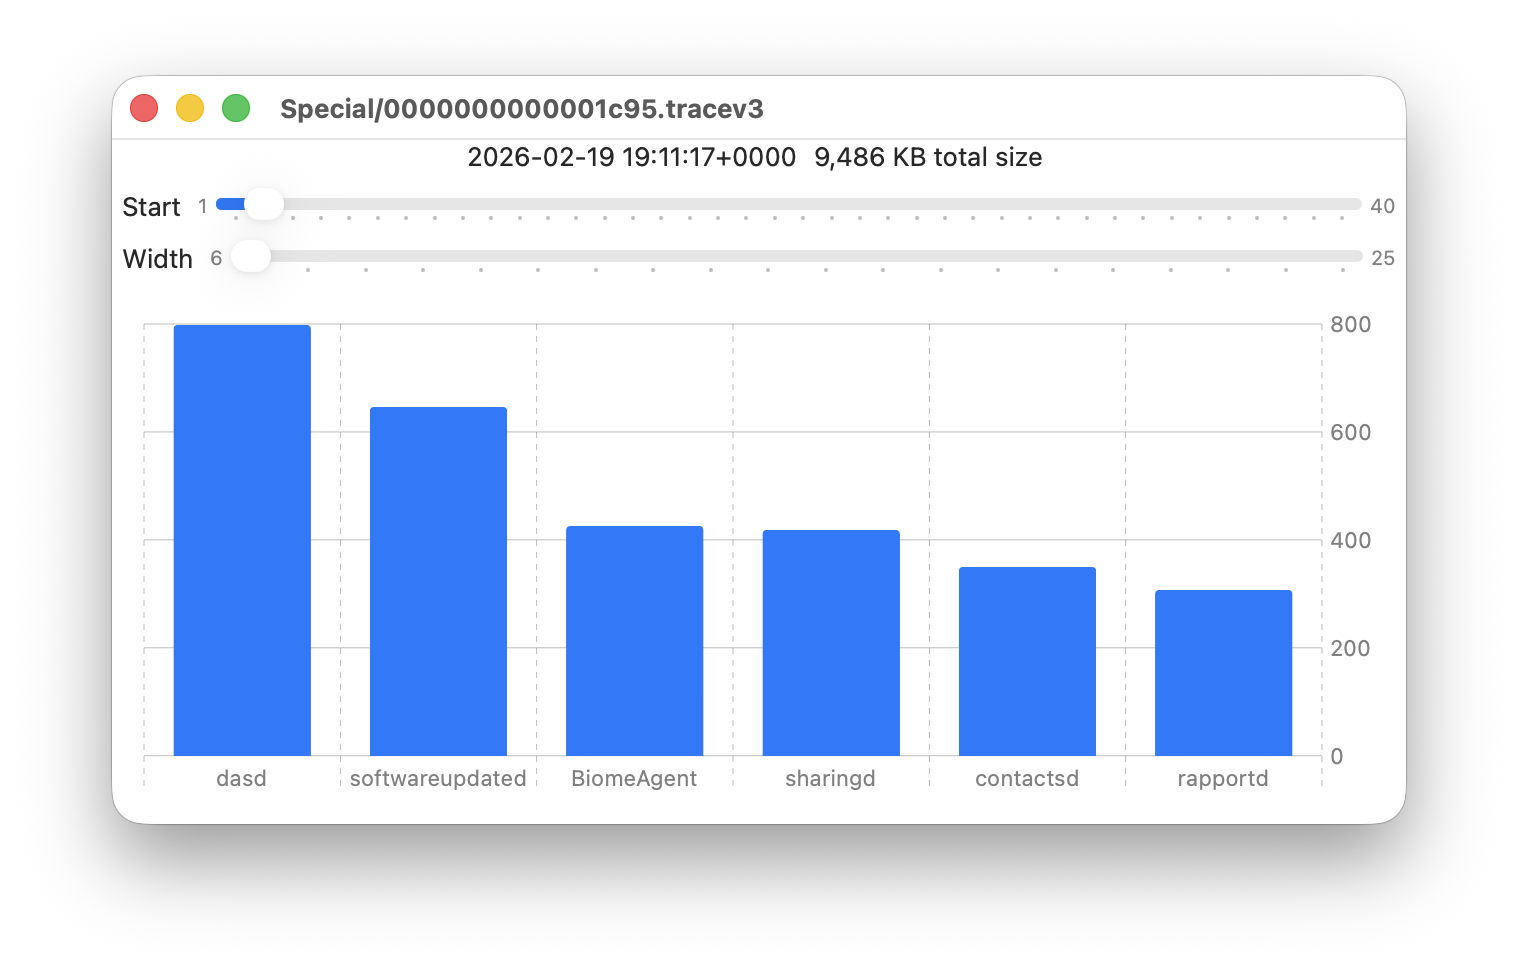
Apple’s logs, in macOS and all its devices, are stored in proprietary tracev3 files, sorted into three folders:

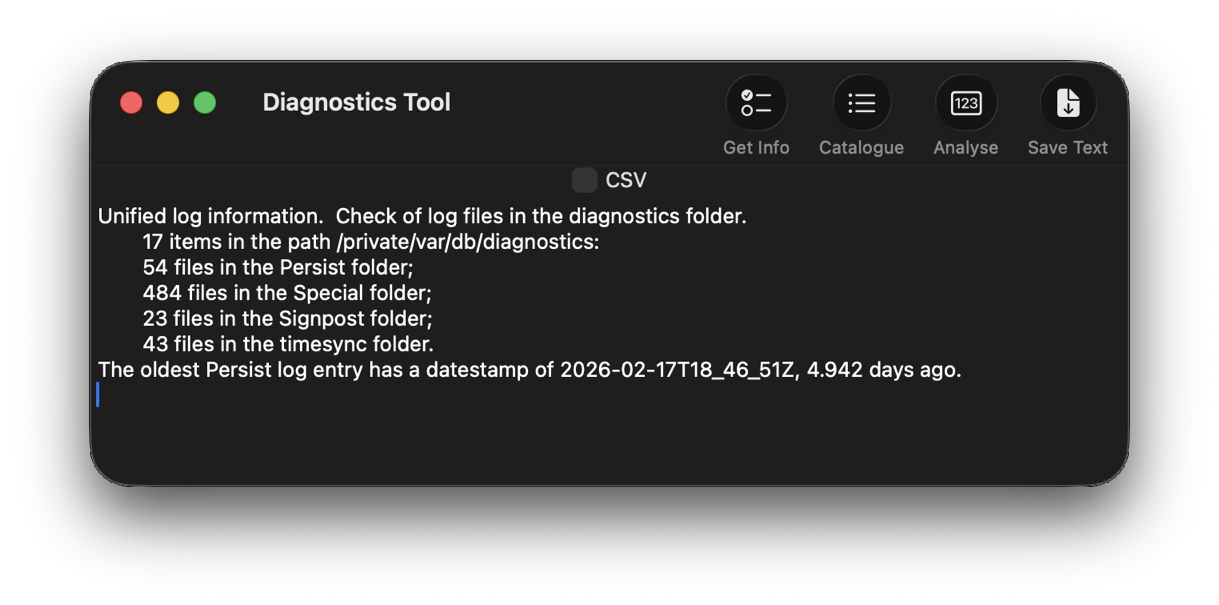
  • Persist, containing the bulk of log entries, retained to keep their total size to about 525 MB in about 50-55 files;
  • Special, including fault and error categories, whose entries are slowly purged over time until none remain in the oldest log files, so have a variable total size and number.
  • Signpost, used for performance measurements, which also undergo slow purging until they vanish.

One simple way to estimate the period for which log entries are retained is to find the date of creation of the oldest log file in each of those folders. On a Mac mini M4 Pro run largely during the daytime, those dates were

  • Persist, earliest date of creation 7 March 2026 at 16:54
  • Special, 9 February 2026 at 19:41
  • Signpost, 3 March 2026 at 16:41

when checked on 10 March. Those indicate a full log record is available for the previous 3 days, followed by a steady decline with age to the oldest entry 31 days ago. That compares with statistical data available in my app Logistician going back as far as 14 January, although all entries between then and 9 February have now been removed and lost.

Retrieving old log entries

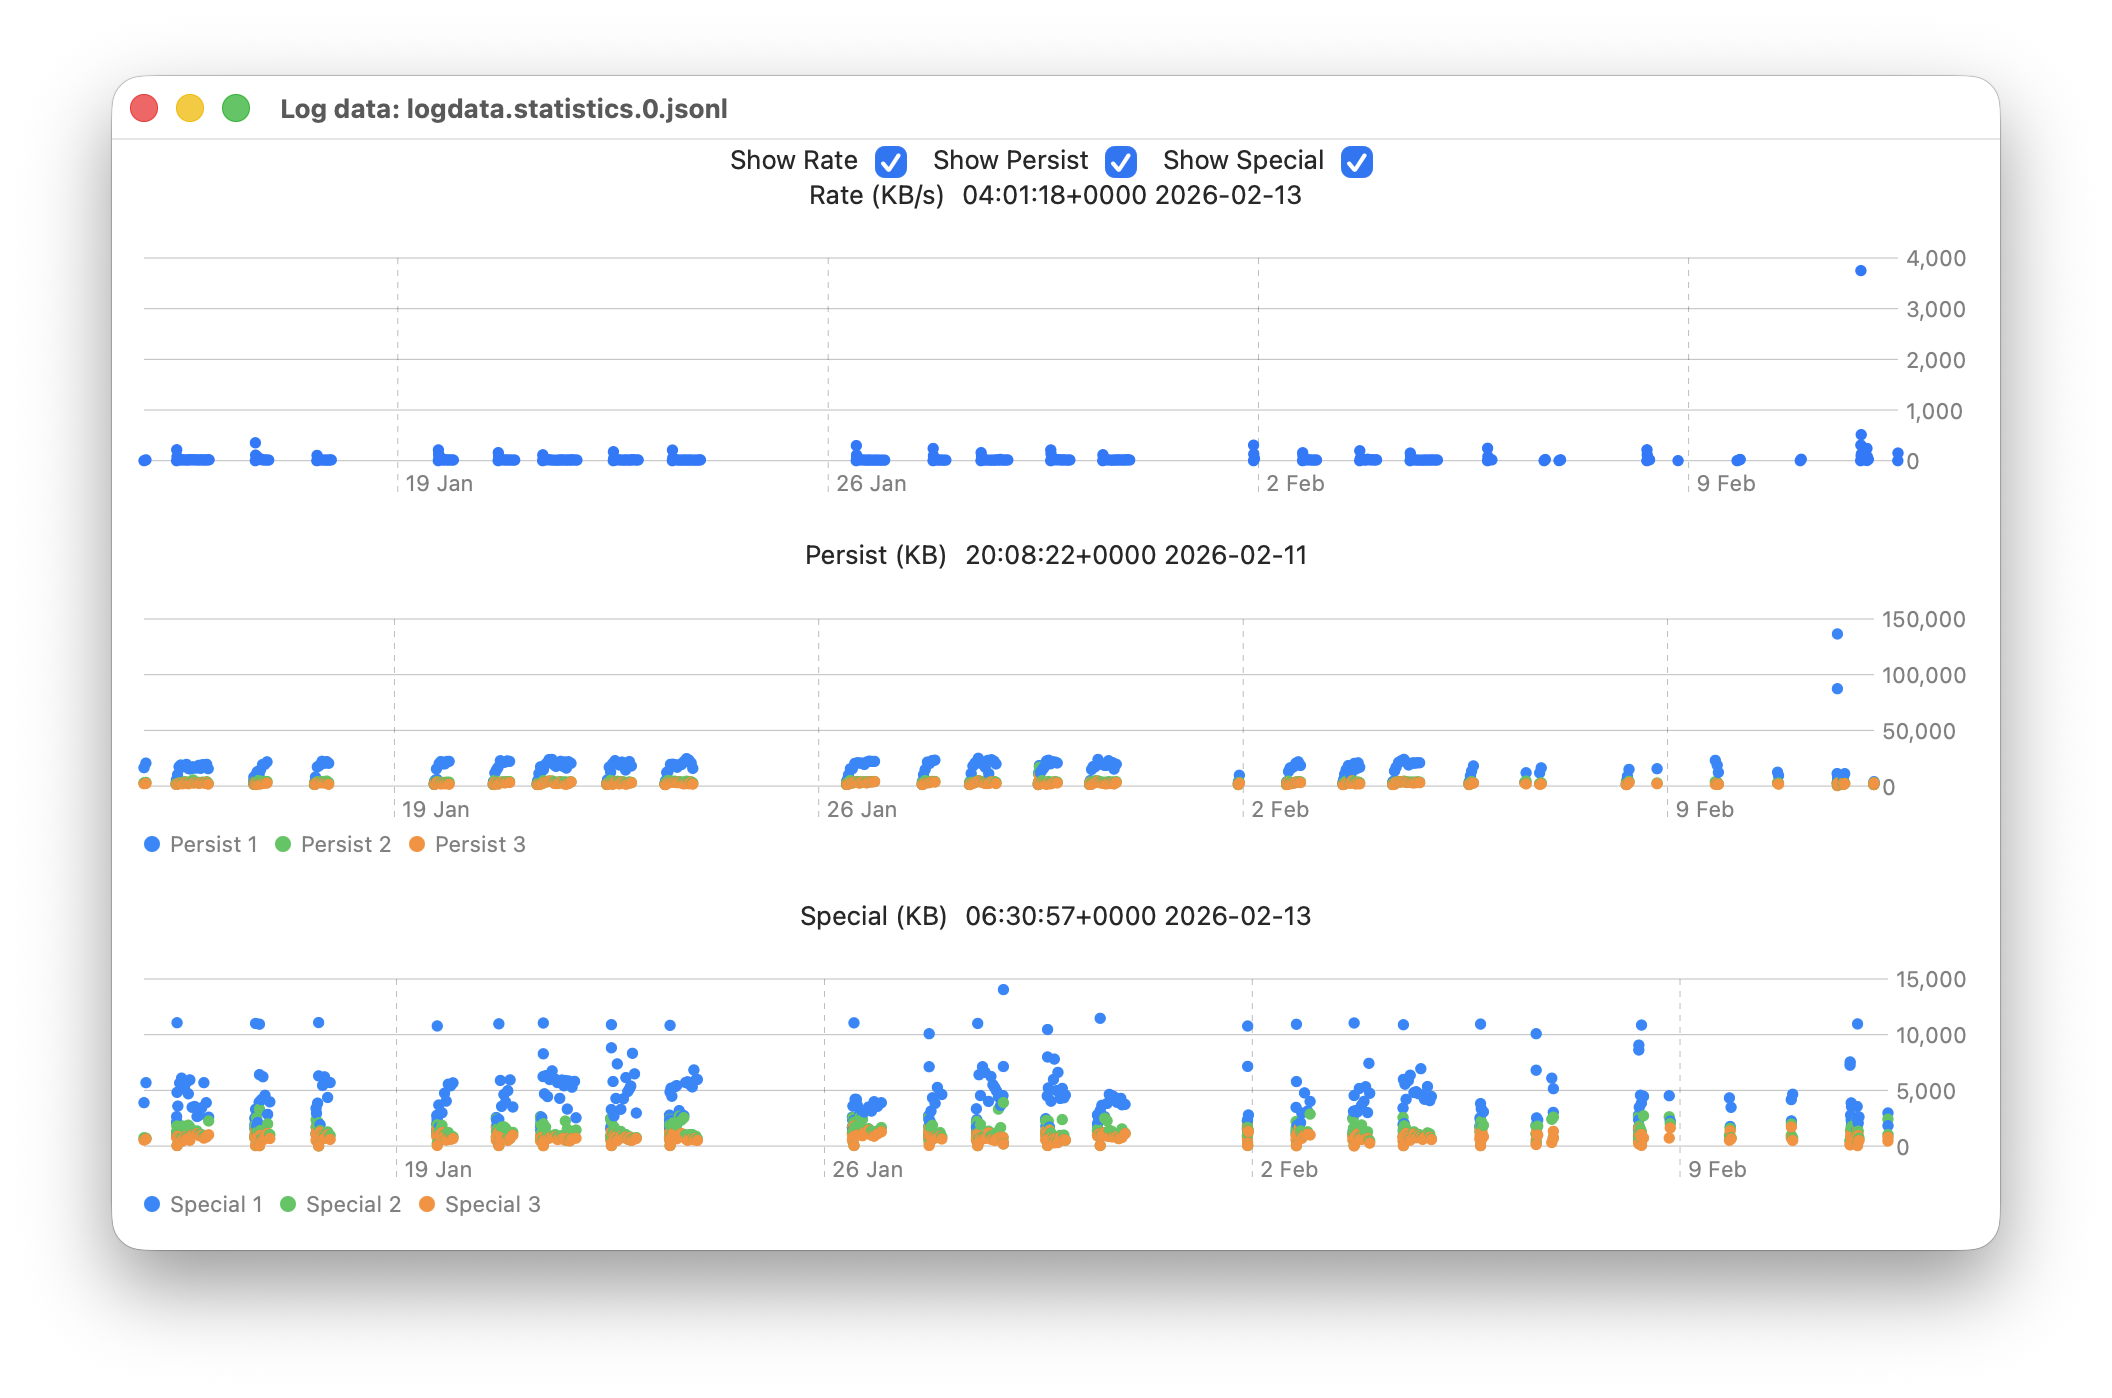
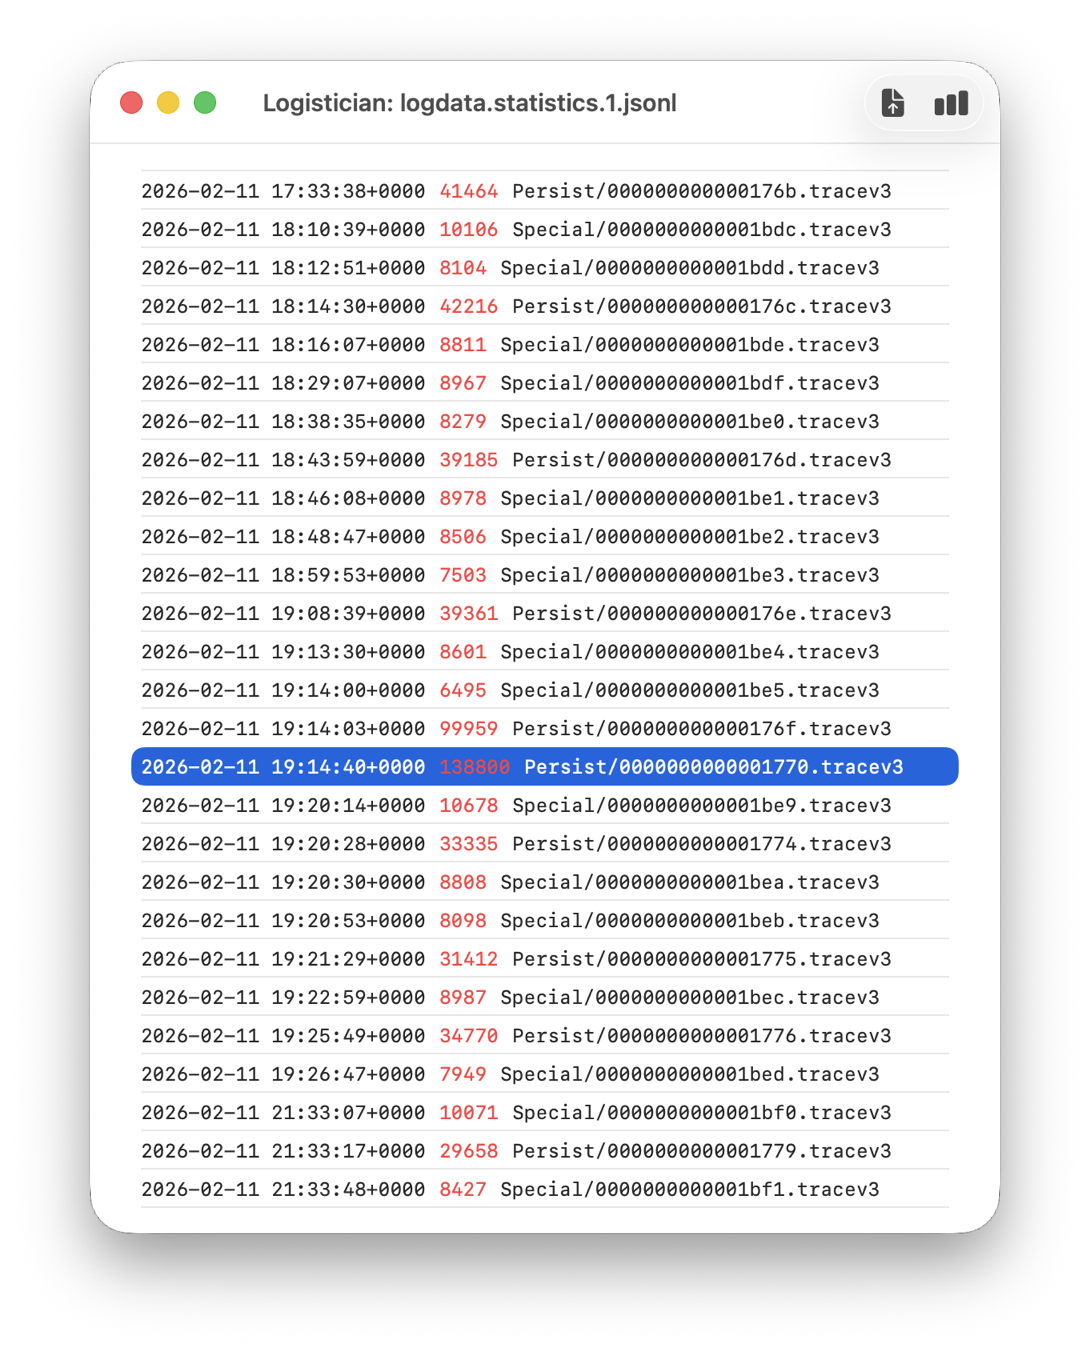
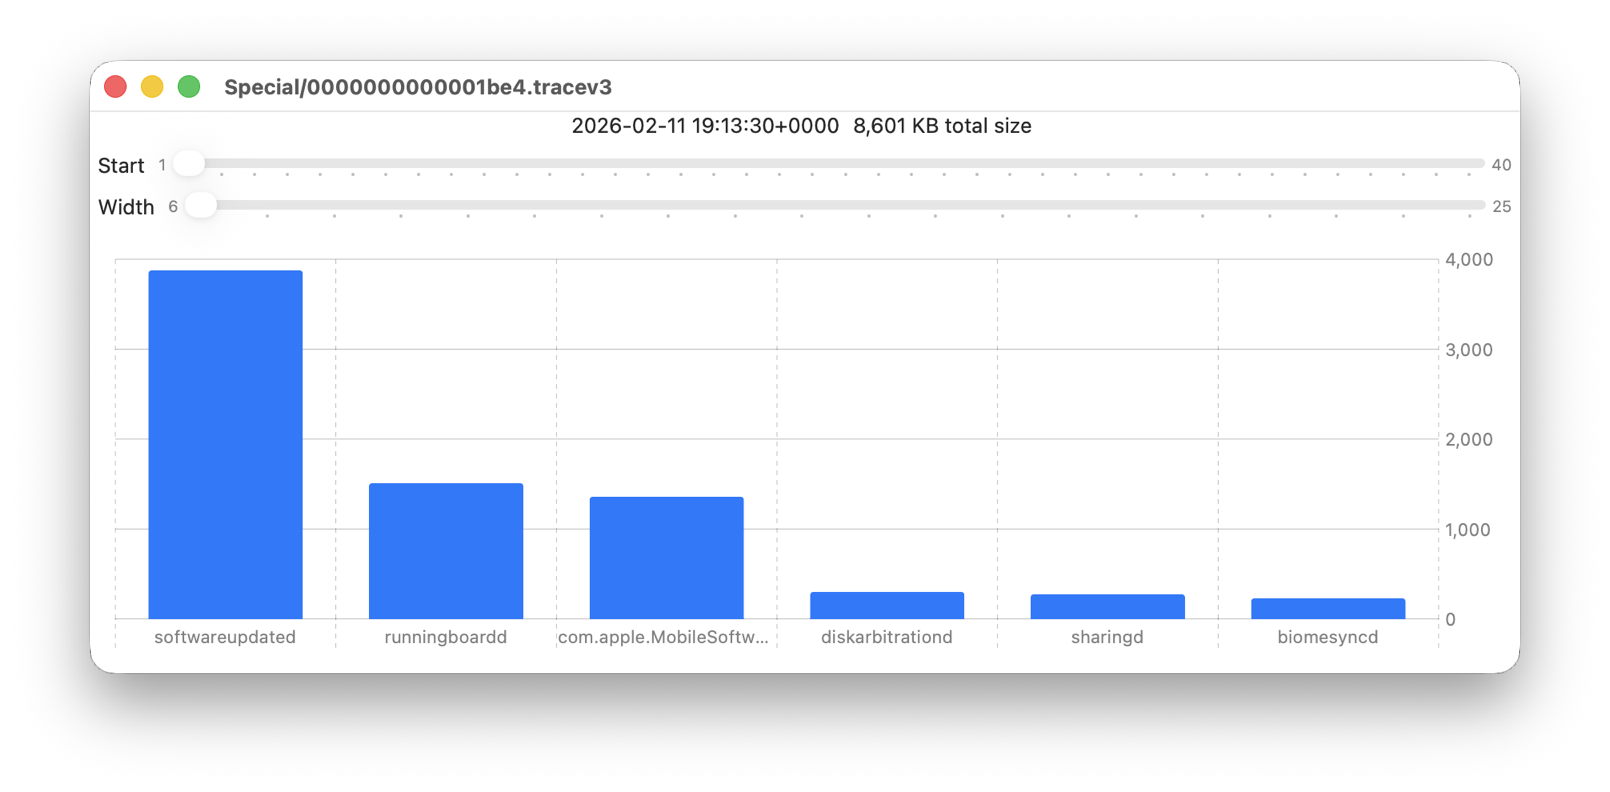
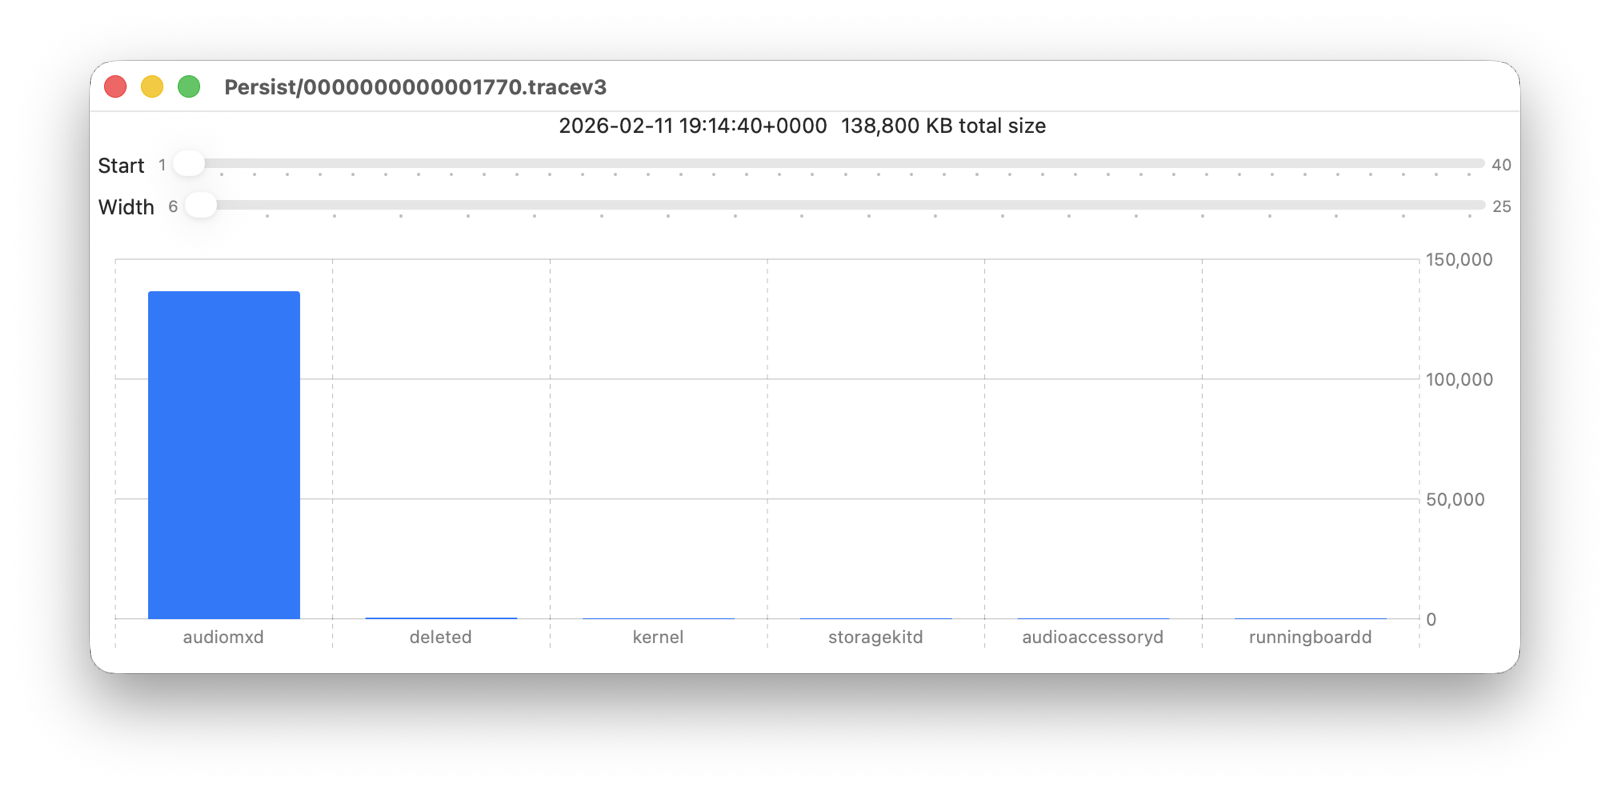
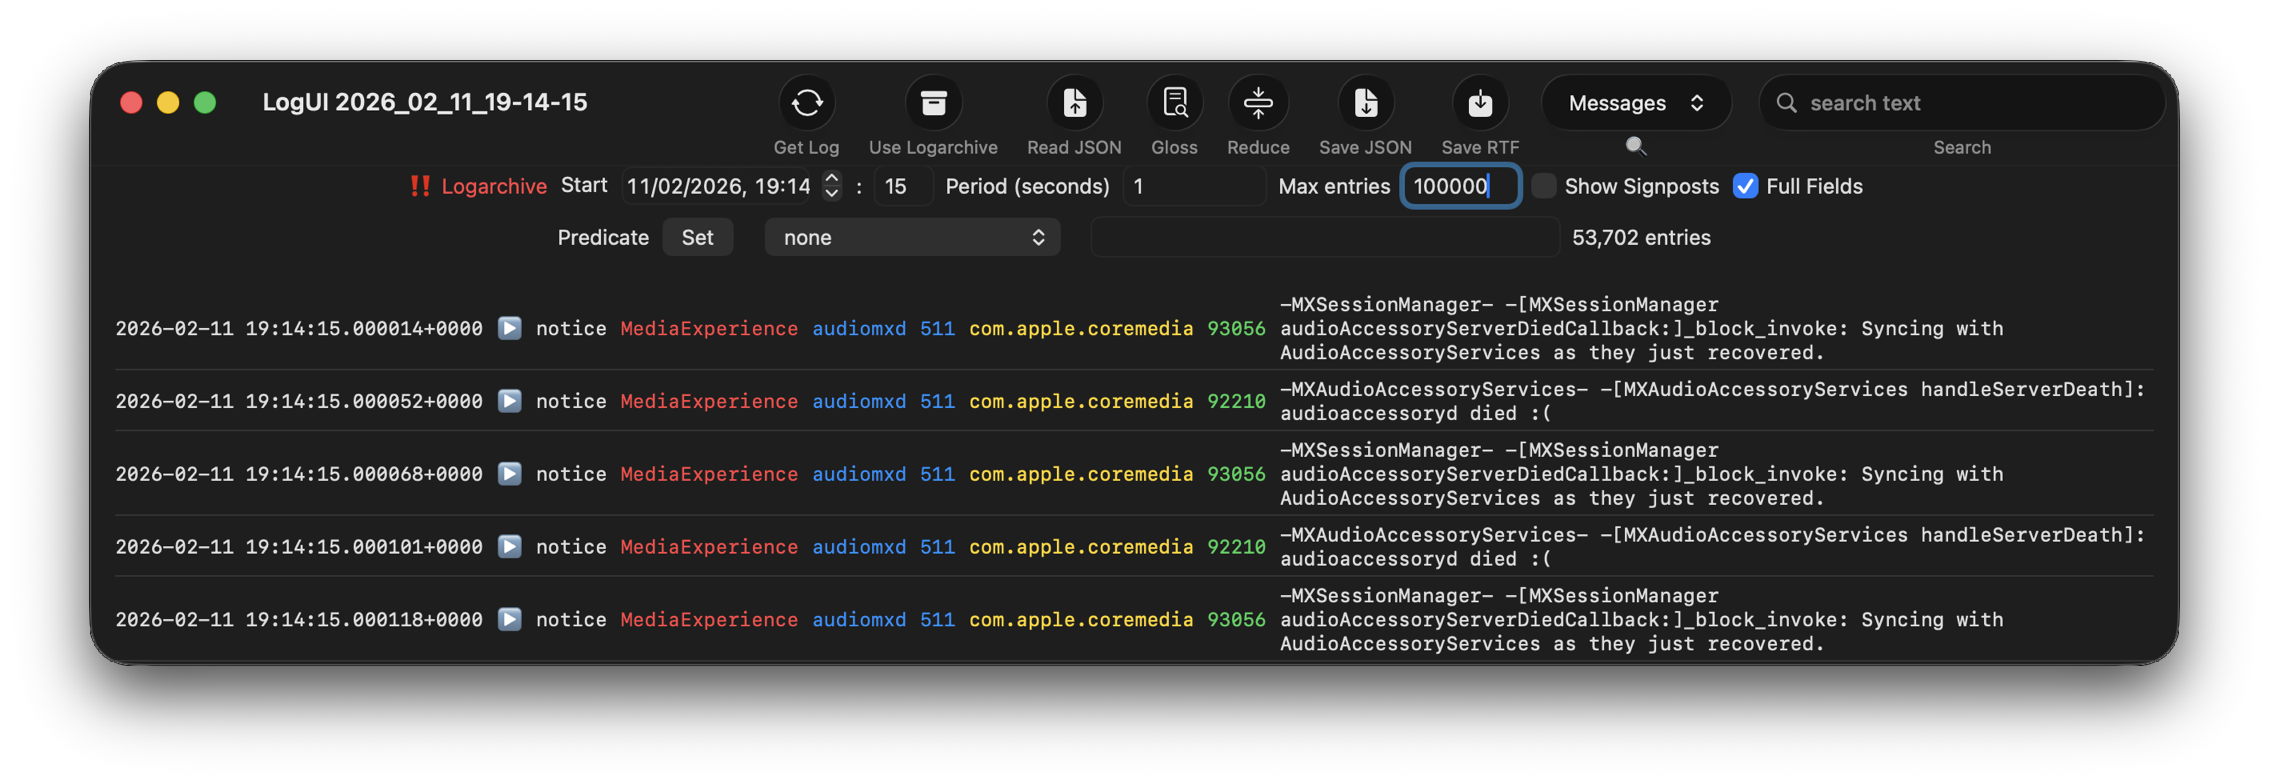
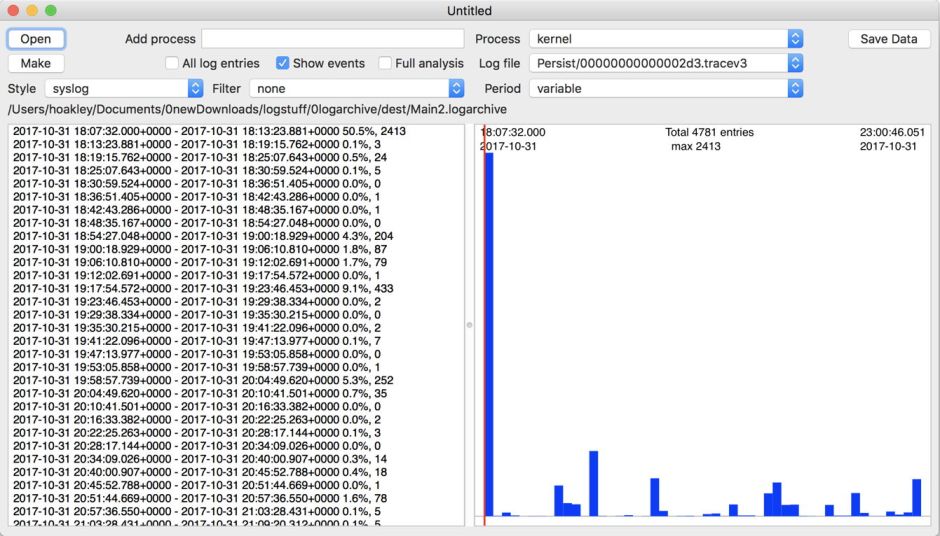
The real test of how many log entries have been retained is to try to retrieve them. Although the oldest Special log file was created on 9 February, the oldest log entry I could retrieve was the start of the boot process on 11 February, in Special log files returning a total of over 44,000 entries for that day. However, no further log entries could be found after those until the morning of 24 February, a gap of over ten days.

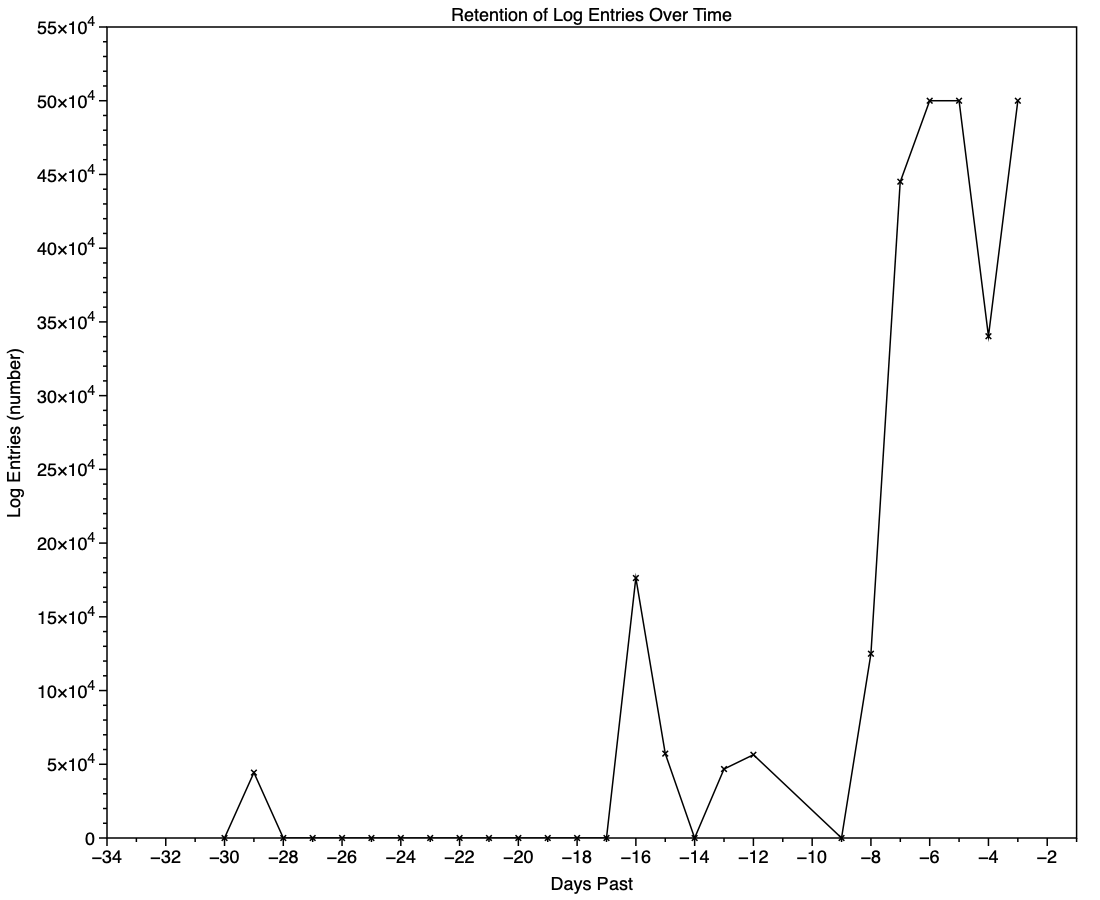
This chart shows the numbers of log entries that could be found and read at intervals over previous days. Where a total of 500,000 is shown, that means over 500,000 for that 24 hour period. I checked these using two different methods of access, using the OSLog API in LogUI, and via the log show command in Ulbow. In all cases, log show returned slightly fewer than OSLog.

It’s clear that with only 3 days of full Persist log files, very few entries have been retained from earlier than 7 days ago, and beyond that retention numbers are erratic.

Over the period prior to the oldest Persist file, when entries could only be coming from Special log files, those included both regular and boundary types, and categories were diverse, including fault, error, notice and info, and weren’t confined to the first two of those categories. Most subsystems were represented, but very few entries were made by the kernel. There is thus no obvious pattern to the longer retention of entries in Special files.

Ephemeral entries

Log entries are initially written to memory, before logd writes most of them to permanent storage in tracev3 log files on disk.

mul102LogdFlow

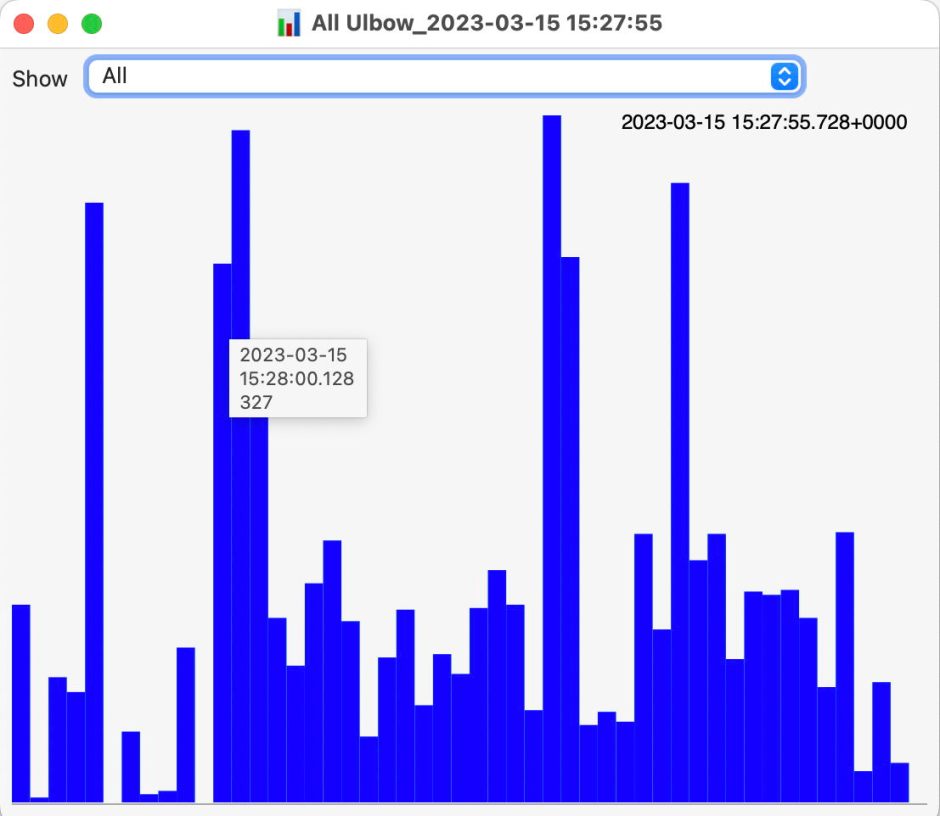
The first substantial purging of entries thus occurs when logd decides which are ephemeral and won’t be retained on disk. This can be seen by following the number of entries in a short period of high activity in the log, over time, and is shown in the chart below for a sample period of 3 seconds.

When fetched from the log within a minute of the entries being written, a total of 22,783 entries were recovered. Five minutes later there were only 82% of those remaining. Attrition of entries then continued more slowly, leaving 80% after 8 hours. Analysis suggests that over this period in which there were about 6,100 log entries per second written to disk, approximately 1,700 log entries per second were only kept in memory and never written to disk. That suggests about 22% were ephemeral, a proportion that’s likely to vary according to the origin and nature of log entries.

Summary

  • A fifth of log entries are likely to be ephemeral, and lost from the log within the first minutes after they’re written.
  • Most retained log entries are written in Persist logs, where tracev3 files are removed by age to keep their total size to just over 500 MB. Those should preserve the bulk of log entries for hours or days after they’re written.
  • Entries stored in Special log files may be retained for significantly longer, here up to a maximum of 29 days. Although those may contain fault and error categories, retention doesn’t follow an obvious pattern, making their period of retention impossible to predict.
  • In practice, the period in which a fairly complete log record can be expected is that applied to Persist files, which varies according to the rate of writing log entries. In most cases now that’s unlikely to be longer than 5 days, and could be less than 12 hours.
  • You can’t draw conclusions from the apparent absence of certain log entries from the log prior to the earliest entries in Persist log files, as it’s likely that those entries will have been removed.
  • Expecting to retrieve log entries from earlier than 5 days ago is almost certain to fail.

Lost in the log? Here’s Logistician 1.1

If you’re still struggling to find your way around the log, or not even prepared to try, I have a new version of my log statistics and navigation utility Logistician that should help. This enhances its list of log files by adding further details, and adds a completely new graphical view to help identify periods of unusual log activity.

Log list

As I showed here a couple of days ago, Logistician opens the JSONL statistics files maintained by logd in /var/db/diagnostics, alongside folders containing the tracev3 log files. The list of those originally gave a minimum of information, and that has been increased to contain:

  • the start date and time of each file, in addition to the date and time it was closed
  • the period during which that file had entries added to it, in seconds
  • the size of log data within the file, in KB
  • the average rate at which log data was written to that file, in B/s
  • the path to that file, which reveals whether its type is Persist, Special or Signpost, hence the nature of its contents.

Start date and time are taken from those for the closing of its predecessor, so can’t be given for the first file of each type. They can also span a period during which the Mac was shut down, although that’s usually obvious from the low rate at which log data was written.

Point plot

The new window available plots point values for the whole series of log files in the current list.

This displays any of three different plots:

  • rate of log data written to Persist log files over the period for which log files are listed, in B/s;
  • amount of log data written to Persist log files over that period, in KB;
  • amount of log data written to Special log files over that period, in KB.

For the latter two, quantities shown are for the three processes that entered the largest data in that period. I have looked at identifying the processes concerned, but that’s far too complex to do here.

Signpost log files contain special types of entry intended to be used to assess performance, and contribute little to other analyses, so are excluded from these plots. Regular log entries are either saved to Persist or Special types, although it’s unclear as to which entries go to each. Some processes only appear to use one, although the entries for many processes can be saved to either. Although there are similarities in the patterns of Persist and Special files, they also differ in other respects. These three plots appear most suitable when looking for anomalies in the log.

Although these plots make it easy to identify the date of an anomaly such as the high outliers at the far right, for 11 February, they can’t tell you the time of the file you should analyse. For that, Logistician reports the time and date of the location that the pointer is hovering over. Place the pointer over the high rate value, for example, and you’ll see it occurred at about 20:14:00. This helps you identify which of the listed log files has that high peak rate, hence the time period to inspect using LogUI.

Traditionally, the moment you move the pointer from a chart area, hover information like that is removed. If that were done here, it would make it infuriatingly hard to refer to the list of log files. So these dates and times show those at the last moment the pointer was over that point plot. The knack is to hover over the point of interest, then move the pointer off that chart vertically, so as not to alter the time indicated. I’m looking at alternative methods of locking the time shown, to make that easier, but that presents more complex coding challenges, as do methods of zooming in on smaller periods of time.

In case you’re wondering, the overall period covered by these point plots, divided across the two log statistics files maintained, is approximately 6 weeks, as indicated by the X scales shown here.

Logistician version 1.1 is now available for Sonoma and later from here: logistician11a
and will shortly be getting its place in a Product Page and other listings here.

Enjoy!

Update: thanks to Jake for finding a divide by zero bug that could crash Logistician when opening a JSONL file. I have fixed this in build 14, now available above. Please download that and replace copies of the original build 12, so you shouldn’t encounter that crash. My apologies.

Investigate a past event in the log

We don’t always notice something is wrong within a few hours of the event that caused a problem. Sometimes it can take days or weeks before we realise that we need to check something in the log. By that time all trace has vanished, as the active log will have rolled those log entries long before we go looking for them. This article shows how to recover and analyse events from the more distant past, using a Time Machine backup and my free utilities LogUI and Logistician. My target is the macOS 26.3 Tahoe update installed on my Mac mini M4 Pro on 11 February, and I performed this analysis 11 days later, on 22 February.

When was the event?

In this case I remember updating at around 18:30-19:30 on 11 February, but I don’t even need to recall the date. I first copied the logdata.statistics.1.jsonl file from my active log in /var/db/diagnostics to a working folder in ~/Documents, then opened it using Logistician.

The log file listing between 18:10:39 and 19:26:47 on 11 February 2026 shows a remarkably rapid turnover of log files that’s an obvious marker of that update. Highlighted here is a Persist file that’s exceptionally large at 139 MB of log entries for a collection period of just 37 seconds, although like other tracev3 log files in the Persist folder that only takes 10.5 MB of disk space.

Retrieve the log

Although I’m confident those logs were removed many days ago, I open LogUI, then select its Diagnostics Tool from the Window menu. I click the Get Info tool and select my active log in /var/db/diagnostics. That tells me that the oldest log entry there dates from 17 February, so there’s no point in trying to find those entries in that log.

Like all good backup utilities, Time Machine also backs up the whole of the log folders, and I can use those to create a logarchive file for analysis. I therefore locate the next backup made after those log entries were written, on 12 February, and copy the /var/db/diagnostics and /var/db/uuidtext folders into a new folder in my working folder, ready to turn them into a logarchive.

In LogUI, I open its Logarchive Tool from the Window menu and use that to turn those folders into a logarchive I can access using LogUI. I check that freshly created logarchive using the Catalogue tool to confirm that it contains the log files I want to browse.

Identify the event

With the historical log safely preserved in a logarchive and a defined time of interest, my next task is to identify the event I want to investigate. In this case, I could probably go straight ahead and look at all entries for a few seconds, but in other circumstances you may need to know which entries to look for.

Back in Logistician, I select that extraordinary Persist log file and view it in a Chart. Most of the other log files over this period look like this:

with large quantities of entries from softwareupdated, com.apple.MobileSoftwareUpdate and similar processes. But the huge Persist file that filled in only 37 seconds is exceptional.

Almost all its entries are from audiomxd, and all other entries are dwarfed by its size.

Browse the event

By default when you click on LogUI’s Get Log tool it will fetch those log entries from the active log. To switch that source to my logarchive file, I click on the Use Logarchive tool and select the logarchive I just created in my Documents folder. To remind me that it’s no longer looking in the active log, that window then displays a red-letter caution of !! Logarchive to the left of the Start control. That also reminds me to use dates and times within the range covered by that logarchive.

I set the Start to ten seconds into the collection period of that large Persist file, a period of 1 second, and the maximum number of entries to 100,000, then click on the Get Log tool.

This is one of the most remarkable log extracts I have ever seen: in this 1 second period, the audiomxd process in com.apple.coremedia wrote about 53,000 entries to the log. Over the 37 seconds of log records in that single Persist file, audiomxd must have written at least 1.5 million log entries. These are all apparently the result of the ‘death’ of the AudioAccessory service audioaccessoryd, and its recovery after updating macOS.

Summary

  1. Identify approximate time of event from /var/db/diagnostics/logdata.statistics.1.jsonl using Logistician.
  2. Check in LogUI whether that falls within the period of the active log.
  3. If not, retrieve /var/db/diagnostics and /var/db/uuidtext from the next backup made after the event.
  4. Convert those folders into a logarchive using LogUI’s Logarchive tool, and check it contains the period of the event.
  5. Identify the processes involved using Logistician’s chart.
  6. Set LogUI to use that logarchive, enter the correct date and time, and get log entries for the required processes.

Last Week on My Mac: A log statistician

If you don’t know exactly what you’re looking for, and when it happened, the log has been a hostile place. Doom-scrolling through tens of thousands of log entries in the hope of stumbling across a clue is tedious, and the odds have been stacked against you. So last week I’ve been doing something to redress the balance and shorten those odds, and I’m delighted to offer its first version in Logistician. This has nothing to do with logistics, but is all about log statistics.

Alongside folders containing your Mac’s Unified log files, in /var/db/diagnostics, you’ll see files with names starting with logdata.statistics. A couple are text files that only go back a day or two, and others have the extension jsonl. If you were privileged to test some beta-releases of macOS Tahoe, you may have some database files as well, but here it’s those jsonl files I’m concerned with.

Inside them are basic statistical summaries of every log file that’s been saved in your Mac for the last few weeks or months. Even though the original log files have long since been deleted, summaries of their contents are still available in files like logdata.statistics.1.jsonl, and those are opened up by Logistician.

As the files in /var/db/diagnostics are still live, and may be changed as logd does its housekeeping, copy those jsonl files to somewhere in your Home folder, like a folder in ~/Documents. Open Logistician, click on its Read JSONL tool, select one of those copies and open it.

Logistician’s window displays the file’s contents in a list, with the oldest at the top. It gives the date and time that file was saved, just after the last log entry was written to it, its size in KB, whether it was a Persist (regular log), Special (longer supplementary log entries) or Signpost (performance measurements) collection, and the name of the file.

Select one of those file entries and click on the Chart selection tool at the top right to see its data plotted out in the Chart view.

Data provided for each log file listed includes a breakdown of the total size of log entries from that process or subsystem, and Logistician’s Chart view displays those data as a bar chart. The height of each bar represents the total size in KB of log entries made by that process in that specific log file. As there are a 50 bars available, two sliders set the size and location of that window on the data:

  • Start sets the number of the first bar on the left, beginning at 1 for the greatest size, usually the kernel, and increasing to 40 for a process with very few log entries, just ten from the smallest.
  • Width sets the number of bars to display, ranging from 6 to 25. The more shown, the harder it is to read the names of processes at the foot of each bar, and the less precisely you can read the size of their log data at the right.

These sliders are set to show 9 bars from number 6 at the left (the sixth highest log data, written by launchd) to number 14 at the right (14th highest, written by ContinuityCaptureAgent). Of interest here are around 400 KB of log entries from NeptuneOneWallpaper.

Here are 8 bars from 17 to 24, with smaller quantities written to the log of around 200 KB each. They include the DAS service dasd and cloudd for iCloud.

It’s easy to flip quickly through a series of log files: click on the next file you want to view in the main list, click on the Chart selection tool and values will be displayed immediately.

Fascinating though that might be, it doesn’t in itself answer many questions. Add a log browser like LogUI, though, and the combination helps you locate and identify unusual activity, problems, and specific events.

I happened to notice one Special log file that was closed at 19:11:17 on 19 February has high log data from softwareupdated. The previous Special log file was closed at 18:20:04, so somewhere between those times my Mac checked for software updates.

To ensure the full entries were still available in the log, I opened LogUI’s Diagnostics Tool to confirm that its earliest entries were a couple of days earlier.

I then set LogUI to a Start time of 18:20:04 with a Period of 600 seconds, and a Predicate set to a processImagePath of softwareupdated, to look for entries from that process. My first check located all the softwareupdated entries around 18:29:25, when I had apparently run SilentKnight. As a bonus, I discovered from those that SilentKnight was stuck in app translocation, so have been able to fix that (again).

Logistician version 1.0 build 7 for macOS Sonoma and later is now available from here: logistician106
I will add it to other pages here when I’m more confident that this initial version is stable and does what it claims in its detailed Help book.

Enjoy!

Last Week on My Mac: Seconds out

In 1657, one of the great scientists of the Dutch Golden Age, Christian Huygens, invented the pendulum clock, the first timekeeping device accurate enough to make a second hand worthwhile, as it typically only lost about 15 seconds per day. It was another century before John Harrison developed his marine chronometer, a clock sufficiently accurate to enable precise determinations of longitude. Another hundred years later, with the coming of railways across Europe, ordinary people started synchronising clocks so they caught their train, and our ancestors soon became the first slaves to time.

I’m beginning to wonder whether Apple intends reversing that history. Have you not noticed something odd about setting times in more recent Mac apps, how few allow you to set the seconds? You can see what has happened over the last few years in my log browsers, Ulbow and LogUI.

Most of Ulbow’s interface was written using AppKit seven years ago, and it uses a standard Date Picker with elements containing the year, month, day, hour, minute and second. Given that you can get more than 10,000 log entries in a second, I would have preferred to offer decimal seconds, but that isn’t possible within the standard AppKit picker.

LogUI was written from the start using Apple’s more recent substitute for AppKit, SwiftUI, eighteen months ago. That doesn’t use the AppKit Date Picker, but has its shiny new DatePicker instead. Components available in macOS are there limited to year, month, day, hour and minute. To be able to include seconds your code must be written for an Apple Watch, as macOS, iOS and iPadOS don’t allow seconds at all. That’s why you have to enter them in a separate TextField, although that could perhaps allow the use of decimal seconds.

When I wanted to obtain higher resolution timestamps for log entries in LogUI, I discovered that standard date formatting in macOS only resolves to milliseconds (10^-3 second), and couldn’t stretch to microseconds (10^-6 second), let alone the nanoseconds (10^-9 second) that can be obtained from Mach absolute time, as used internally in parts of macOS. Even that reference has recently become lower resolution, as each ‘tick’ in Apple silicon Macs occurs every 41.67 nanoseconds, rather than once every nanosecond as in Intel Macs.

There’s another difference between Ulbow and LogUI with regard to timestamps that you’re less likely to be aware of: Ulbow obtains its log records indirectly using the log show command, which can include the Mach absolute time of each entry. Instead, LogUI accesses those entries direct through the more recent OSLog API, which doesn’t currently expose such precise times.

Lest this appear too far removed from the world of the user, look in the menu bar clock’s settings, and you’ll see Display the time with seconds is an option, but not the default. When the clock is shown on the Lock Screen or screensaver, it only displays hours and minutes, never seconds, neither can any of the digital clock widgets supplied with macOS. While the Clock app does support decimal seconds, that’s only permitted in its Stopwatch where hundredths are displayed, as they are on an Apple Watch and other devices.

This becomes stranger still when you consider the methods used to synchronise internal clocks. Since High Sierra, macOS has used its own timed service, which Apple describes as “synchronizing the clock with reference clocks via technologies like NTP”, that’s the Internet service provided by time.apple.com as in Date & Time settings. When accessed over the Internet, it’s generally accepted that NTP should be accurate to within tens of milliseconds, although that can at times worsen to 100 milliseconds or more.

As far as I’m aware, no Mac has ever had a GPS receiver built into it, but every iPhone apart from the earliest, and those iPads with cellular support, include assisted GPS and GLONASS. Those are capable of providing time accurate to about 100 and 200 nanoseconds respectively. Even my 11-year-old car corrects its clock using GPS.

Although our Macs and devices can share almost everything else now, my Macs appear unable to adjust their clocks to the more accurate time that should be available to my iPhone. But as iOS is so shy about displaying seconds anywhere, it makes me wonder whether iPhones make full use of GPS time, or mostly rely on that obtained from the nearest cellular mast.

I’m curious whether this is a deliberate campaign to abolish seconds wherever possible, or just the result of doing what looks sufficient. Maybe I’m a mere slave to time, and the Time Lords in Apple Park are on a mission to cure me by travelling back four centuries.

Last Week on My Mac: Signs of distress

Over the last few weeks, I’ve been posed a series of questions that can only be resolved using the log, such as why Time Machine backups are failing to complete. The common confounding factor is that something has gone wrong at an unknown time, but if you don’t know exactly what you’re looking for, nor when to look, the Unified log is a hostile place, no matter which tool you use to browse its constant deluge of entries.

This is compounded by the fact that errors seldom come singly, but often propagate into tens of thousands of consequential log entries, and those not only make the cause harder to find, but can shorten the period covered by the log. In the worst case, by the time you get to look for them, the entries you needed to find are lost and gone forever.

In late 2017, I experimented with a log browser named Woodpile that approached the log differently, starting from a histogram of frequencies of log entries from different processes.

keychainopen05

Viewed across the whole of a log file, this could draw attention to periods with frequent entries indicating potential problems.

keychainopen06

The user could then zoom into finer detail before picking a time period to browse in full detail. Of course, at that time the Unified log was in its early days, and entries were considerably less frequent than they are now today.

logchart05

A related feature in my later Ulbow log browser provides similar insights over the briefer periods covered, but like Woodpile that view seems little used, and isn’t offered in LogUI.

Another concern is that a great deal of importance can be recorded in the log, but the user is left in the dark unless they hunt for it. I documented that recently for Time Machine backups, and note from others that this isn’t unusual. Wouldn’t it be useful to have a utility that could monitor the log for signs of distress, significant errors or failure? To a degree, that’s what The Time Machine Mechanic (T2M2) sets out to do, only its scope is limited to Time Machine backups, and you have to run it manually.

Given the sheer volume and frequency of log entries, trying to monitor them continuously in real time would have a significant impact on a Mac, even if this were to be run as a background process on the E cores of an Apple silicon Mac. In times of distress, when this would be most critical, the rate of log entries can rise to thousands per second, and any real-time monitor would be competing for resources just when they were most needed for other purposes.

A better plan, less likely to affect either the user or the many background services in macOS, would be to survey log events in the background relatively infrequently, then to look more deeply at periods of concern, should they have arisen over that time. The log already gives access to analysis, either through the log statistics command, or in the logdata.statistics files stored alongside the folders containing the log’s tracev3 files. Those were used by Woodpile to derive its top-level overviews.

Those logdata.statistics files are provided in two different formats, plain text and JSON (as JSON lines, or jsonl). Text files are retained for a shorter period, such as the last four days, but JSON data are more extensive and might go back a couple of weeks. I don’t recall whether JSON was provided eight years ago when I was developing Woodpile, but that app parses the current text format.

Keeping an eye on the log in this way overlaps little with Activity Monitor or other utilities that can tell you which processes are most active and using most memory, but nothing about why they are, unless you run a spindump. Those also only show current figures, or (at additional resource cost) a few seconds into the past. Reaching further back, several hours perhaps, would require substantial data storage. For log entries, that’s already built into macOS.

I can already see someone at the back holding up a sign saying AI, and I’m sure that one day LLMs may have a role to play in interpreting the log. But before anyone starts training their favourite model on their Mac Studio M3 Ultras with terabytes of log entries, there’s a lot of basic work to be done. It’s also worth bearing in mind Claude’s recent performance when trying to make sense of log entries.

What do you think?

预言在应验:五年前所讨论的未来人机交互的新范式_6.ylog

从 2024 年的今天,回望 2019 年的 Apple 和 Ive 团队,我们会发现有些变化和趋势似乎是早已注定的。在过往的观察和分析中,我们所预言的事情正在成为现实和主流。常言道以史为镜可以知兴替,今天再看当时的 Apple 和 Ive 团队,关于产品的演进思路和设计策略的变化都早有端倪,也能预见在 AI 席卷的浪潮下,Apple 将会如何应对。

在这一期,你会听到:

—- 二十年前的专利文件:通体透光的 iPhone

—- 国产厂商和 Apple 在设计上的差异

—- 成功的设计:AirPods 只是剪掉线的 EarPods

—- 塑料手机的设计巅峰:iPhone 5c

—- 刘海与机器视觉:早早布局的 AI 伏笔

—- 未来十年的人机交互:人和人之间怎么交互?

—- 设计策略上的「S型曲线」体现在哪里?

—- 产品路径上迷路的 iPad

—- 光洁的划痕:是矫情还是哲学?

—- 史上最佳手机壳:iPhone 5c 的多彩硅胶壳

—- 拟物化的残党,现在理解扁平化的先进性了吗?

|相关图片|

首款 Unibody 设计于 2008 年 10 月发布
截图来自:Designed by Apple in California

查看更多图片和设计讨论:Mac Pro 2019

|拓展阅读|

如何评价 iPhone X 的工业设计?

交互的王,时代的狂!万字详解灵动岛的今生来世!

十年轮回?经典进化!工业设计师深入解读 iPhone12!

从技术寿命 S 曲线,看阳极氧化铝的设计

抽象的产品,用户「界面」的设计

如何看待 Evans Hankey 从 Apple 设计团队离职?

注定会离职的 Jonathan Ive 和科技产品的设计趋势

|登场人物|

苏志斌:工业设计师,车联网智能硬件产品经理 / 联创,《设以观复》作者

王汉洋:AI 行业从业者,多档播客主播,《拯救东北1910》《山有虎》作者

|相关链接|

若你所使用的播客客户端未能完整显示插图,或遇网络问题未能正常播放,请访问:

荒野楼阁 WildloG 的地址:https://suithink.me/zlink/podcast/

阅读设计相关的各类文章:https://suithink.me/zlink/idea/

|其他社交网络媒体|

苏志斌 @ 知乎|SUiTHiNK @ 即刻 / 微博

苏志斌SUiTHiNK @ Bilibili / YouTube / 小红书

|联络邮箱|

suithink.su@gmail.com

欢迎在 小宇宙、Spotify、YouTube、Apple Podcast 收听本节目,期待你的留言。

面向产品设计的 Web 前端分享会(分享会记录)

最近听说部门里面的产品或本地化运营对 Web 前端相关的内容比较感兴趣,正好我有相关的实践经验,所以在公司做了一个 Web 前端相关的分享会。分享内容包含:

  1. 使用 Devtools:介绍 Chrome 浏览器内的模拟、编辑和审查工具;
  2. 网页和部署:介绍 HTML, CSS, JavaScript, React,以及网站的部署和托管;
  3. 网页性能指标:介绍网页性能常用指标和测量工具;
  4. 资源分享:分享浏览器插件、网站和课程推荐。

与以往不同的是,这次分享会中加入了互动环节。我做了一个代码 Playground,尝试帮助观众了解 React,以及 React Props 的概念,并留了两个小任务,给观众尝试去实践对 React 项目进行编码。

完整的分享内容内容请继续浏览本文。

使用 Devtools

这个章节主要介绍 Chrome Devtools 一些可能不为人知的功能,来帮助我们提高日常工作中的效率和解决一些问题。先介绍 Devtool 里面「模拟」相关的功能。

模拟设备和屏幕尺寸

在 Devtool 里打开设备工具栏,在这里除了能够自由调整网页宽高,还能够模拟各种主流设备的屏幕。

甚至还能读取到网页里面的断点样式,提供快捷切换各种断点的方式。

需要注意的是,这里模拟的设备是会带上 UA 的,所以如果想在电脑里调试一些做了移动端特化处理的网站(比如访问主域名时,判断到是手机设备,则会跳到移动端的专门网站),是需要用到这个功能的。

模拟伪类

Devtools 还可以帮助我们排查各种交互状态下的样式问题,最常用的是,比如说我们想仔细排查某个元素的悬停和按下状态的样式,则可以在选中元素之后,勾选对应的伪类选项。

模拟媒体

在渲染面板(需要手动开启,浏览器默认是没有打开这个面板的)能够模拟部分系统设置,比如亮暗模式、打印模式、高对比度和减少动态效果等。

与之对应地,可以扩展一个概念叫做 CSS 的媒体查询,CSS 还可以探测到很多用户设备的属性或者设置,比如设备指针精度、视窗比例、当前是否全屏模式、设备方向等…

能探测的内容很多,但实际能用起来的可能只有寥寥数个,最全面的信息可以取 MDN 上查看。

编辑网页文字样式

Devtools 还提供了一个新的字体编辑器,能够让我们实时更改网页中的字体家族、字体大小、字重等属性。

编辑网页内容

我们在 Devtools 控制台里面执行代码document.designMode = 'on' 后,就可以实时在本地修改网页文字内容了,就跟平常打字一样。很适合用在测试文案长度的场景。最后也会分享一个浏览器插件,能够对网页做更多的编辑。

审查 React 组件

最后介绍一个审查 React 组件的方法,有时候我们想看某个元素是不是用的组件库,或者这个组件包含了什么属性之类的,可以下载 React Developer Tools,然后点选网页中的任意元素,进行审查。

网页和部署

接下来我介绍一下网页构成和网站部署相关的内容。

通常来说,HTML, CSS, JavaScript 是构成网站的三个要素。其中:

  • HTML 用来用于定义网页的结构和内容,可以用来创建网站的各个部分,比如标题、段落、图片、链接等。
  • CSS 用来定义网页的样式和布局,这个可能会是咱们设计师比较熟悉的部分,我们能够利用 CSS 来定义 HTML 元素的各种样式,控制它们的布局和位置。
  • JavaScript 用来实现各种功能逻辑和操作交互。比如响应点击事件、动态修改网页内容,根据条件执行动画效果或展示特定内容等。

CSS 预处理器

上述的三种语言,都有各自对应的语法规则。而 CSS 预处理器,则改进了原有的 CSS 语法,使我们能使用更复杂的逻辑语法,比如使用变量、代码嵌套和继承等。

简单来说,CSS 预处理器能让我们写样式代码的过程更顺畅,使代码有更良好的可读性和扩展性,帮助我们更好地维护代码。

举个简单的例子,比如原本的 CSS 语法中要求我们给每一个元素写样式时,必须以花括号开始和结尾,而且每一条样式规则直接都要以分号隔开,而 Stylus 则能够让我们跳出这个限制。直接用换行和缩进来代替。

CSS 框架

另一个值得一提的概念是 CSS 框架。CSS 框架则提供了一套预设样式,比如颜色板、字体梯度,布局和断点设定等;以及一些常用组件,如导航栏、对话框和页脚等。

简单来说,就是提供了一批开箱即用的样式,便于开发者快速启动项目,同时也会保留高度自定义的空间,用于支持各种各样的需求。通常 CSS 框架都会包含使用某个 CSS 预处理器,甚至内置了一些图标库,主打一个 “开箱即用”。

这里稍微介绍一下一个 CSS 框架:Tailwind CSS。是一个高度定制化的 CSS 框架,通过大量的预定义类名,使开发人员快速构建和设计网页界面。

与其他 CSS 框架相比,有一个显著的特点是 Tailwind CSS 本身不会包装一个组件出来,比如按钮、输入框的样式,没有预设好的。取而代之的是,Tailwind CSS 将各种原子级的 CSS 类名包装起来,比如:

  • 设置左右两边的 Padding,用 px-[...] 类名来实现;
  • 设置一个元素为块级元素, 用block 类名来实现…

如果想要在 TailwindCSS 中,使用打包好的组件,达到开箱即用的效果,可以通过各种官方/非官方的模版或组件生态来进行。比如:

React

接下来介绍另一个概念:React。这是一个用于构建 Web 和原生交互界面的库(是的,它能够用来做 App,不仅仅是网页)。而且引入了 JSX 语法,将 HTML 和 JS 结合起来,以一种更直观和易于理解的方式描述界面的结构和内容。

React 有一点和我们的设计稿很像,就是它的组件思维。在构建用户界面时,React 主张先把内容分解成一个个可以复用的组件(把具体的交互、功能逻辑写在组件里面)。然后在页面中将各个组件连接起来,使数据流经它们。

下图引用了官网中的一个例子,其中:

  1. 完整的应用,可以理解为由多个组件拼接成的完成网页;
  2. 搜索组件,用来获取用户输入;
  3. 数据列表,会根据用户搜索来过滤和展示内容;
  4. 每个列表的表头;
  5. 表格内每条数据。

现在我们用一个具体例子来简单介绍下 React 的组件。

在上图中,展示了一个页面页面 App.jsx 包含了 Profile、Gallery 和 FAQ 组件,以及 Profile.jsx 组件的代码。右侧是输出页面,展示了三个组件拼接而成的页面效果示意图,其中 Profile 组件模块里展示的内容,是和 Profile.jsx 文件内代码一一对应的。

上述的组件只是将一个模块包装起来,使其能够被其他地方复用。但组件内容是固定的。接下来会为大家展示如何向组件传递 Props,实现上文提到的一句话 “使数据流经他们” 。

在上图中,我们先将一些 Props 传递给组件 Profile(比如这里传递了图片的地址、人物姓名和描述),然后在 Profile 组件内接收这些 Props,并在组件代码内使用这些数据。

现在,我们就做出了一个可以复用的组件了,可以根据不同的内容来展示相关的人物信息。

大家有没有觉得这种做法有点熟悉?是的,在 Figma 中,我们的组件里面也有类似的做法。Figma 组件同样同样传递字符串、布尔和组件等内容。

实际上 React 组件可以传递的参数不仅仅只是上面例子中的字符串和布尔值,还能传递数值、函数、对象、Node 类型甚至另一个组件等。

我做了一个简单的 Playground,提前封装好了一个 Profile 组件,会传递一些字符串、布尔值(是否展示网站标签)以及数值(圆角大小),帮助大家更好地理解。

🛝 Playground

我做了一个 🛝 Playground ,大家可以在里面看到这个组件的具体的情况,实际看一遍代码可能会帮助理解 React 的组建和 Props 概念。

同时我也写了两个小任务给到大家去尝试,大家可以在上面的编辑器中自由尝试。

发布网站

到了这里,相信大家对构建一个网站已经有了初步的认识,接下来我为大家介绍下如何将构建好的网站发布的互联网当中,能够真正地被世界各地的人们浏览。

方法一:部署到服务器

这是比较传统的方法,先将项目相关的文件放进服务器里面(比如阿里云 ECS,或轻量服务器等)。然后在服务器内安装 NGINX,索引到项目文件夹,定义好首页、端口、404 等场景,最后将域名解析到服务器 IP。之后我们的网站就能在互联网上被人们访问了。

方法二:托管到服务商

这种是相对省心的方法,将我们项目所在的 GitHub 仓库,链接到服务商的托管服务当中。等于是由服务商来帮我们部署、发布项目,不用自己来配置服务器的各种内容了。下图列举了几种常见的网站托管服务商,分别是:Vercel,Github Pages 和 Netlify。

以 Vercel 来举例,除了能够托管网站之外,对每一次发布进行管理,甚至能够是对不同代码分支进行独立发布,还能收集网站访问数据等。

网页性能

接下来为大家介绍网页性能相关的内容。通常一个网站性能好不好,我们能够在体验时主观地感受到,比如打开时很慢、滚动时卡顿,或者点击按钮后很久才响应等等。但如果要准确地判断到网页的性能到底如何,是需要依赖具体指标的。

下面介绍三个常用的指标,分别是:FCP(首次内容绘制)、LCP(最大内容绘制)以及 CLS(积累布局偏移)。

FCP(首次内容绘制)

FCP 是一个关键指标,用来测量页面从开始加载到第一个页面内容在屏幕上完成渲染的时间。越快的 FCP 时间能够让用户感知到网页有在正常运行,而不是停滞、无响应。

这里提到的 “内容” ,指的是文本、图像(包括背景图像)、<svg>元素或非白色的<canvas>元素。如下图所示,FCP 出现在第二帧。

LCP(最大内容绘制)

LCP 指的从页面开始加载到可视区域内可见的「最大图像」或「文本块」完成渲染的时间。

这里提到的「最大图像」或「文本块」,具体来说是包含<img>元素、内嵌在<svg>元素内的<image>元素、块级文本等。

而测量方式,则是在页面加载过程中,记录视窗内的元素的渲染大小,取尺寸最大的元素,回溯这个元素被完整渲染的时间。注意,如果元素的有一部分在视窗外,在视窗外的部分不会参与到尺寸比较当中。

如下图所示,LCP 发生在第二帧,因为这个时候渲染尺寸最大的文本块被渲染出来了。后续帧当中,可能渲染出了一些图片,但尺寸都比文本块小,所以文本块依然是这个视窗内的最大元素。

CLS(积累布局偏移)

CLS 是指可视区域内发生的最大布局偏移分数。简单来说就是测量页面在加载时,元素的位置出现意外的偏移情况,如果元素尺寸大,而且位置偏移比较远,那么 CLS 分数就会显著增高。

这个指标会跟实际的用户操作或者体验有直接相关,所以应该也会是咱们设计师需要重点关注的内容,因为有时候布局偏移,是会比较影响用户获取信息、或者进行操作,甚至引发一些不可挽回的损失。

然后我来介绍一下测量网页性能的工具吧。我自己用过这两个,发现其实没啥差别,大家看喜好使用即可:

两个工具都能模拟桌面设备或者移动设备,记录多项关键指标的数据,并给出改进建议。

观察页面性能情况,不仅仅是前端技术人员要做的事情,了解到设计师也是可以参与到其中的。

比如 Guillaume Granger,他会比较想控制页面中 JavaScript 的数量,所以它提到,他会将所有用了 JavaScript 相关信息记录在表格当中。之后每次在网页中使用 JavaScript 时,都会跟之前的记录进行比对,判断重要性,决定是否在这个位置上使用 JavaScript。

开发者 Thomas Kelly 则提出了当意识到页面性能出现瓶颈时,需要做的事情,比如:

  • 制定一个目标,团队一起往这个目标前进;
  • 高频收集页面性能数据;
  • 尝试用不同方式来解决同一个问题;
  • 与同伴分享对性能的一些新发现…

资源分享

最后来分享一下相关的资源吧,包含两个插件、三个学习网站以及一个 React 课程。

插件:VisBug

介绍一个谷歌官方出品的插件:VisBug,主要用来帮助用户在浏览网页时进行调试和设计,包括编辑和可视化页面的 CSS,尺寸和字体等元素。

插件:Motion DevTools

Motion DevTools 是一个检查网页动效的插件,可视化和分析用户交互设计中的滚动、动画效果,并支持实时编辑、预览或导出等功能。

网站推荐

接下来介绍三个在国内外拥有较高知名度和影响力的设计师和开发人员。他们的观点、经验分享往往能给我带来一些新的启发。尤其是他们对钻研新技术的热情,是非常强烈的。

课程推荐

最后强烈推荐一门 React 课程——The Joy of React,这个课程我在年初的文章也有提到过,是以互动式课程的形式,由浅入深地讲解 React。从基础的组件 props 和 JSX 知识,到 Hooks、API 设计等等,讲述非常清晰,强烈推荐。

分享会感想

分享完之后感觉效果可能还不错,大家都有各自的收获。而且分享会中也不时有人提出相关问题,我也一一进行解答了。

或者也有对我分享内容的一些补充,比如我在分享完 Devtools 环节的时候,有同事也分享了一个在 Application — Cookie 面板里快速切换网页语言的方法。

后面了解到大家对于 CSS 和 React 那块听的比较迷糊,因为原本没有实践过的话,会对这些没有什么概念。而且大家好像对 🛝Playground 没有什么兴趣,并没有人对里面的内容有什么提问和看法之类的,可能到这一步都比较迷糊?🤔

指标那块倒是有不少同事关心,问了几个问题,比如有哪些方法来去改进几个指标的数据,或者在设计过程中是否可以提前避免性能问题等等。

总体来说和之前的分享会相比,这次分享会的参与度比较不错。

MIUI稳定版12.0直升12.5开发版方法

从网络反馈来看,最新的 MIUI 12.5 无论是在系统流畅性上还是隐私保护上,都有非常明显的提升,我在升级之后的第一感受就是系统真的很流畅,比我上一个 MIUI 12.0.7 稳定版有非常大的提升。MIUI 12.5 虽然是测试版系统,但是稳定性和完成度上都很高,推荐大家都升级。关于 MIUI 12.5 的官方介绍页面:https://home.miui.com/MIUI 测试版系统的常规升级方法,是需要去官方申请内测或公测名额。但是现在官方内测和公测通道都已经关闭,想借用别人已经有权限的小米账号,又有隐私泄露的风险。这里就介绍一个非常规方法,也被很多人戏称为替换安装包的「偷渡法」。【方法及步骤简介】1、下载好可以升级的 MIUI 12.5 内测版安装包(A包);这是小米官方 MIUI 安装包的 GitHub 下载页面:https://github.com/mooseIre/

❌