When the same unusual dialog appears twice within a few days for two different people, you begin to suspect a pattern. This article explores a rabbit hole that involves git, the log and the fickleness of AI.
On 8 March, Guy wondered whether an XProtect update earlier this month could have been responsible for a dialog reading The “git” command requires the following command line developer tools. Would you like to install the tools now? As the request seemed legitimate but its cause remained unknown, we mulled a couple of possible culprits, and he went off to investigate.
Five days later, after he had installed the update to SilentKnight 2.13, Greg emailed me and asked whether that might be responsible for exactly the same request appearing on his Mac. This time, Greg had consulted Claude, which asked him to obtain a log extract using the pasted command log show --start "2026-03-13 07:07:00" --end "2026-03-13 07:10:00" --style compact --info | grep -E "14207|spawn|exec|git|python|ruby|make"
Armed with that extract, Claude suggested that SilentKight had been the trigger for that dialog.
I reassured Greg that, while SilentKnight does rely on some command tools, it only uses those bundled with macOS, and never calls git even when it’s feeling bored. While I was confident that my app couldn’t have been responsible, I wondered if its reliance on making connections to databases in my Github might somehow be confounding this.
While I knew Claude was wrong over its attribution, the log extract it had obtained proved to be conclusive. Within a few minutes of looking through the entries, I had found the first recording the request for command line tools: 30.212 git Command Line Tools installation request from '[private]' (PID 14205), parent process '[private]' (parent PID 14161)
30.212 git Command Line Tools installation request from '[private]' (PID 14206), parent process '[private]' (parent PID 14161)
As ever, the log chose to censor the most important information in those entries, but it’s dumb enough to provide that information elsewhere. All I had to do was look back to discover what had the process ID of 14161, as its parent. Less than 6 seconds earlier is: 24.868 launchd [pid/14161 [Claude]:] uncorking exec source upfront
Just to be sure, I found matching entries for SilentKnight and the system_profiler tool it called after the attempt to run git: 30.153 launchd [pid/14137 [SilentKnight]:] uncorking exec source upfront
30.336 launchd [pid/14139 [system_profiler]:] uncorking exec source upfront
There was one small mystery remaining, though: why did Claude’s log show command also look for process ID 14207? That was the PID of the installondemand process that caused the dialog to be displayed: 30.215 launchd [gui/502/com.apple.dt.CommandLineTools.installondemand [14207]:] xpcproxy spawned with pid 14207
Following its previous denial, when Claude was confronted with my reading of the log, it accepted that its desktop app had triggered this dialog. Its explanation, though, isn’t convincing:
“the Claude desktop app calls git at launch — likely for one of a few mundane reasons like checking for updates, querying version information, or probing the environment. It’s not malicious, but it’s poorly considered behavior for an app that can’t assume developer tools are present on every Mac.”
In fact, it was Guy who had probably found the real reason, that the Claude app has Github as one of its four external connectors. However, that shouldn’t give it cause to try running the git command, resulting in this completely inappropriate request.
Conclusions
Claude might know how to use the log show command, but it still can’t understand the contents of the Unified log.
If you’re ever prompted to install developer command tools to enable git to be run, suspect Claude.
What a fickle and ever-changing thing is an AI.*
I’m very grateful to Greg and Guy for providing the information about this curious problem.
* This is based on a well-known English translation of a line from Virgil’s Aeneid, Book 4: “Varium et mutabile semper femina”, “what a fickle and ever-changing thing is a woman”. While all of us should dispute that, there’s abundant evidence that it’s true of Claude and other AI.
One of the most contentious questions arising from yesterday’s critical examination of ChatGPT’s recommendations, is how long does the Unified log keep entries before they’re purged? ChatGPT seemed confident that some at least can be retained for more than a month, even as long as a year. Can they?
Traditional text logs are removed after a fixed period of time. One popular method is to archive the past day’s log in the early hours of each morning, as part of routine housekeeping. Those daily archives are then kept for several days before being deleted during housekeeping. That’s far too simple and restrictive for the Mac’s Unified log.
Apple’s logs, in macOS and all its devices, are stored in proprietary tracev3 files, sorted into three folders:
Persist, containing the bulk of log entries, retained to keep their total size to about 525 MB in about 50-55 files;
Special, including fault and error categories, whose entries are slowly purged over time until none remain in the oldest log files, so have a variable total size and number.
Signpost, used for performance measurements, which also undergo slow purging until they vanish.
One simple way to estimate the period for which log entries are retained is to find the date of creation of the oldest log file in each of those folders. On a Mac mini M4 Pro run largely during the daytime, those dates were
Persist, earliest date of creation 7 March 2026 at 16:54
Special, 9 February 2026 at 19:41
Signpost, 3 March 2026 at 16:41
when checked on 10 March. Those indicate a full log record is available for the previous 3 days, followed by a steady decline with age to the oldest entry 31 days ago. That compares with statistical data available in my app Logistician going back as far as 14 January, although all entries between then and 9 February have now been removed and lost.
Retrieving old log entries
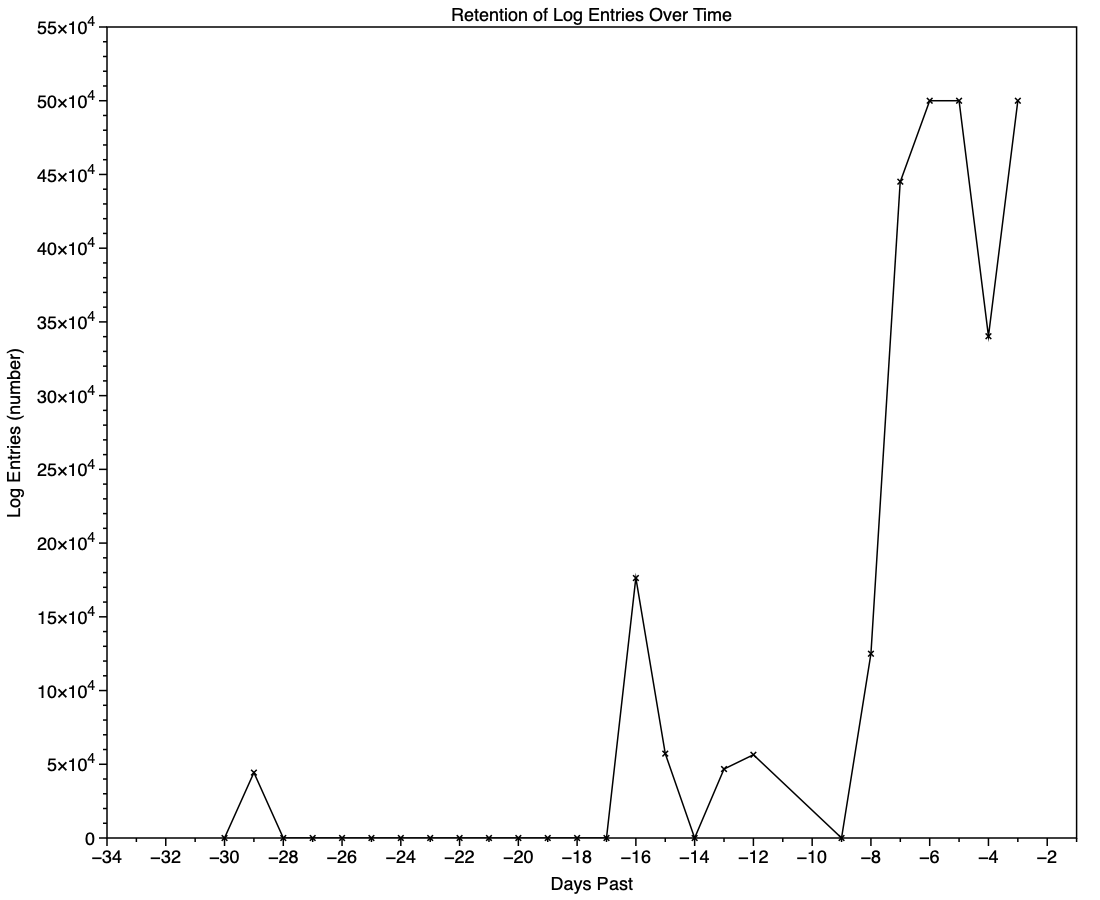
The real test of how many log entries have been retained is to try to retrieve them. Although the oldest Special log file was created on 9 February, the oldest log entry I could retrieve was the start of the boot process on 11 February, in Special log files returning a total of over 44,000 entries for that day. However, no further log entries could be found after those until the morning of 24 February, a gap of over ten days.
This chart shows the numbers of log entries that could be found and read at intervals over previous days. Where a total of 500,000 is shown, that means over 500,000 for that 24 hour period. I checked these using two different methods of access, using the OSLog API in LogUI, and via the log show command in Ulbow. In all cases, log show returned slightly fewer than OSLog.
It’s clear that with only 3 days of full Persist log files, very few entries have been retained from earlier than 7 days ago, and beyond that retention numbers are erratic.
Over the period prior to the oldest Persist file, when entries could only be coming from Special log files, those included both regular and boundary types, and categories were diverse, including fault, error, notice and info, and weren’t confined to the first two of those categories. Most subsystems were represented, but very few entries were made by the kernel. There is thus no obvious pattern to the longer retention of entries in Special files.
Ephemeral entries
Log entries are initially written to memory, before logd writes most of them to permanent storage in tracev3 log files on disk.
The first substantial purging of entries thus occurs when logd decides which are ephemeral and won’t be retained on disk. This can be seen by following the number of entries in a short period of high activity in the log, over time, and is shown in the chart below for a sample period of 3 seconds.
When fetched from the log within a minute of the entries being written, a total of 22,783 entries were recovered. Five minutes later there were only 82% of those remaining. Attrition of entries then continued more slowly, leaving 80% after 8 hours. Analysis suggests that over this period in which there were about 6,100 log entries per second written to disk, approximately 1,700 log entries per second were only kept in memory and never written to disk. That suggests about 22% were ephemeral, a proportion that’s likely to vary according to the origin and nature of log entries.
Summary
A fifth of log entries are likely to be ephemeral, and lost from the log within the first minutes after they’re written.
Most retained log entries are written in Persist logs, where tracev3 files are removed by age to keep their total size to just over 500 MB. Those should preserve the bulk of log entries for hours or days after they’re written.
Entries stored in Special log files may be retained for significantly longer, here up to a maximum of 29 days. Although those may contain fault and error categories, retention doesn’t follow an obvious pattern, making their period of retention impossible to predict.
In practice, the period in which a fairly complete log record can be expected is that applied to Persist files, which varies according to the rate of writing log entries. In most cases now that’s unlikely to be longer than 5 days, and could be less than 12 hours.
You can’t draw conclusions from the apparent absence of certain log entries from the log prior to the earliest entries in Persist log files, as it’s likely that those entries will have been removed.
Expecting to retrieve log entries from earlier than 5 days ago is almost certain to fail.
There’s a striking difference between troubleshooting recommendations made by AI and those of humans. If you’ve tried using AI to help solve a problem with your Mac, you’ll have seen how heavily it relies on commands typed into Terminal. Look through advice given by humans, though, and you’ll see they rely more on apps with GUI interfaces. Rather than sending you straight to fsck_apfs, for instance, most humans will prefer to direct you to Disk Utility and its First Aid feature.
This is because most popular AI like ChatGPT, Claude and Grok is based on LLMs, Large Language Models, built on tokens for words. The great majority of humans using Macs work primarily in its GUI, using apps rather than Terminal commands. Verbalising the use of GUI apps is relatively difficult, and with the popularity of YouTube rather than written blogs, is becoming a dying art.
Command tools are all very well, but in this context they have disadvantages, among them being:
Few understand the commands used, and AI seldom explains those provided unless explicitly asked to do so. This results in the human learning little other than a long list of incomprehensible commands, and acquiring neither understanding nor insight.
Commands often lack the safeguards normally built into in apps, so can more readily cause damage or mislead.
Commands can readily generate overwhelmingly large output, even when piped to a file for later browsing.
Pasting commands into Terminal has become a favourite way to trick the unsuspecting into installing malware.
Even for an advanced user, confident assertions made by an AI can mislead. Here’s an example taken from ChatGPT’s advice on potential detections of malicious software. For this I have set ChatGPT’s output in italics, together with its commands as code. It’s worth noting that each command was explicitly given for the bash command shell, although in macOS Catalina (in 2019) Terminal changed to use zsh rather than bash as its default.
ChatGPT starts this exchange with a teaser that few could resist: If you want, I can also show you how to tell in 10 seconds whether a Mac actually has malware despite these logs (there are 3 very specific indicators in Console).
Vague predicate
Here’s the most reliable way to see if macOS has ever detected malware on your Mac using Apple’s internal security logs.
1. Check the XProtect malware history
Open Terminal and run: log show --predicate 'subsystem == "com.apple.XProtectFramework"' --last 30d
This log show command doesn’t access “Apple’s internal security logs”, which don’t exist, but the Unified log. Nor does the recommendation use Console to access the log, as promised. The predicate given is too non-specific to be useful for the stated purpose, and the time period of 30 days is absurdly long and doesn’t match the claimed period either.
On my Mac with the longest log records, its oldest Special tracev3 log file was created on 9 Feb 2026, and now has only 43 KB left from its original size of 11,298 KB, and the next oldest from 10 Feb has 34 KB left from 11,148 KB. On an older Intel Mac, the oldest creation date of a Special log file was 6 March, just 4 days previously, not 30.
When run on the first of those on 10 March, with longer log records, that log show command returns two Fault entries from 11 Feb, and more complete records from Special logs starting on 2 March, but no full log records until 6 March.
The predicate used is too general to select useful entries and is overwhelming, as it returns a total of 1,505 log entries for that command.
Log entries a year old
2. Specifically check for remediation events
To filter just real detections: log show --predicate 'eventMessage CONTAINS "remediat"' --last 365d If nothing prints, no malware has been removed in the last year.
ChatGPT here defines “real detections” as those for which remediation was attempted. I know of no evidence from research to support that assumption. Given the limitations in retrieving log entries from 30 days noted above, it seems absurd to assume that any log entries will be retained from over 360 days ago.
ChatGPT has here redefined its original claim to limit it to malware that was blocked by Gatekeeper, and once again assumes it can retrieve log entries from over 360 days ago.
No verification
4. Verify XProtect definitions are current
Run: system_profiler SPInstallHistoryDataType | grep -i xprotect You should see recent updates like:
XProtectPlistConfigData
XProtectPayloads
Apple updates these silently in the background.
This is one of its most curious recommendations, as system_profiler is the command line interface to System Information, a familiar and far more accessible app. What that command does is look for the case-insensitive string “xprotect” in the Installations list. Unfortunately, it proves useless, as all you’ll see is a long list containing those lines, without any dates of installation or version numbers. On my older Mac, piping the output to a file writes those two words on 6,528 lines without any other information about those updates.
I know of two ways to determine whether XProtect and XProtect Remediator data are current, one being SilentKnight and the other Skint, both freely available from this site. You could also perhaps construct your own script to check the catalogue on Apple’s software update server against the versions installed on your Mac, and there may well be others. But ChatGPT’s command simply doesn’t do what it claims.
How not to verify system security
Finally, ChatGPT makes another tempting offer: If you want, I can also show you one macOS command that lists every XProtect Remediator module currently installed (there are about 20–30 of them and most people don’t realize they exist). It’s a good way to verify the system security stack is intact.
This is yet another unnecessary command. To see the scanning modules in XProtect Remediator, all you need do is look inside its bundle at /Library/Apple/System/Library/CoreServices/XProtect.app. The MacOS folder there should currently contain exactly 25 scanning modules, plus the XProtect executable itself. How listing those can possibly verify anything about the “system security stack” and whether it’s “intact” escapes me.
Conclusions
Of the five recommended procedures, all were Terminal commands, despite two of them being readily performed in the GUI. AI has an unhealthy preference for using command tools even when an action is more accessible in the GUI.
None of the five recommended procedures accomplished what was claimed, and the fourth to “verify XProtect definitions are current” was comically incorrect.
Using AI to troubleshoot Mac problems is neither instructive nor does it build understanding.
AI is training the unsuspecting to blindly copy and paste Terminal commands, which puts them at risk of being exploited by malicious software.
If you’re still struggling to find your way around the log, or not even prepared to try, I have a new version of my log statistics and navigation utility Logistician that should help. This enhances its list of log files by adding further details, and adds a completely new graphical view to help identify periods of unusual log activity.
Log list
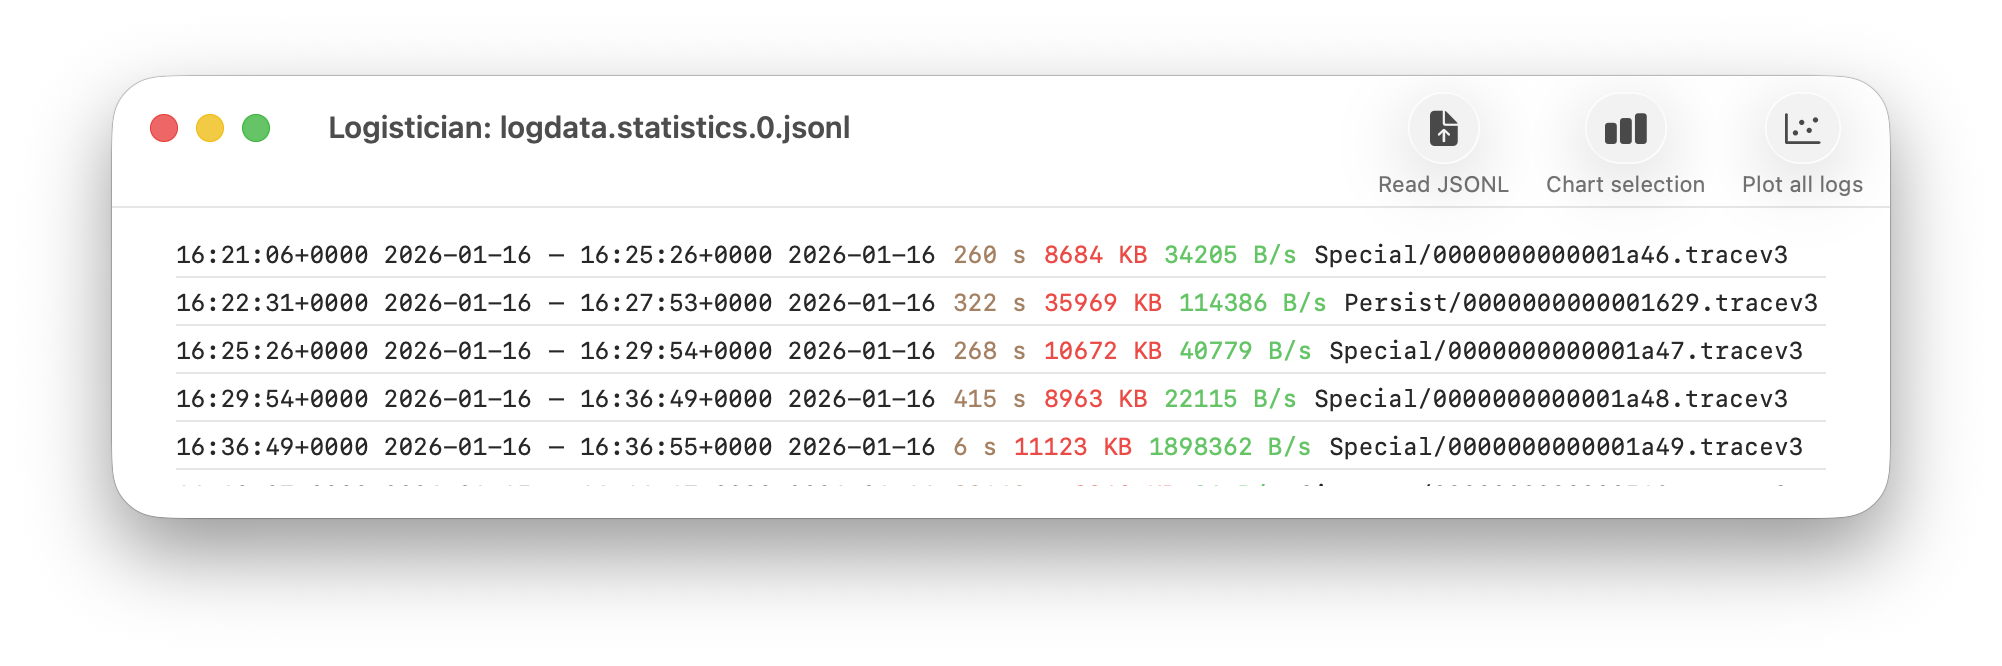
As I showed here a couple of days ago, Logistician opens the JSONL statistics files maintained by logd in /var/db/diagnostics, alongside folders containing the tracev3 log files. The list of those originally gave a minimum of information, and that has been increased to contain:
the start date and time of each file, in addition to the date and time it was closed
the period during which that file had entries added to it, in seconds
the size of log data within the file, in KB
the average rate at which log data was written to that file, in B/s
the path to that file, which reveals whether its type is Persist, Special or Signpost, hence the nature of its contents.
Start date and time are taken from those for the closing of its predecessor, so can’t be given for the first file of each type. They can also span a period during which the Mac was shut down, although that’s usually obvious from the low rate at which log data was written.
Point plot
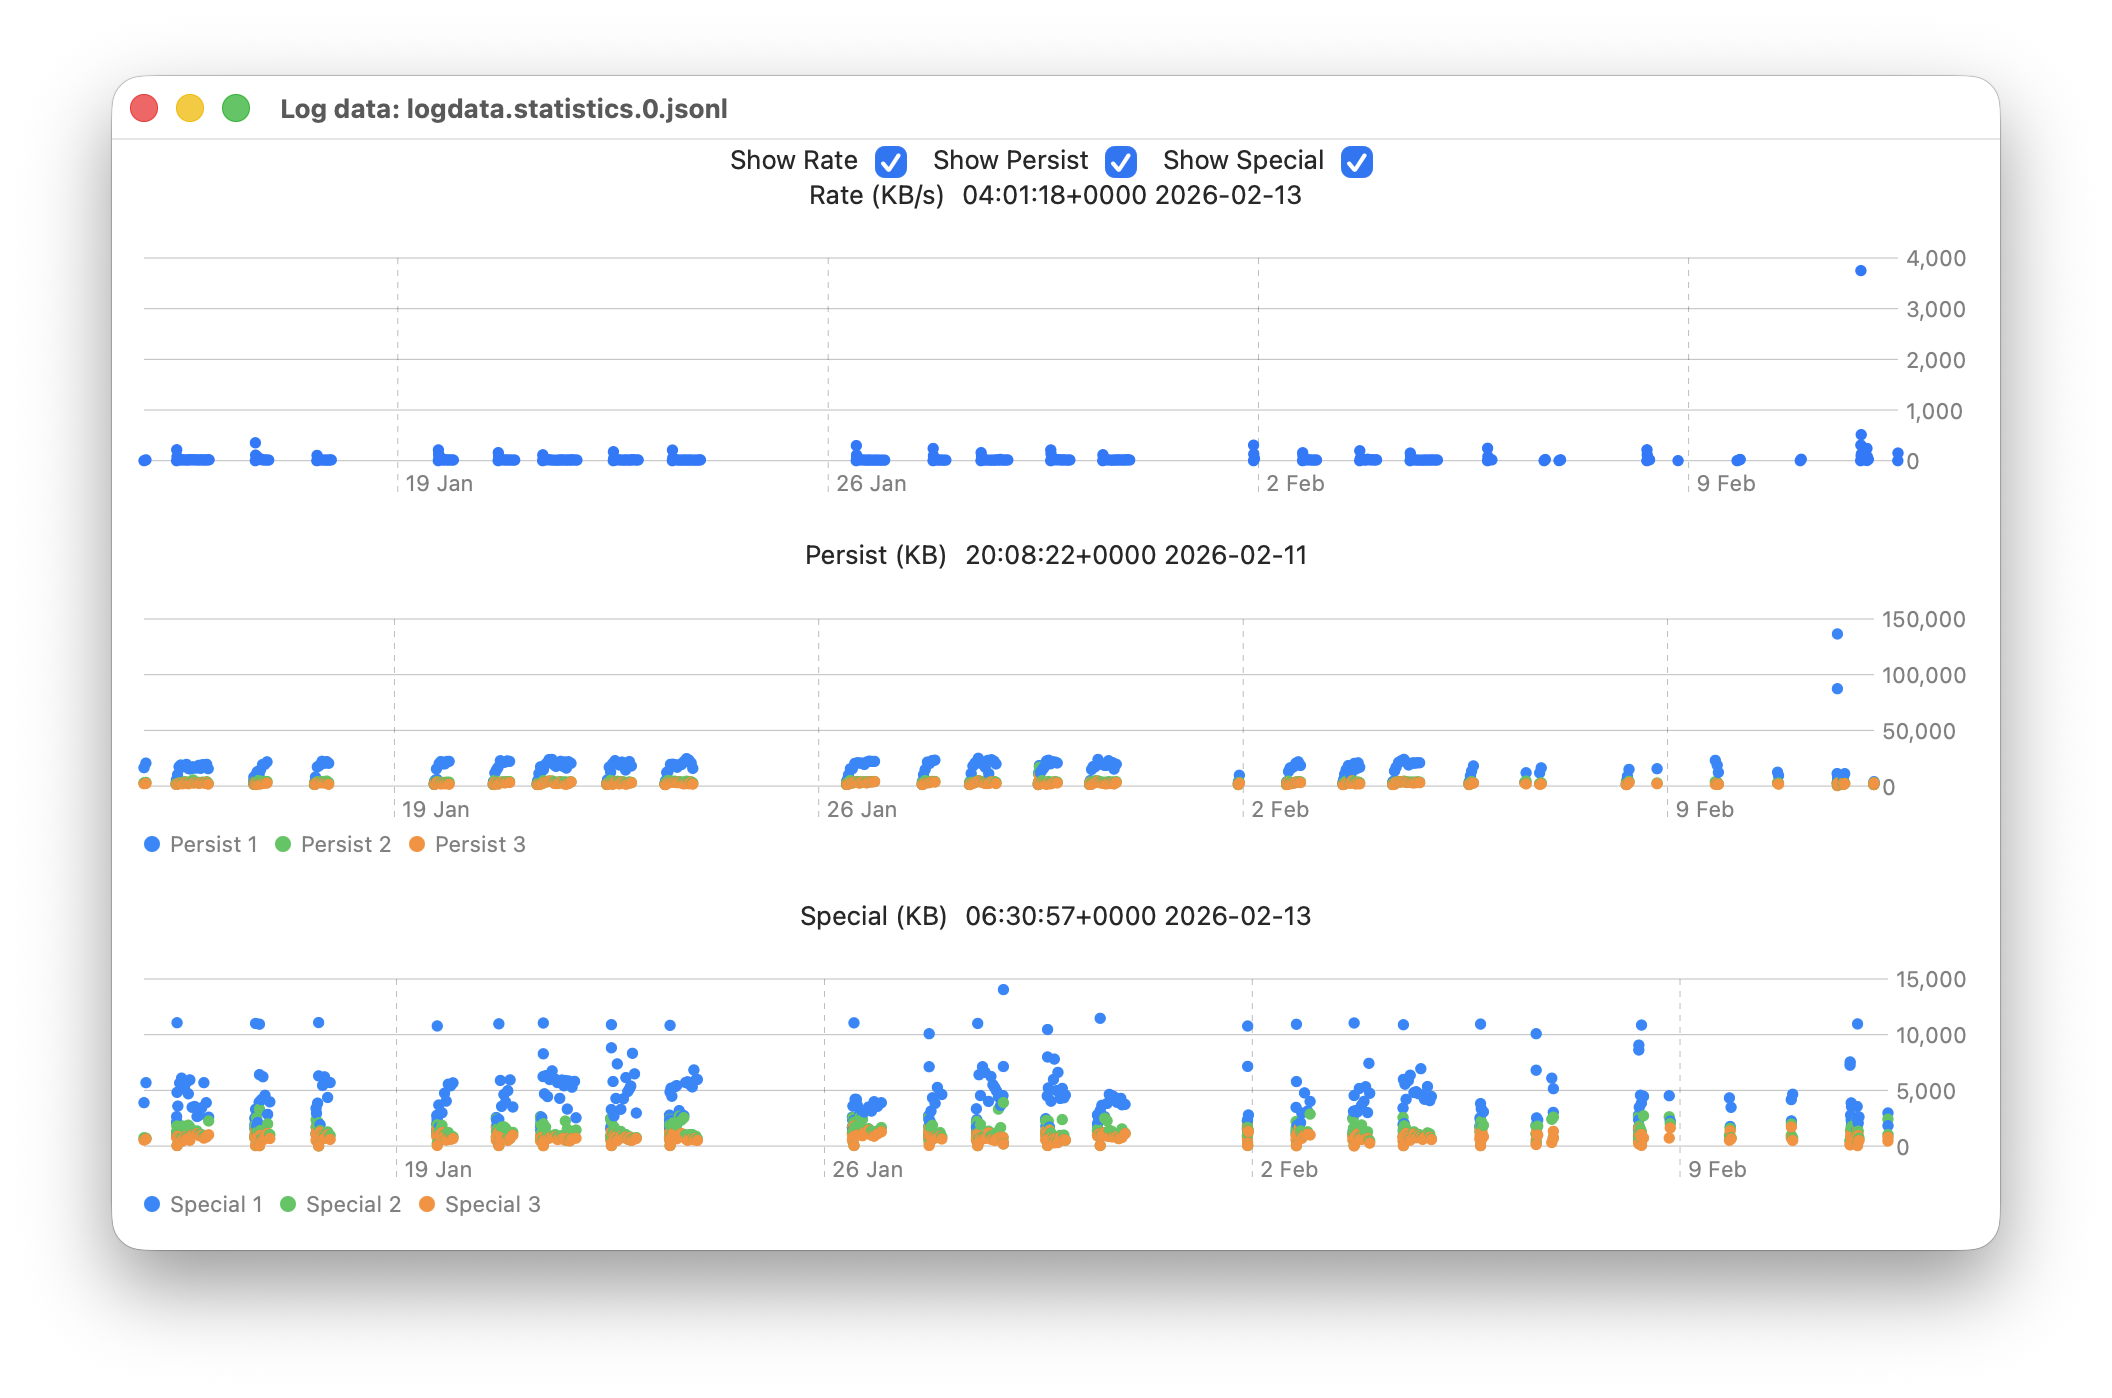
The new window available plots point values for the whole series of log files in the current list.
This displays any of three different plots:
rate of log data written to Persist log files over the period for which log files are listed, in B/s;
amount of log data written to Persist log files over that period, in KB;
amount of log data written to Special log files over that period, in KB.
For the latter two, quantities shown are for the three processes that entered the largest data in that period. I have looked at identifying the processes concerned, but that’s far too complex to do here.
Signpost log files contain special types of entry intended to be used to assess performance, and contribute little to other analyses, so are excluded from these plots. Regular log entries are either saved to Persist or Special types, although it’s unclear as to which entries go to each. Some processes only appear to use one, although the entries for many processes can be saved to either. Although there are similarities in the patterns of Persist and Special files, they also differ in other respects. These three plots appear most suitable when looking for anomalies in the log.
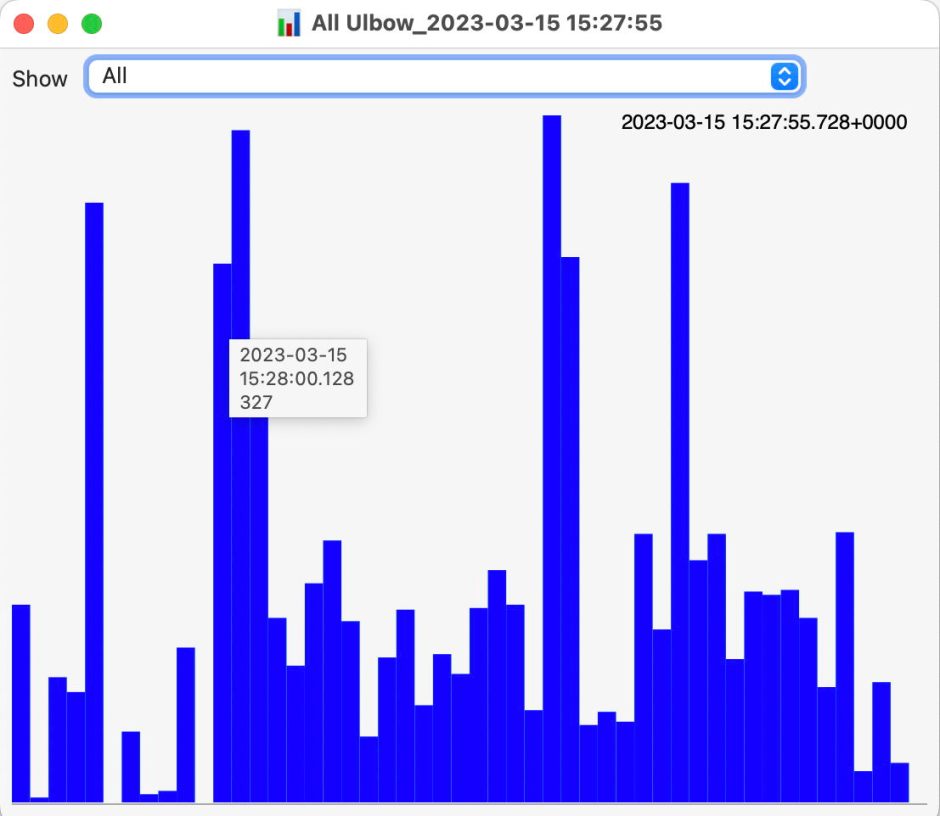
Although these plots make it easy to identify the date of an anomaly such as the high outliers at the far right, for 11 February, they can’t tell you the time of the file you should analyse. For that, Logistician reports the time and date of the location that the pointer is hovering over. Place the pointer over the high rate value, for example, and you’ll see it occurred at about 20:14:00. This helps you identify which of the listed log files has that high peak rate, hence the time period to inspect using LogUI.
Traditionally, the moment you move the pointer from a chart area, hover information like that is removed. If that were done here, it would make it infuriatingly hard to refer to the list of log files. So these dates and times show those at the last moment the pointer was over that point plot. The knack is to hover over the point of interest, then move the pointer off that chart vertically, so as not to alter the time indicated. I’m looking at alternative methods of locking the time shown, to make that easier, but that presents more complex coding challenges, as do methods of zooming in on smaller periods of time.
In case you’re wondering, the overall period covered by these point plots, divided across the two log statistics files maintained, is approximately 6 weeks, as indicated by the X scales shown here.
Logistician version 1.1 is now available for Sonoma and later from here: logistician11a
and will shortly be getting its place in a Product Page and other listings here.
Enjoy!
Update: thanks to Jake for finding a divide by zero bug that could crash Logistician when opening a JSONL file. I have fixed this in build 14, now available above. Please download that and replace copies of the original build 12, so you shouldn’t encounter that crash. My apologies.
It’s not that long ago that our Macs came with internal storage that could readily be replaced when it failed. Memories of big hard disks that died almost as soon as their warranty ran out, and of keeping a bootable clone ready in a Mac Pro, aren’t easily forgotten. So isn’t it high risk to buy a modern Mac that won’t even boot if its internal SSD has failed? Are you left wondering whether that SSD will last five years, or even three?
SSDs aren’t like hard disks
Hard disks are amazingly engineered electro-mechanical devices that spin platters at high speeds incredibly close to read-write heads. Before you even consider all the faults that can occur in their magnetic storage, there are many horrible ways they can die through mechanical disaster. Visit a data recovery shop and they’ll show you heads fused to platters, and shards of what had been storing terabytes of data before the platter shattered. And like all mechanical devices they wear out physically, no matter how carefully you care for them.
By comparison, an SSD in a Mac that has good mains power filtering, ideally a proper uninterruptible power supply (UPS), leads a sheltered life. Like other solid-state devices, so long as its power supply is clean and it doesn’t get too hot, it’s most likely to fail in the first few weeks of use, and as it’s reaching the end of its working life, in a U-shaped curve. Modern quality control has greatly reduced the number of early failures, so what we’re most concerned about is how long it will be until it wears out, as it approaches its maximum number of erase-write cycles.
Predicting wear
The theory goes that the memory cells used in SSDs can only work normally for a set number of erase-write cycles. This appears to hold good in practice, although there’s always a small number that suffer unpredictable electronic failure before they reach that. What’s more controversial is how many erase-write cycles each SSD should be capable of. Manufacturers make various claims based on accelerated ageing tests, and I suspect most come with a large dash of marketing sauce. Apple doesn’t offer figures for the SSDs it equips Macs with, but conservative estimates are around 3,000 cycles in recent models.
To work out how long you can expect your Mac’s internal SSD to last before it reaches that cycle limit, all you need do is to measure how much data is written to it, and once that is 3,000 times the capacity of the SSD, you should expect it to fail through wear. Fortunately, SSDs keep track of the amount of data written to them over their lifetime. This can be accessed through better SSD utilities like DriveDx, and I even have a feature in Mints that will do that for most internal SSDs.
Example
My iMac Pro is now well over 7 years old, as it was bought new in December 2018. It has a 1 TB internal SSD (I wanted 2 TB, but couldn’t wait for a BTO), and has run pretty well 24/7 since I got it. As I work every day, even over Christmas, and it has been my main production system, it has probably been in use for over 2,500 days now.
According to the SSD’s records, over that period its 1 TB SSD has written about 150 TB in total, from its total expected lifetime of 3,000 TB, if it reaches 3,000 erase-write cycles. At current usage rates that would take another century, or 133 years if you want to be precise. In reality, it’s generally believed that most SSDs will cease functioning after about 10 years in any case.
It’s worth noting here that, had I got the iMac Pro with my preferred 2 TB SSD, its total expected lifetime would have been 6,000 TB, and instead of lasting a total of 140 years it would in theory have gone twice that period before it wore out.
What wears out SSDs?
For an SSD to wear out when it reaches its limit of erase-write cycles, wear across its memory must be even. If that memory were to be largely full of static data, and the SSD was only able to write to 10% of its memory, then it would wear out ten times quicker than the whole SSD would. To ensure that doesn’t happen, all modern SSDs incorporate wear-levelling, which incurs its own overhead in erase-write cycles, but should ensure that the whole SSD wears out at the same rate. You can help that, and maintain faster write speeds, by keeping ample storage space free. My current target for my iMac Pro is an absolute minimum of 10% free, and 15% as much as possible.
Given that my iMac Pro has averaged about 21 TB written to its SSD each year, that works out at just under 60 GB per day. For those who are worried that the Unified log adds significantly to SSD wear, it’s not hard to estimate that’s only likely to write around 250-500 MB each day even if you leave your Mac awake and running 24/7, less than 1% of my Mac’s daily write load.
Unless you work with huge media files, by far your worst enemy is swap space used for virtual memory. When the first M1 Macs were released, base models with just 8 GB of memory and 128 GB internal SSDs were most readily available, with custom builds following later. As a result, many of those who set out to assess Apple’s new Macs ended up stress-testing those with inadequate memory and storage for the tasks they ran. Many noticed rapid changes in their SSD wear indicators, and some were getting worryingly close to the end of their expected working life after just three years.
So the best way to get a long working life from your Mac’s internal SSD is to ensure that it has sufficient memory as to never use swap space in its VM volume. Although my iMac Pro only has a 1 TB internal SSD, which is more cramped than I’d like, it has 32 GB of memory, and almost never uses swap.
Key points
SSDs wear out differently from hard disks.
Protect your Mac and its internal SSD with good mains power filtering, preferably using a UPS.
Expect modern Mac internal SSDs to wear out after at least 3,000 erase-write cycles.
To monitor wear, measure the total data written to the SSD.
Expect an internal SSD to wear out when that total reaches 3,000 times the total capacity of the SSD.
For a given amount of data written to an SSD, the larger the total capacity of the SSD, the slower it will wear out.
Keep at least 10% of the SSD free at all times, with 15-25% even better.
Ensure your Mac has sufficient memory to never use VM swap space.
We don’t always notice something is wrong within a few hours of the event that caused a problem. Sometimes it can take days or weeks before we realise that we need to check something in the log. By that time all trace has vanished, as the active log will have rolled those log entries long before we go looking for them. This article shows how to recover and analyse events from the more distant past, using a Time Machine backup and my free utilities LogUI and Logistician. My target is the macOS 26.3 Tahoe update installed on my Mac mini M4 Pro on 11 February, and I performed this analysis 11 days later, on 22 February.
When was the event?
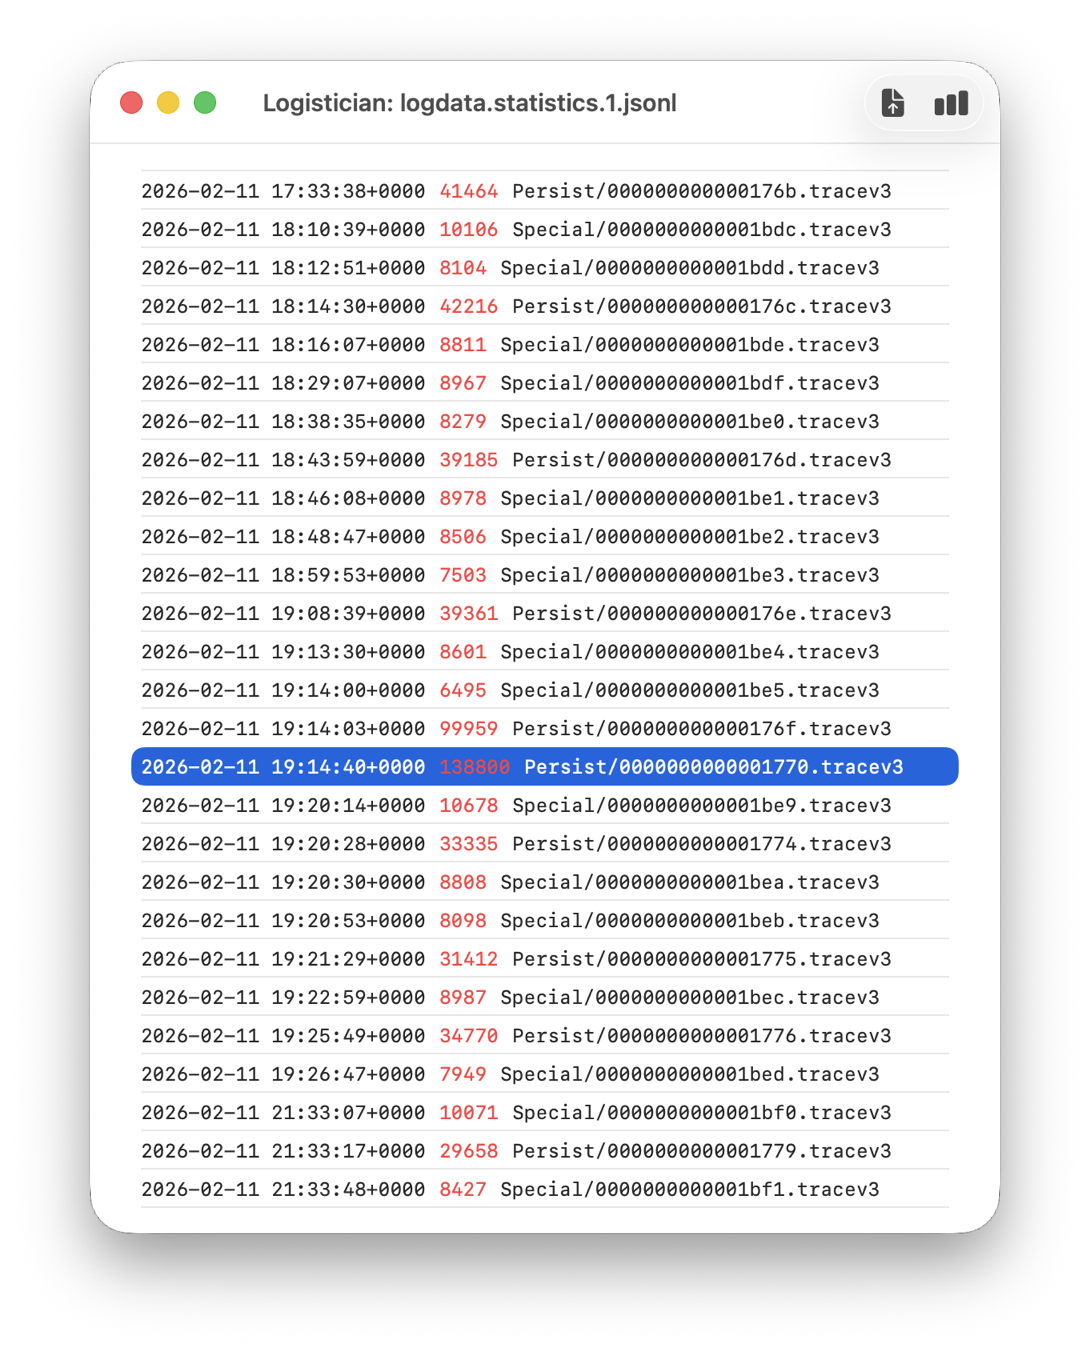
In this case I remember updating at around 18:30-19:30 on 11 February, but I don’t even need to recall the date. I first copied the logdata.statistics.1.jsonl file from my active log in /var/db/diagnostics to a working folder in ~/Documents, then opened it using Logistician.
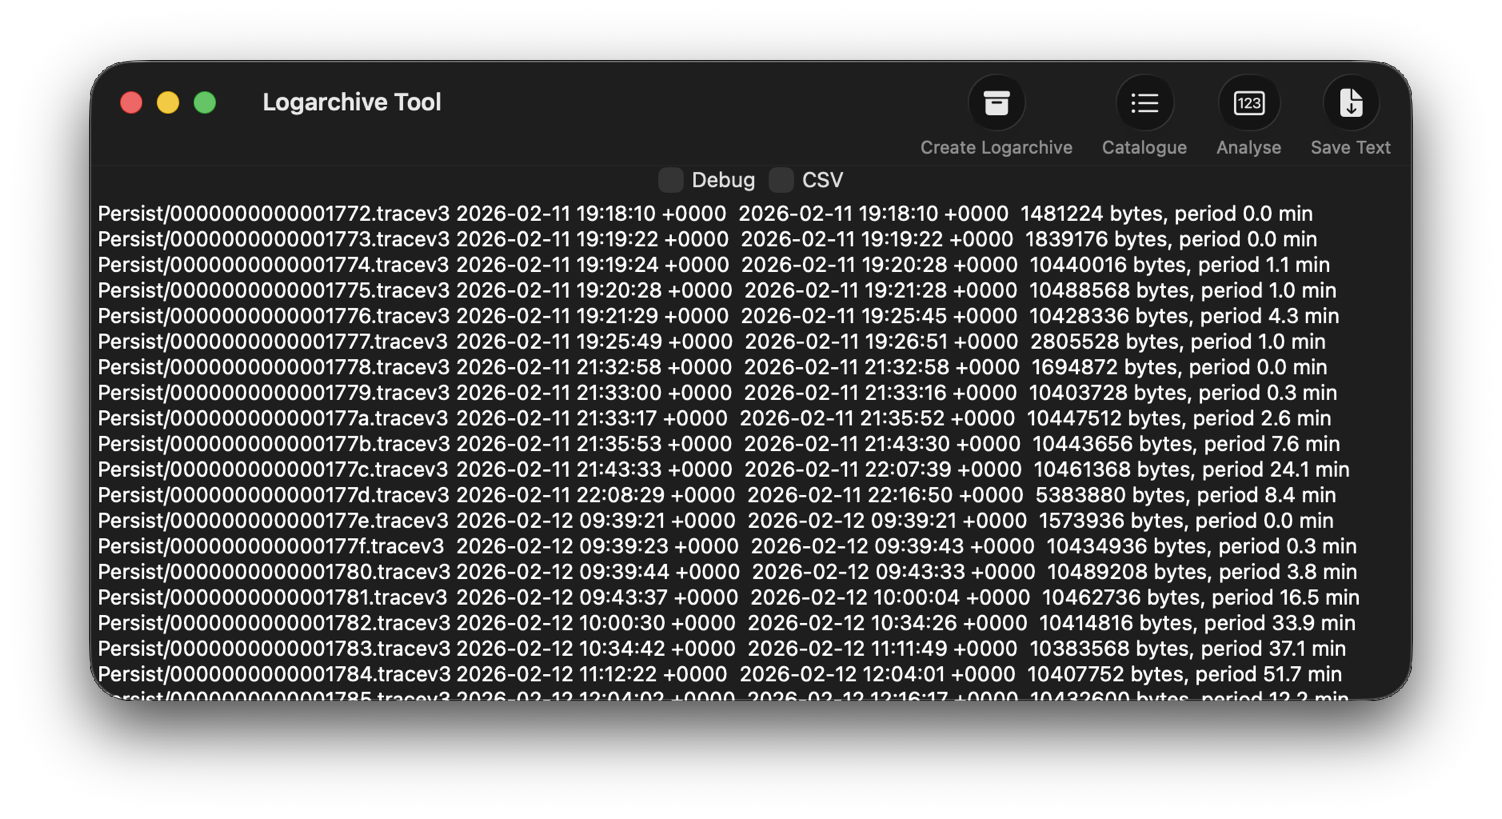
The log file listing between 18:10:39 and 19:26:47 on 11 February 2026 shows a remarkably rapid turnover of log files that’s an obvious marker of that update. Highlighted here is a Persist file that’s exceptionally large at 139 MB of log entries for a collection period of just 37 seconds, although like other tracev3 log files in the Persist folder that only takes 10.5 MB of disk space.
Retrieve the log
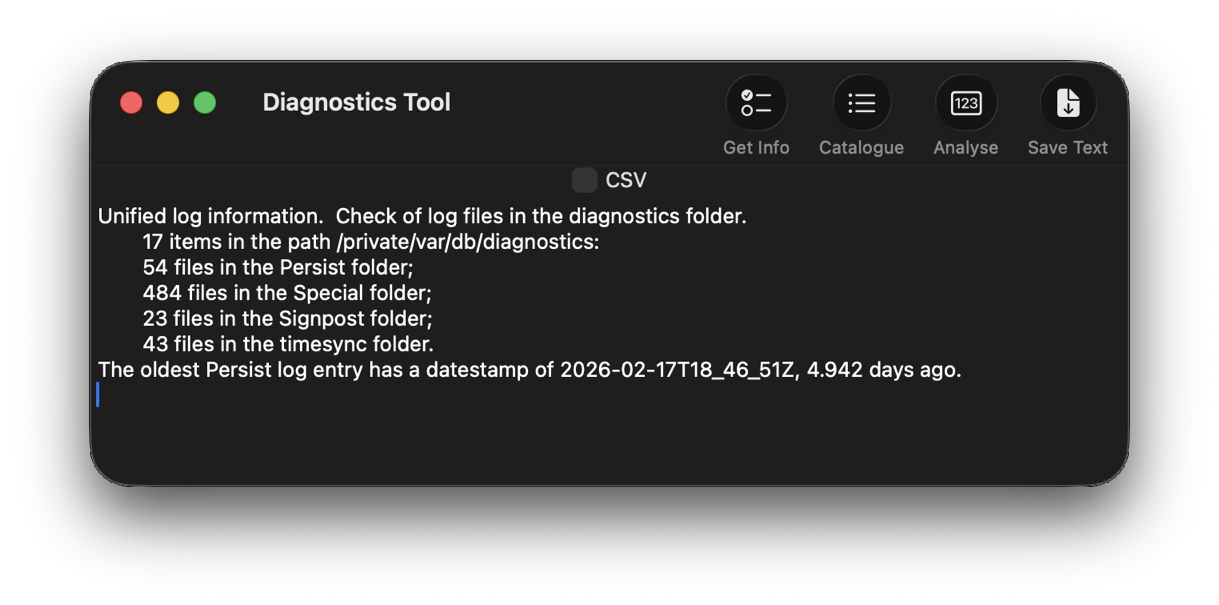
Although I’m confident those logs were removed many days ago, I open LogUI, then select its Diagnostics Tool from the Window menu. I click the Get Info tool and select my active log in /var/db/diagnostics. That tells me that the oldest log entry there dates from 17 February, so there’s no point in trying to find those entries in that log.
Like all good backup utilities, Time Machine also backs up the whole of the log folders, and I can use those to create a logarchive file for analysis. I therefore locate the next backup made after those log entries were written, on 12 February, and copy the /var/db/diagnostics and /var/db/uuidtext folders into a new folder in my working folder, ready to turn them into a logarchive.
In LogUI, I open its Logarchive Tool from the Window menu and use that to turn those folders into a logarchive I can access using LogUI. I check that freshly created logarchive using the Catalogue tool to confirm that it contains the log files I want to browse.
Identify the event
With the historical log safely preserved in a logarchive and a defined time of interest, my next task is to identify the event I want to investigate. In this case, I could probably go straight ahead and look at all entries for a few seconds, but in other circumstances you may need to know which entries to look for.
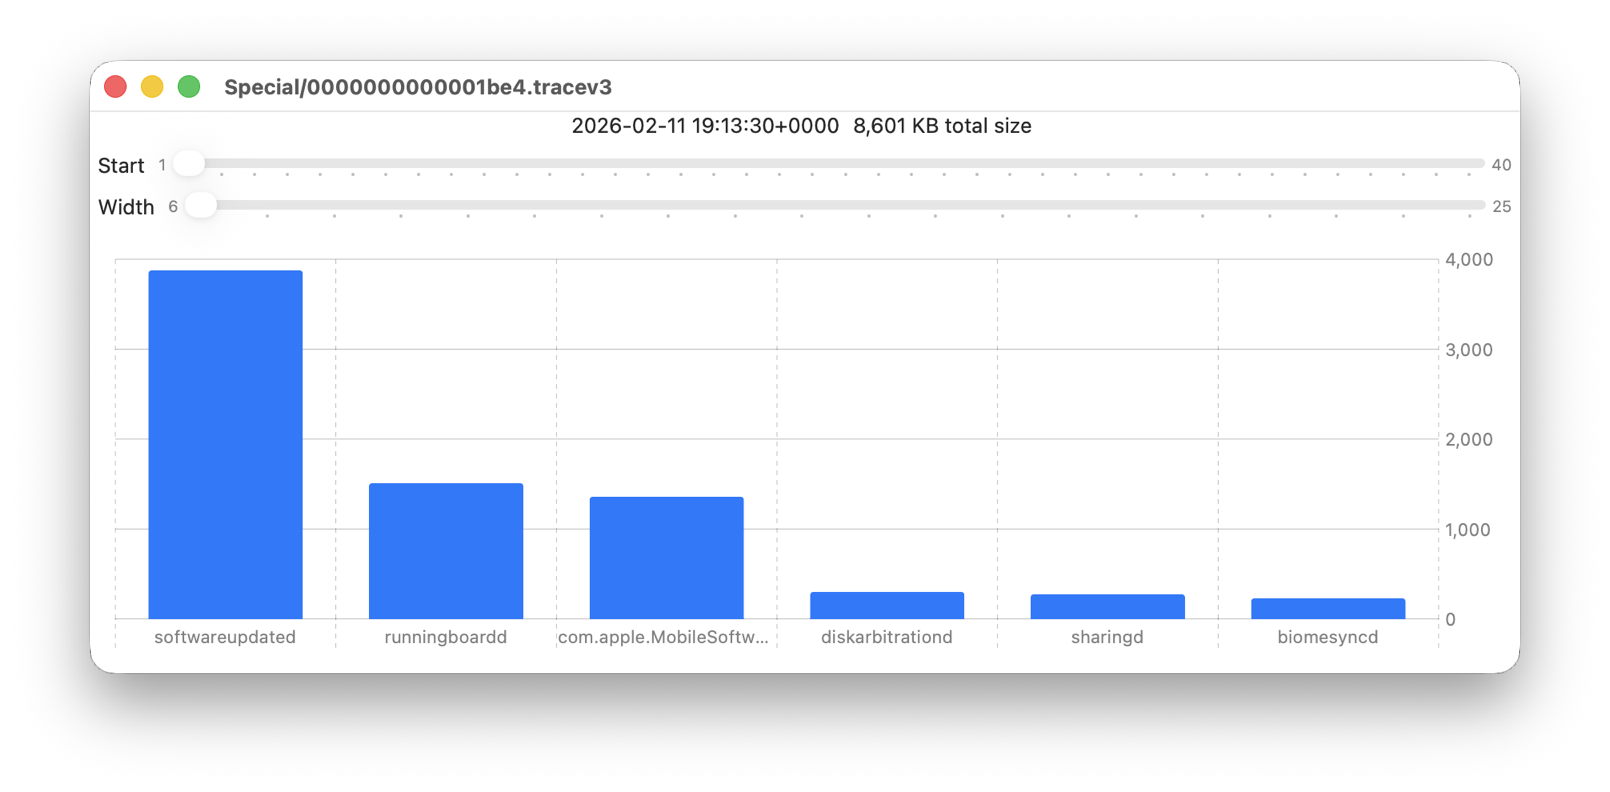
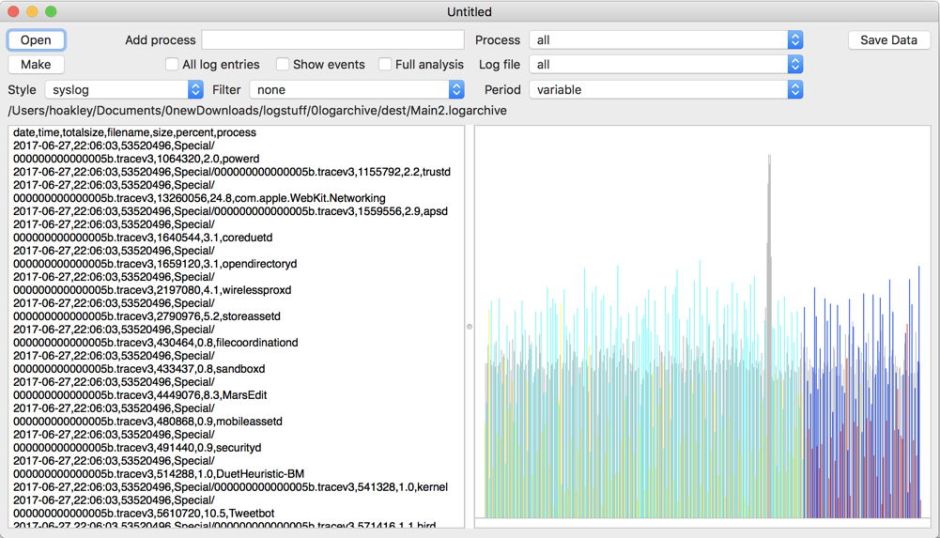
Back in Logistician, I select that extraordinary Persist log file and view it in a Chart. Most of the other log files over this period look like this:
with large quantities of entries from softwareupdated, com.apple.MobileSoftwareUpdate and similar processes. But the huge Persist file that filled in only 37 seconds is exceptional.
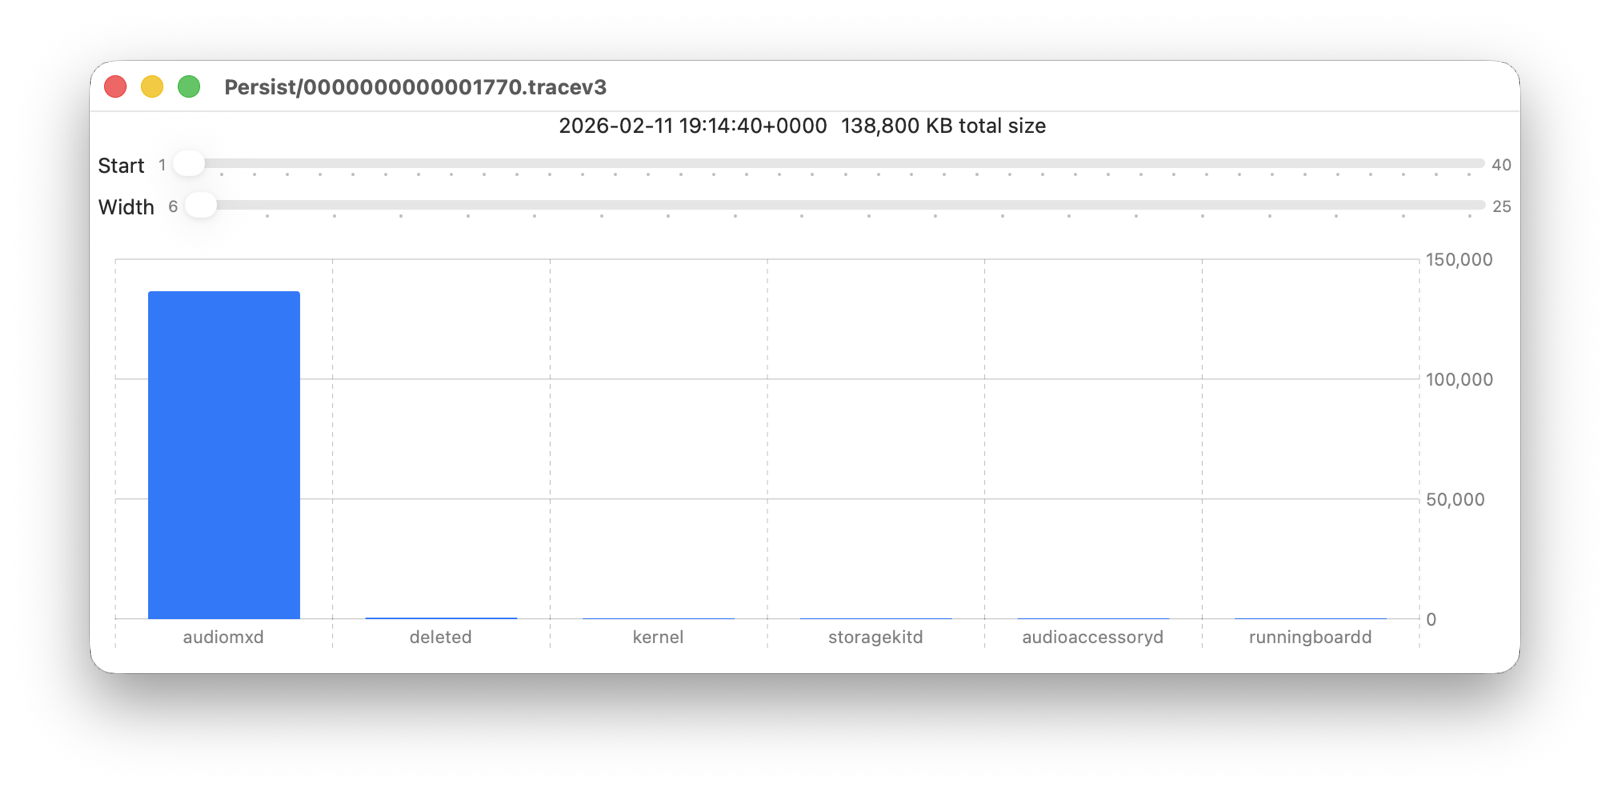
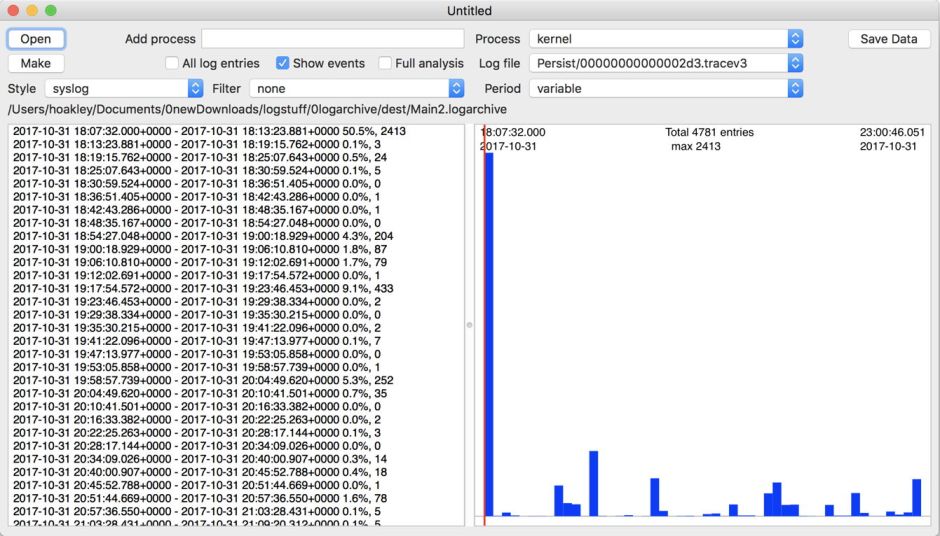
Almost all its entries are from audiomxd, and all other entries are dwarfed by its size.
Browse the event
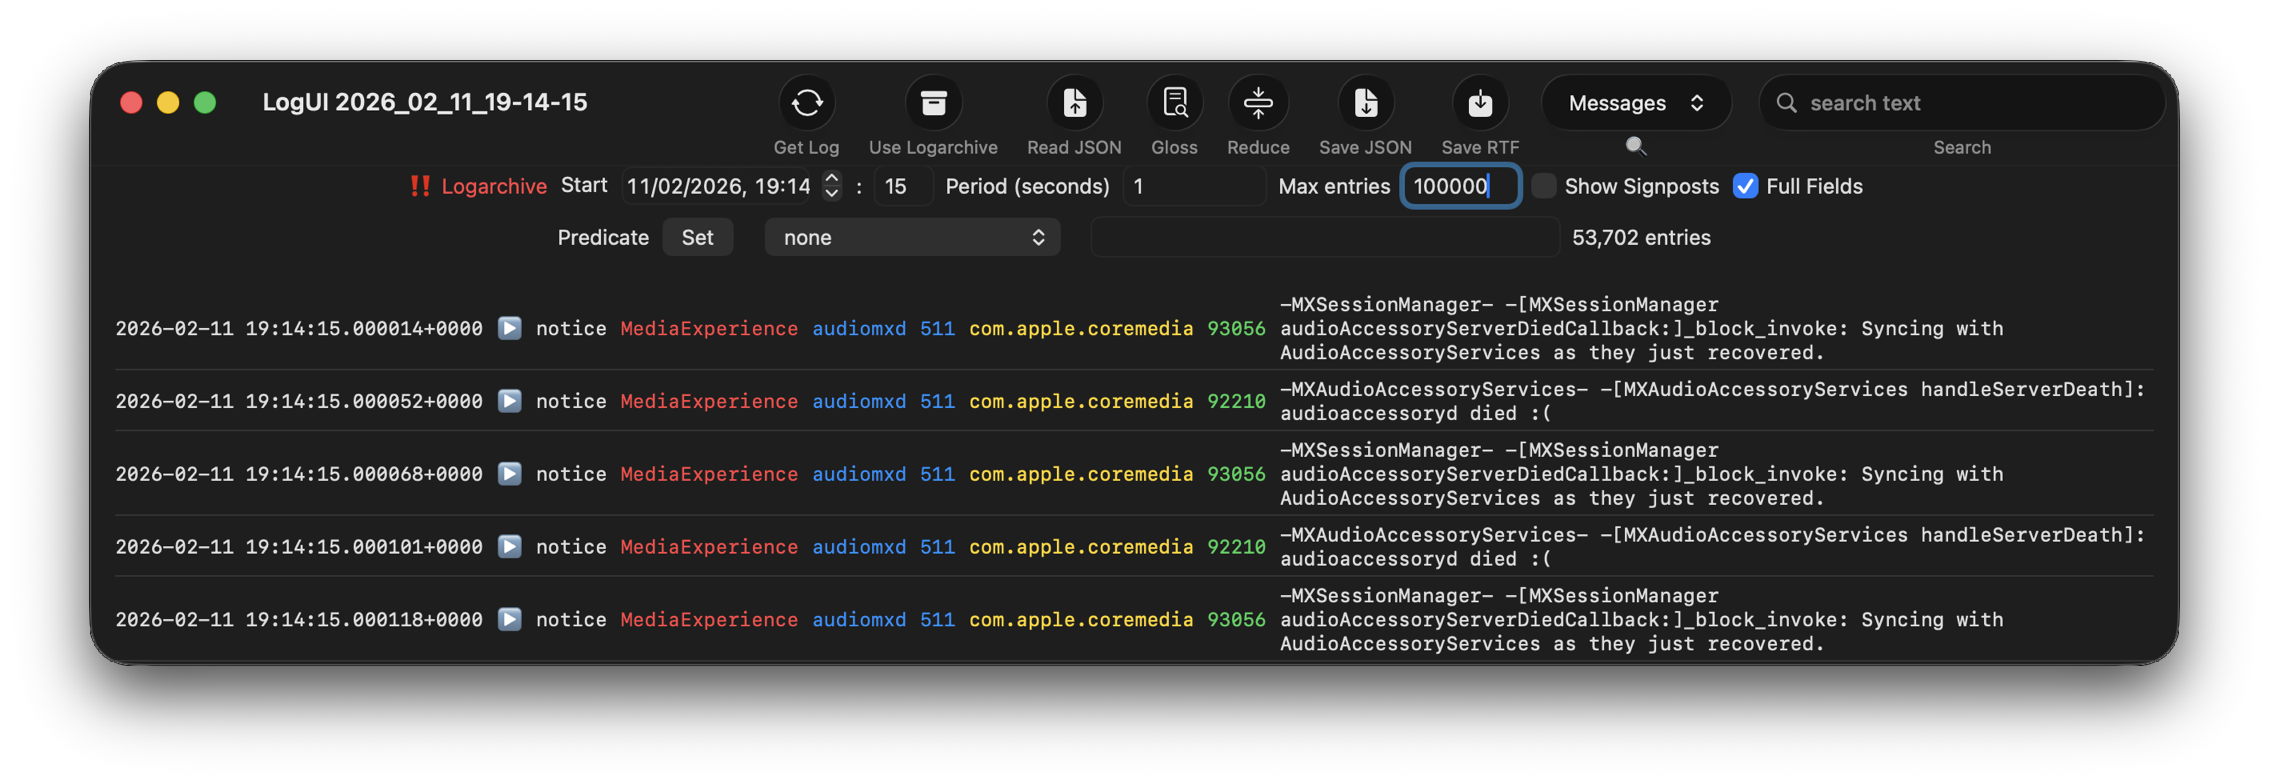
By default when you click on LogUI’s Get Log tool it will fetch those log entries from the active log. To switch that source to my logarchive file, I click on the Use Logarchive tool and select the logarchive I just created in my Documents folder. To remind me that it’s no longer looking in the active log, that window then displays a red-letter caution of !! Logarchive to the left of the Start control. That also reminds me to use dates and times within the range covered by that logarchive.
I set the Start to ten seconds into the collection period of that large Persist file, a period of 1 second, and the maximum number of entries to 100,000, then click on the Get Log tool.
This is one of the most remarkable log extracts I have ever seen: in this 1 second period, the audiomxd process in com.apple.coremedia wrote about 53,000 entries to the log. Over the 37 seconds of log records in that single Persist file, audiomxd must have written at least 1.5 million log entries. These are all apparently the result of the ‘death’ of the AudioAccessory service audioaccessoryd, and its recovery after updating macOS.
Summary
Identify approximate time of event from /var/db/diagnostics/logdata.statistics.1.jsonl using Logistician.
Check in LogUI whether that falls within the period of the active log.
If not, retrieve /var/db/diagnostics and /var/db/uuidtext from the next backup made after the event.
Convert those folders into a logarchive using LogUI’s Logarchive tool, and check it contains the period of the event.
Identify the processes involved using Logistician’s chart.
Set LogUI to use that logarchive, enter the correct date and time, and get log entries for the required processes.
One of the mysteries of the Unified log since its introduction almost ten years ago in macOS Sierra has been how it keeps such extensive records of what happens between the start of kernel boot and the user logging in. This must have been sufficiently challenging before Catalina, but since then the separate Data volume, where log files are stored, has been locked away by FileVault until the user’s password enables it to be accessed.
Log entries are initially stored in memory, and from there most are written to tracev3 files in their respective directories in /var/db/diagnostics. logd is responsible for that, and for maintaining the contents of that directory. Ironically, logd maintains its own old-style log in text files inside that directory, but its terse entries there reveal little about how it does its job. What they do reveal is that logd has an assistant, logd_helper, with its own old-style text logs that are a bit more informative.
In Apple silicon Macs, logd_helper apparently connects every few minutes to five coprocessors, SMC (System Management Controller), AOP (Always-On Processor), DCPEXT0, DCPEXT1 and DCPEXT2 (Display Co-Processors). There appears to be nothing equivalent in Intel Macs. It also conducts ‘harvests’ shortly after it has started up, so solving the mystery of where all the log entries are saved prior to unlocking the Data volume.
Soon after the start of kernel boot, once the Preboot volume is generally accessible and logd is running, logd starts writing log entries to temporary storage in the Preboot volume. You can see that in the path /System/Volumes/Preboot/[UUID]/PreLoginData, where there’s a complete diagnostics directory, and one to store longer log entries in the warren of directories in uuidtext. Those are identical in layout to permanent log storage in /var/db.
Shortly after user login, with the Data volume unlocked at last, logd_helper is started, and it merges log files from Preboot/[UUID]/PreLoginData/diagnostics and those files in Preboot/[UUID]/PreLoginData/uuidtext into permanent log storage in the Data volume in /var/db/diagnostics and /var/db/uuidtext, a process it refers to as harvesting.logd_helper can also harvest from entries stored in memory.
Once this merger has been completed, log directories in Preboot/[UUID]/PreLoginData/diagnostics are left empty, as are logdata.statistics files there, making the log record of kernel boot complete, right up to unlocking of the Data volume.
That explains how tens of thousands of log entries can still be recorded faithfully in a Data volume that can’t be unlocked for some time yet.
Once normal logging to /var/db/diagnostics is running, logd maintains the tracev3 files containing log entries there. Its goals appear to be:
in the Persist folder, file size is normally 10.4-10.5 MB, although it may be smaller when truncated by shutdown;
Persist files are removed with age to maintain a typical total size for that folder of just under 530 MB in just over 50 files, bringing the size of the whole diagnostics folder to between 1-2 GB;
in Special and Signpost, log file size is normally 2.0-2.1 MB when closed, but entries are weeded progressively until each file is empty and can be deleted;
timesync files are less than 1 KB;
HighVolume is seldom if ever used.
The overall effect on historical log entries is that those in Persist files are rate-sensitive and removed sooner when log entries are written more frequently. However, selected entries in Special files may last considerably longer, but become less frequent with age. A few of those may be retained for hours or days longer than the oldest in Persist files. I have no insight into the rules that logd follows when deciding when to weed entries from Special files.
Extended entries stored in the warren of folders in /var/db/uuidtext are purged periodically on request from CacheDelete, as with other purgeable storage, at least once a day. That should ensure that the contents are only retained while they’re still referred to by entries in the log files.
As far as I’m aware, the user gets no say in the size limits imposed on log storage, and there’s no option to increase them to allow logs to be retained for longer. However, as both /var/db/diagnostics and /var/db/uuidtext folders should be backed up by Time Machine and most third-party utilities, you can always analyse those backups when you need to check older log entries.
If you don’t know exactly what you’re looking for, and when it happened, the log has been a hostile place. Doom-scrolling through tens of thousands of log entries in the hope of stumbling across a clue is tedious, and the odds have been stacked against you. So last week I’ve been doing something to redress the balance and shorten those odds, and I’m delighted to offer its first version in Logistician. This has nothing to do with logistics, but is all about log statistics.
Alongside folders containing your Mac’s Unified log files, in /var/db/diagnostics, you’ll see files with names starting with logdata.statistics. A couple are text files that only go back a day or two, and others have the extension jsonl. If you were privileged to test some beta-releases of macOS Tahoe, you may have some database files as well, but here it’s those jsonl files I’m concerned with.
Inside them are basic statistical summaries of every log file that’s been saved in your Mac for the last few weeks or months. Even though the original log files have long since been deleted, summaries of their contents are still available in files like logdata.statistics.1.jsonl, and those are opened up by Logistician.
As the files in /var/db/diagnostics are still live, and may be changed as logd does its housekeeping, copy those jsonl files to somewhere in your Home folder, like a folder in ~/Documents. Open Logistician, click on its Read JSONL tool, select one of those copies and open it.
Logistician’s window displays the file’s contents in a list, with the oldest at the top. It gives the date and time that file was saved, just after the last log entry was written to it, its size in KB, whether it was a Persist (regular log), Special (longer supplementary log entries) or Signpost (performance measurements) collection, and the name of the file.
Select one of those file entries and click on the Chart selection tool at the top right to see its data plotted out in the Chart view.
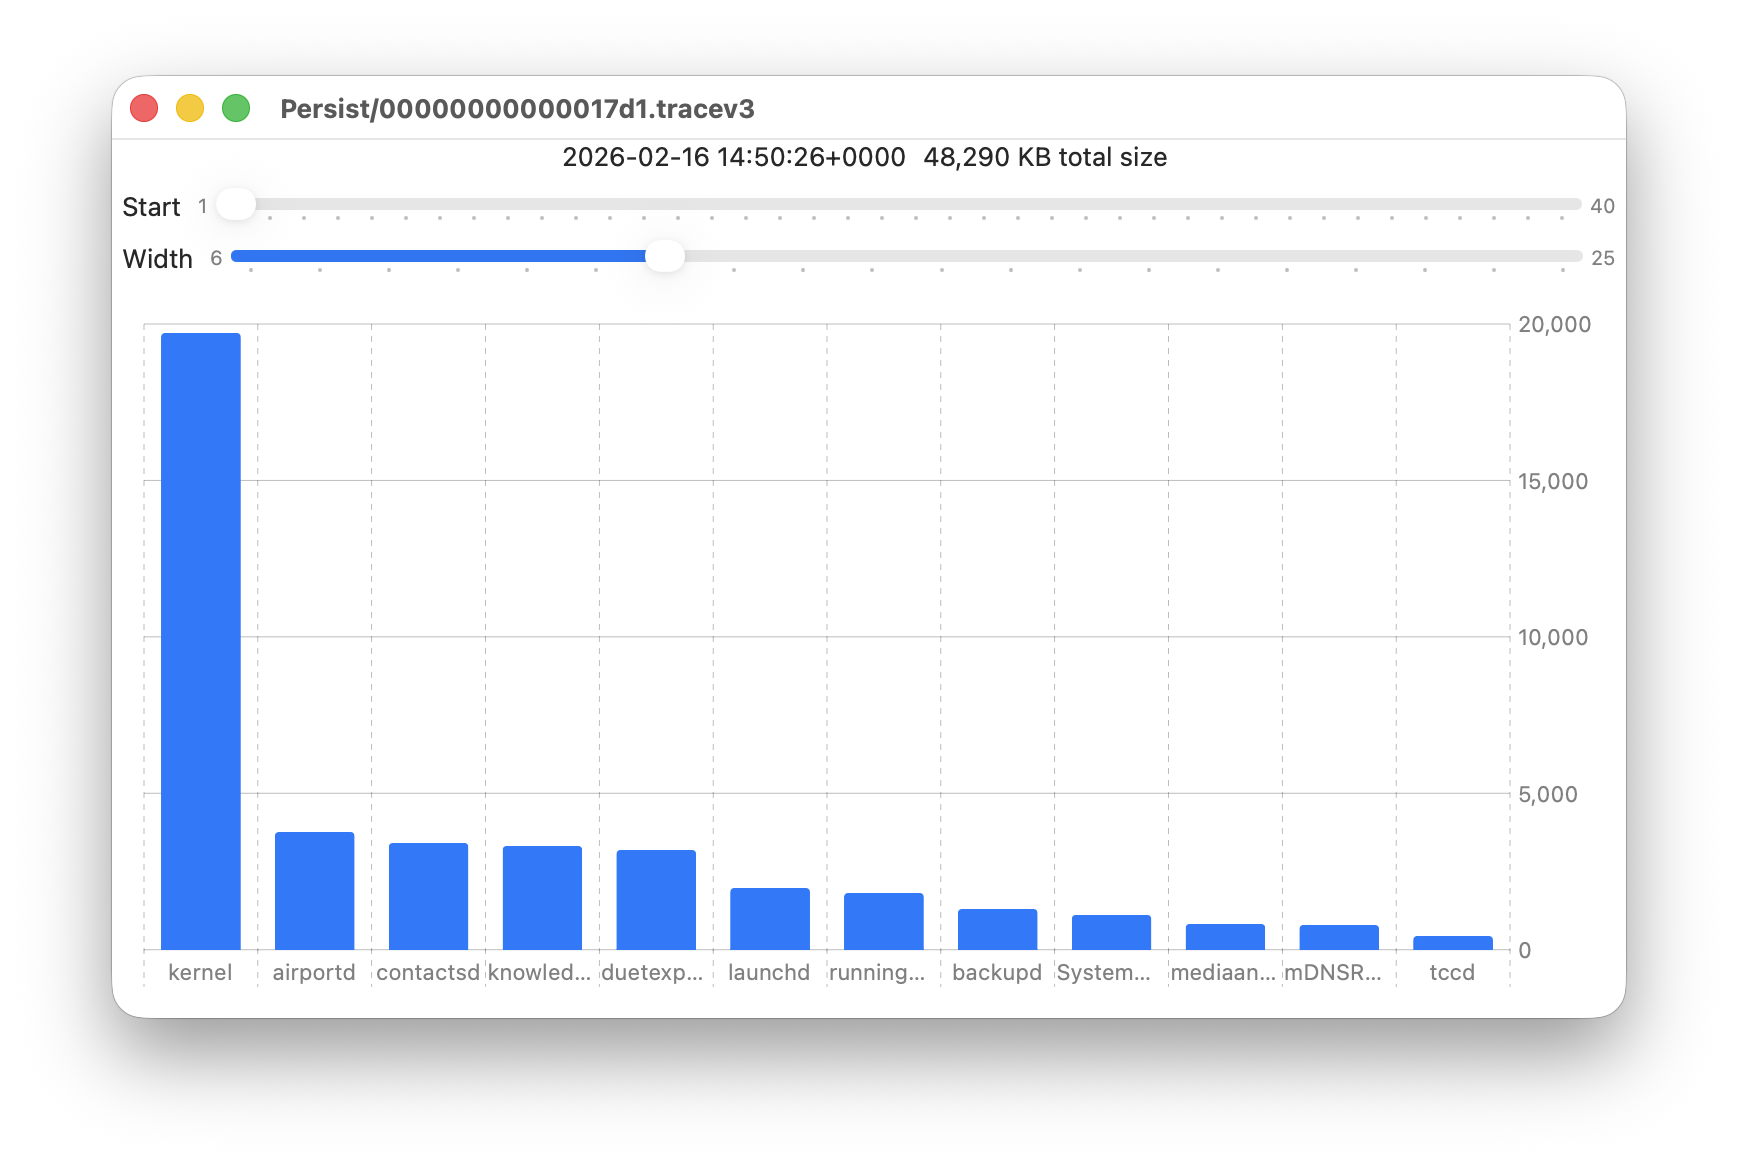
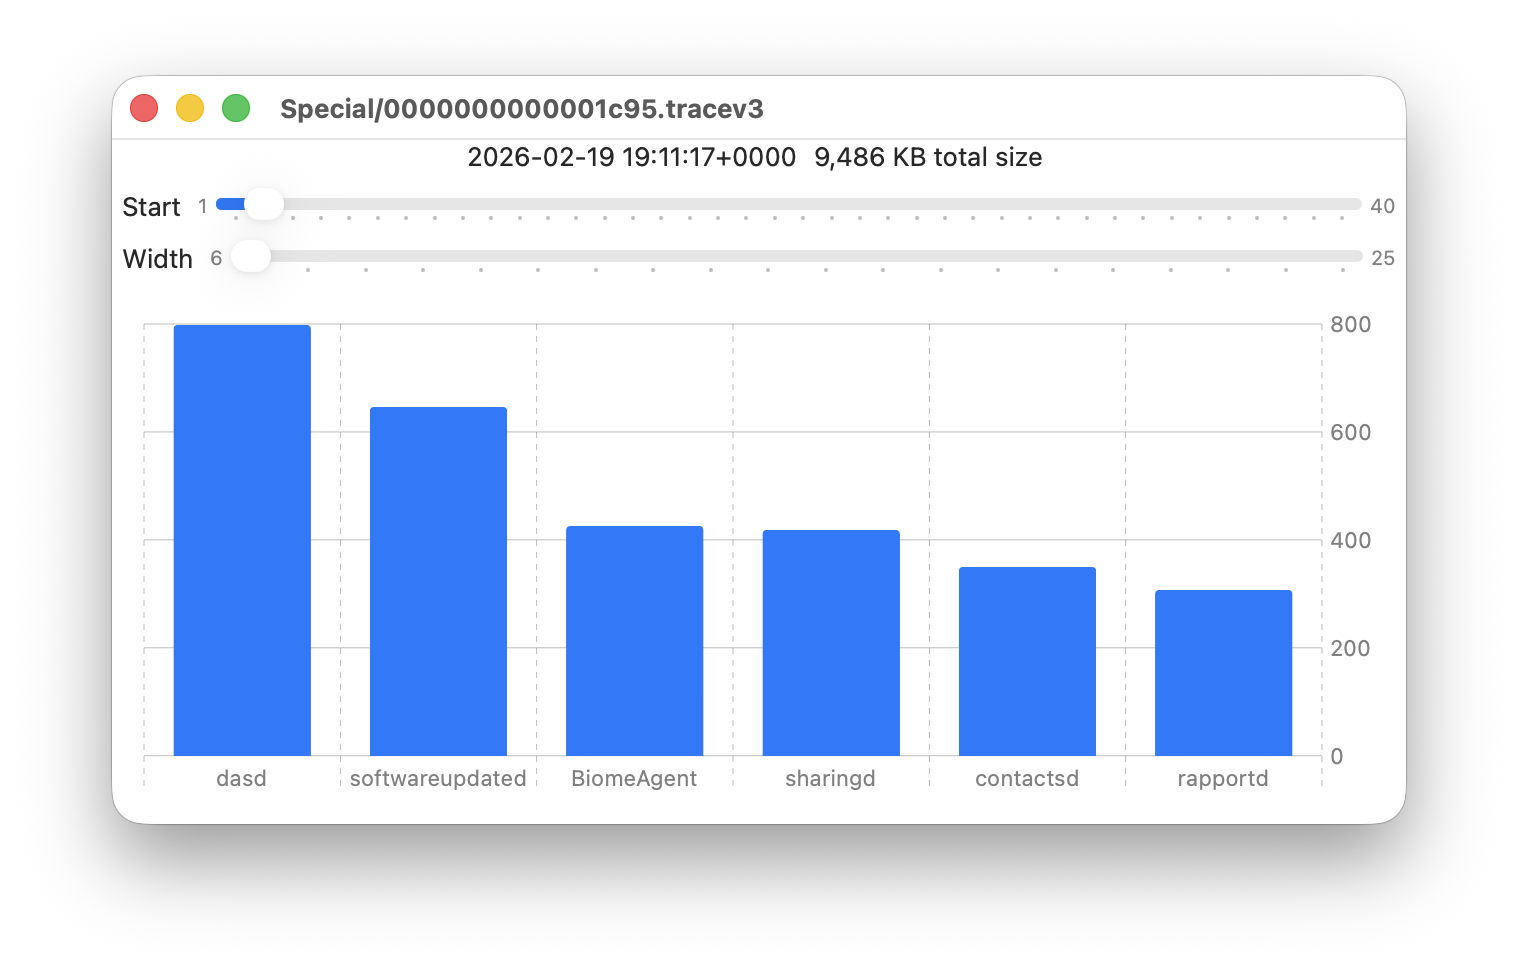
Data provided for each log file listed includes a breakdown of the total size of log entries from that process or subsystem, and Logistician’s Chart view displays those data as a bar chart. The height of each bar represents the total size in KB of log entries made by that process in that specific log file. As there are a 50 bars available, two sliders set the size and location of that window on the data:
Start sets the number of the first bar on the left, beginning at 1 for the greatest size, usually the kernel, and increasing to 40 for a process with very few log entries, just ten from the smallest.
Width sets the number of bars to display, ranging from 6 to 25. The more shown, the harder it is to read the names of processes at the foot of each bar, and the less precisely you can read the size of their log data at the right.
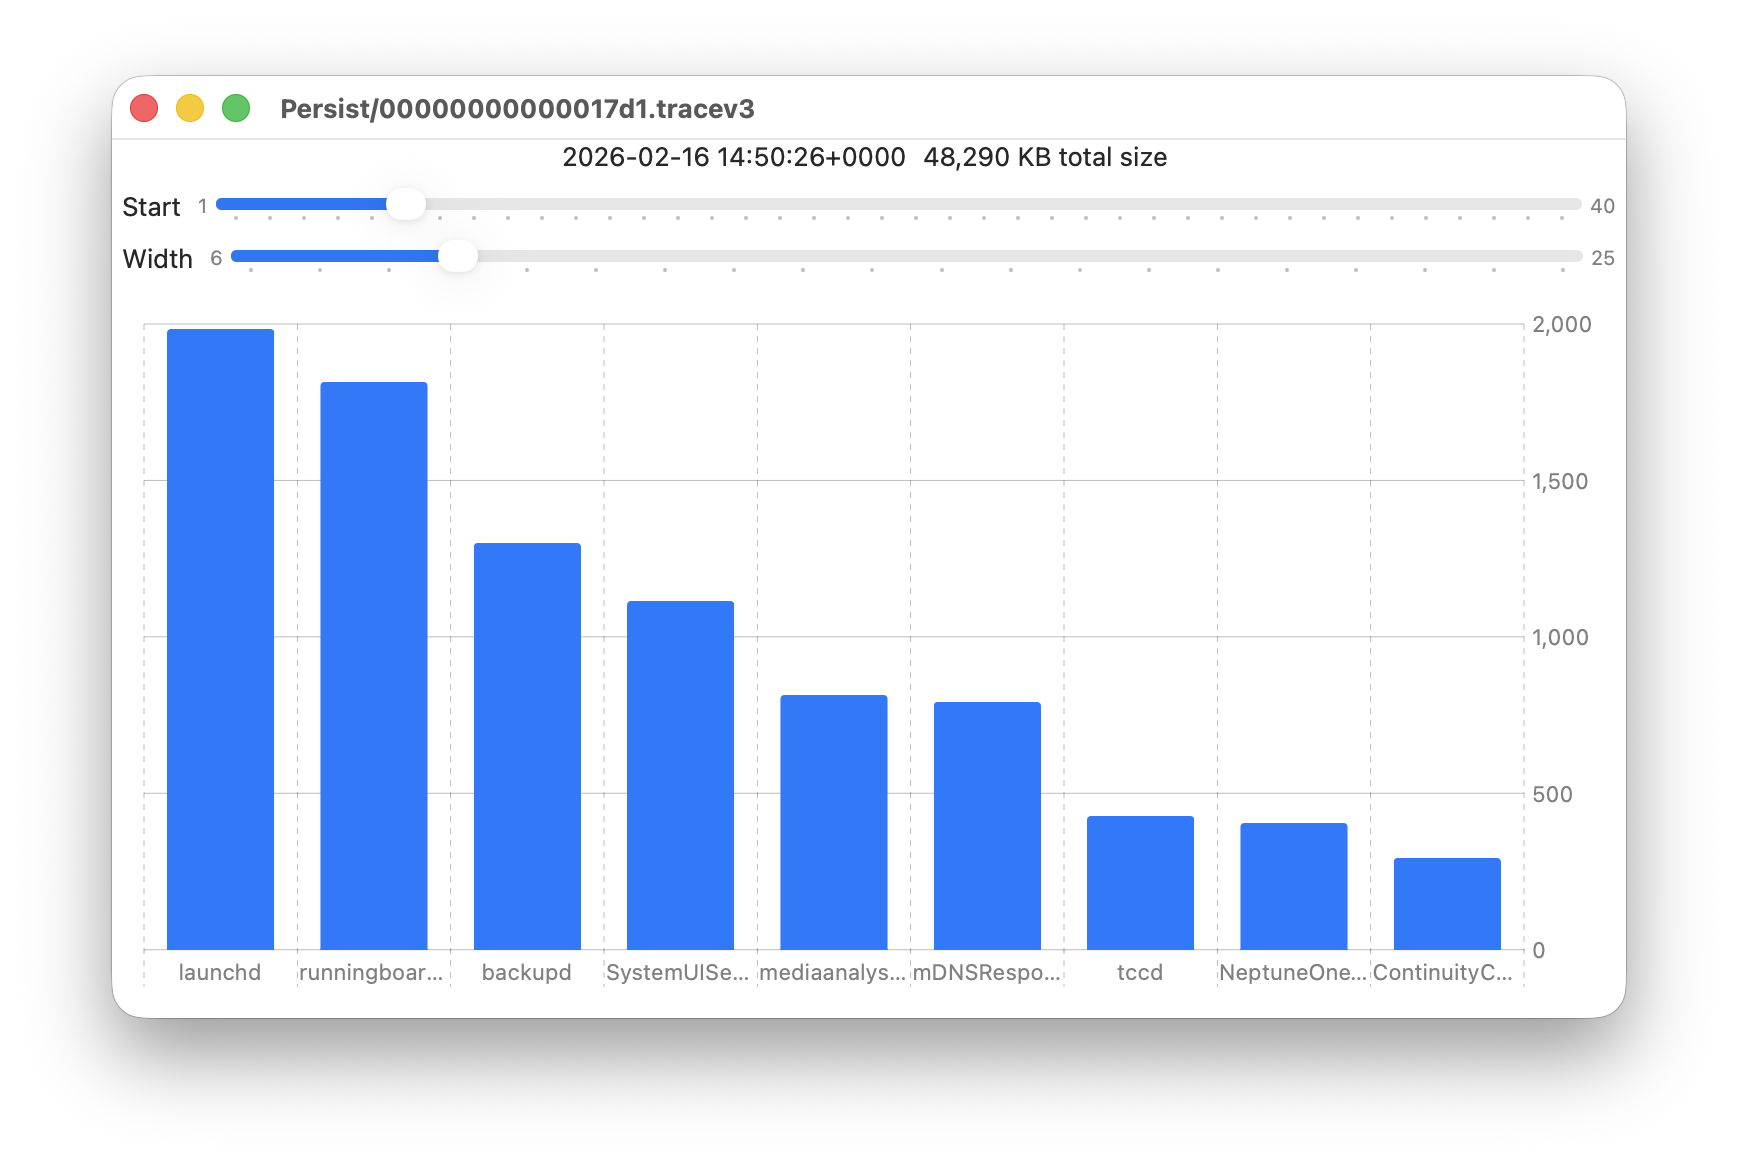
These sliders are set to show 9 bars from number 6 at the left (the sixth highest log data, written by launchd) to number 14 at the right (14th highest, written by ContinuityCaptureAgent). Of interest here are around 400 KB of log entries from NeptuneOneWallpaper.
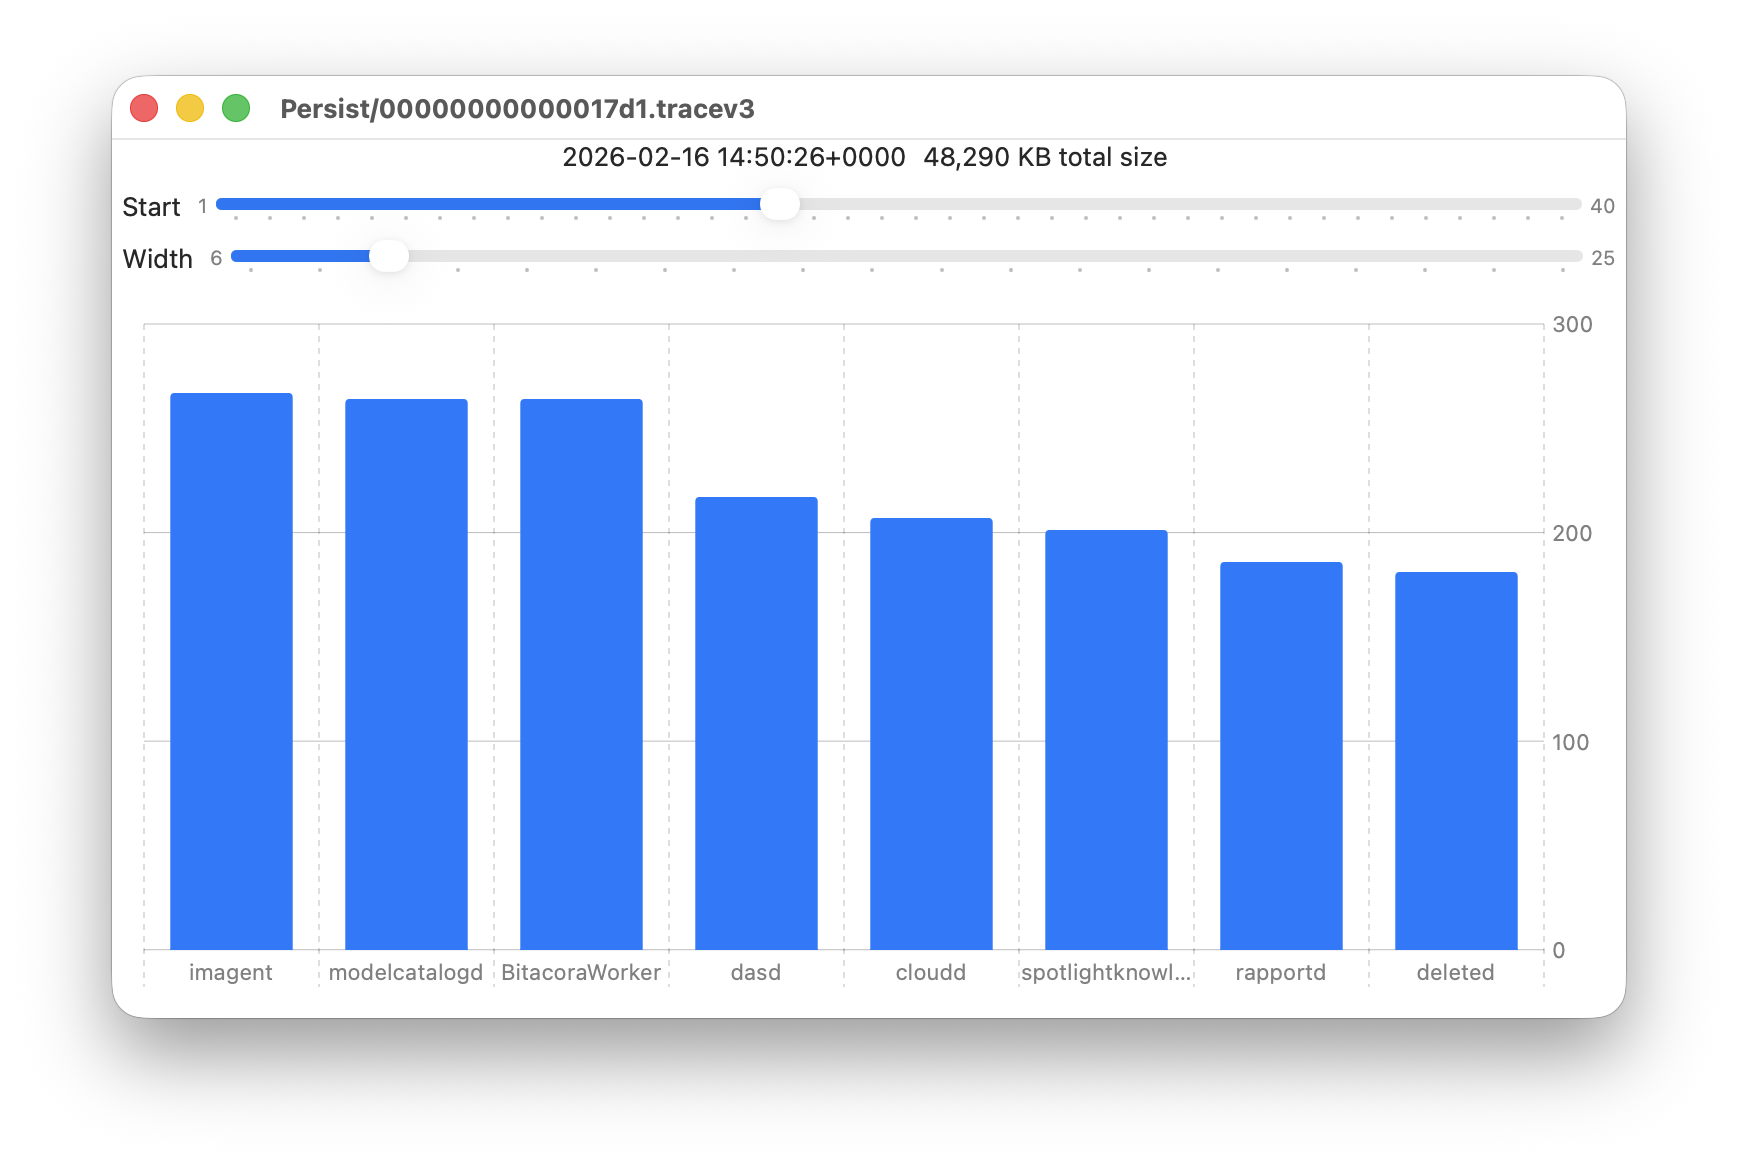
Here are 8 bars from 17 to 24, with smaller quantities written to the log of around 200 KB each. They include the DAS service dasd and cloudd for iCloud.
It’s easy to flip quickly through a series of log files: click on the next file you want to view in the main list, click on the Chart selection tool and values will be displayed immediately.
Fascinating though that might be, it doesn’t in itself answer many questions. Add a log browser like LogUI, though, and the combination helps you locate and identify unusual activity, problems, and specific events.
I happened to notice one Special log file that was closed at 19:11:17 on 19 February has high log data from softwareupdated. The previous Special log file was closed at 18:20:04, so somewhere between those times my Mac checked for software updates.
To ensure the full entries were still available in the log, I opened LogUI’s Diagnostics Tool to confirm that its earliest entries were a couple of days earlier.
I then set LogUI to a Start time of 18:20:04 with a Period of 600 seconds, and a Predicate set to a processImagePath of softwareupdated, to look for entries from that process. My first check located all the softwareupdated entries around 18:29:25, when I had apparently run SilentKnight. As a bonus, I discovered from those that SilentKnight was stuck in app translocation, so have been able to fix that (again).
Logistician version 1.0 build 7 for macOS Sonoma and later is now available from here: logistician106
I will add it to other pages here when I’m more confident that this initial version is stable and does what it claims in its detailed Help book.
One of the features introduced in the new Unified log back in macOS Sierra was its ability to protect privacy by redacting potentially sensitive contents. Although a good thing, an extraordinary mistake in High Sierra, which revealed an encryption password in plain text, has led to many entries being so heavily redacted that they’re gutted of all meaning by <private>.
Another bone of contention has been the protection provided to key information about network connections. Originally that could be removed by setting the CFNETWORK_DIAGNOSTICS environment in Terminal. Following a vulnerability addressed in Ventura 13.4 that was protected by SIP, raising the barrier for that as well.
This Friday’s magic trick is one of the most complicated I have attempted yet, and is going to show how you can put meaning back into your log and discover where all those network connections are going. Because of the changes necessary, this is easiest to perform in a macOS VM, allowing you to discard the VM when you’re done.
Setting up
You don’t have to use a VM, but if you use a Mac it shouldn’t be your production system, and you’ll need to set it back to its original settings when you’ve finished.
I took a freshly updated VM with macOS Tahoe 26.3, duplicated that in the Finder, and used the duplicate so I could easily trash it.
I then installed the profile I have made available here to remove privacy in the log. Double-click the profile, then confirm in System Settings > General > Device Management that you want to add and enable it. From then until you remove that profile, all redactions in the log should cease.
To disable SIP, I started the VM up in Recovery mode, opened Startup Security Utility and downgraded boot security there. I then opened Terminal and disabled SIP using the command csrutil disable
If you want to, while you’re in Terminal you can run the command to enable network diagnostics launchctl setenv CFNETWORK_DIAGNOSTICS 3
noting that, in Recovery, there’s no sudo required or available. If you do this now, it should also apply when you restart.
Once that has been completed, restart back into normal mode and check the profile is still enabled. If you didn’t enable network diagnostics there, open Terminal and enter sudo launchctl setenv CFNETWORK_DIAGNOSTICS 3
Testing
Ensure the menu bar clock is displaying seconds, and just as it turns those to 00 seconds, run an app like SilentKnight that connects to remote sites. View the log for that period using LogUI (or whatever), and you should see the effects of both privacy removal and network diagnostics. The log is now a very different place, and far more informative.
Results
These are comparable log entries, before and after pulling this trick.
Privacy removal
Normal log entry: 00.541160 com.apple.launchservices Found application <private> to open application <private>
Privacy removed: 00.540882 com.apple.launchservices Found application SilentKnight to open application file:///Applications/SilentKnight.app/
restoring the app name and location that had been redacted to render the log entry meaningless.
Network diagnostics
Normal log entry: 01.240305 com.apple.network [C5 752CDB24-4E91-40B0-A837-9D7B9DE41B9E Hostname#7c4edf26:443 tcp, url hash: b62568a6, tls, definite, attribution: developer, context: com.apple.CFNetwork.NSURLSession.{AA60FF41-BA48-4332-B223-0C76A78CCEA7}{(null)}{Y}{2}{0x0} (private), proc: 9FC457E5-3273-37FA-BAEE-749A710F48E5, delegated upid: 0] start
which obfuscates the URL in a hash of b62568a6.
Network diagnostics: 01.103602 com.apple.network [C1 8BF615A6-CBEF-48D8-BE2F-CEF861B70BEE Hostname#99dda594:443 quic-connection, url: https://raw.githubusercontent.com/hoakleyelc/updates/master/applesilicon.plist, definite, attribution: developer, context: com.apple.CFNetwork.NSURLSession.{58709C77-3924-44EA-8563-4B44F0223AB6}{(null)}{Y}{2}{0x0} (private), proc: 06DF065F-71F6-36D9-BBAE-533B2D327BF4, delegated upid: 0] start
which reveals the full URL of https: // raw.githubusercontent.com/hoakleyelc/updates/master/applesilicon.plist, the property list on my Github containing firmware versions for Apple silicon Macs.
Remember
If you did this on a physical Mac, don’t forget to remove the profile, to enable SIP and return Startup Security Utility to Full Security, which should automatically disable network diagnostics.
Anyone familiar with Doctor Who will be aware of the power brought by control over time. Although there have been sporadic reports of problems with Apple silicon Macs keeping good time, and they may not synchronise sufficiently accurately for some purposes, they appear to have generally good control over time.
Last year I explained how macOS now uses the timed service with network time (NTP) to perform adjustments while running. This article looks at what happens before that, during startup, when the Mac has only its own devices to tell the time. Although the user sees little of this period, anyone accessing the log recorded during startup could find the timestamps of entries affected by adjustments. It may also provide insights into how Apple silicon Macs tell the time.
Methods
To investigate clock initialisation and adjustment during startup, I analysed approximately 100,000 consecutive log entries freshly recorded in the log of a Mac mini M4 Pro booting cold into macOS 26.2, following a period of about 14 hours shut down. These entries covered the period from the initial boot message for approximately 27 seconds, after I had logged in and the Desktop and Finder were displayed. This Mac is configured to Set time and date automatically from the default source of time.apple.com in Date & Time settings, and has both WiFi and Ethernet connections.
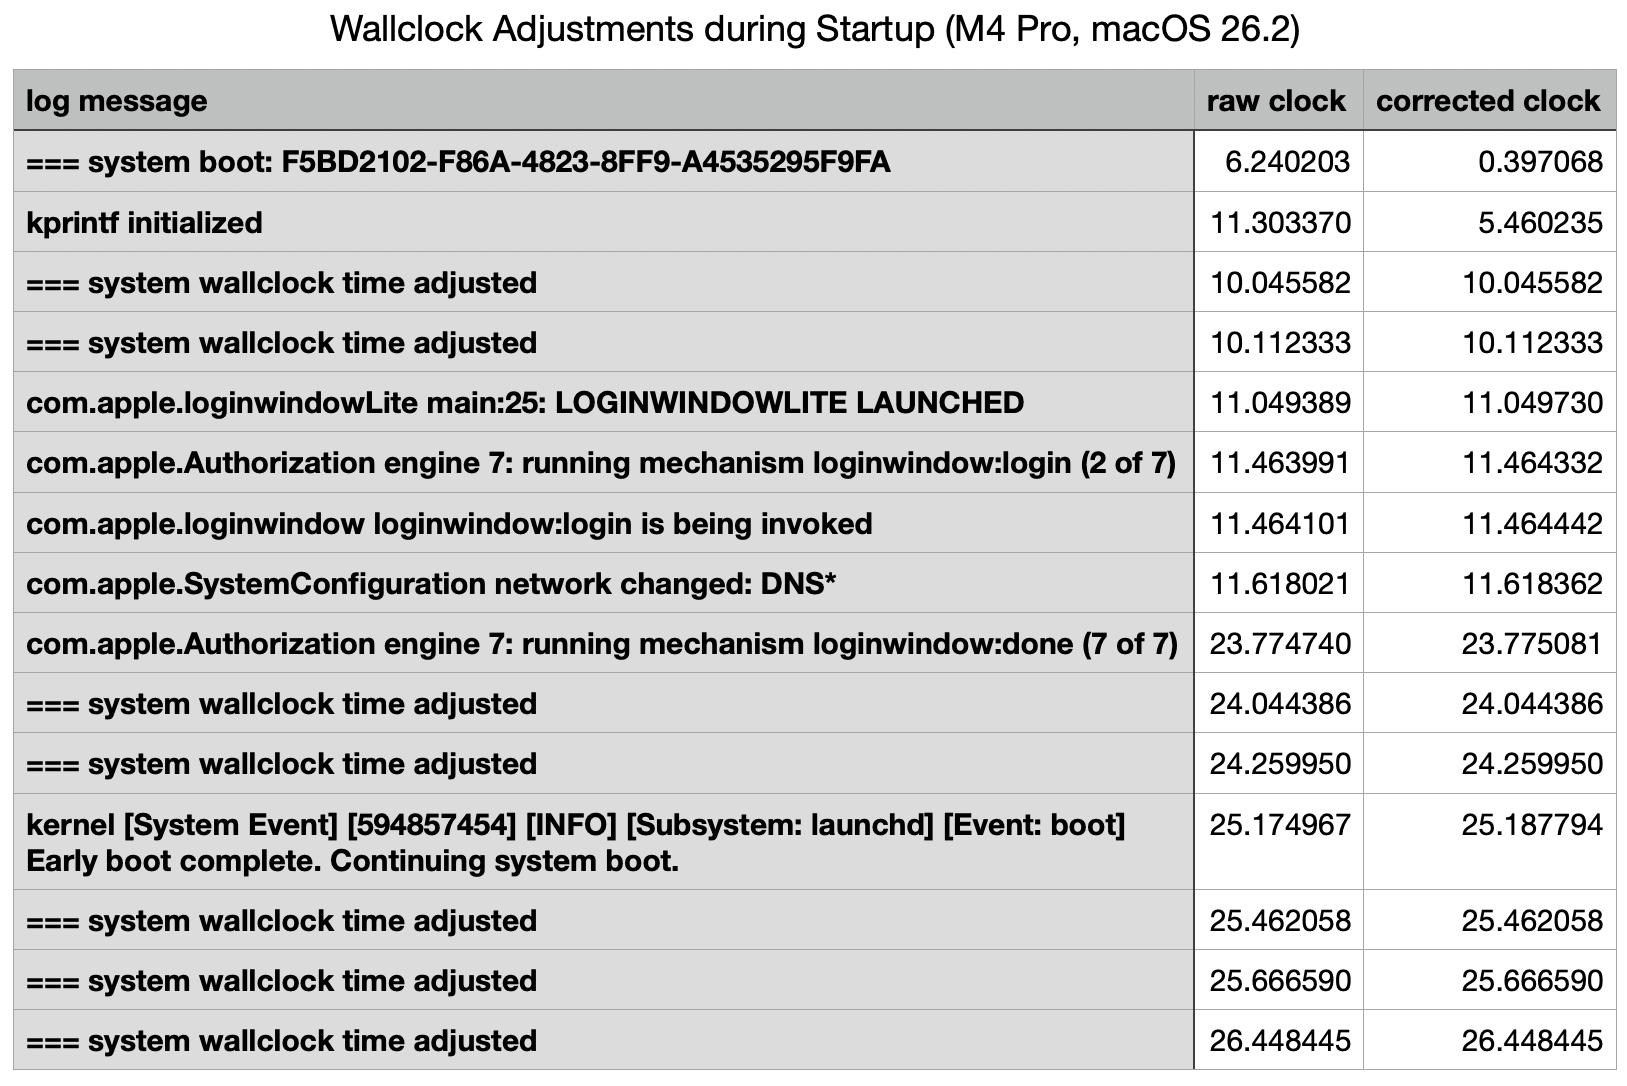
Multiple adjustments to wallclock time were recorded during that period, resulting in significant discontinuities in log timestamps. For example, 11:40:15.888717 void CoreAnalyticsHub::handleNagTimerExpiry(IOTimerEventSource *)::838:messageClients of 37 available events
11:40:10.045582 === system wallclock time adjusted
11:40:10.053309 000009.664065 Sandboxing init issue resolved: "Success"
11:40:10.053447 com.apple.sandbox.reporting Sandbox: wifiFirmwareLoader(49) deny(1) file-read-metadata /Library
11:40:10.112333 === system wallclock time adjusted
11:40:10.127559 com.apple.Installer-Progress Progress UI App Starting
In the first of those adjustments, the wallclock time was retarded by up to 5.84 seconds, and in the second it was advanced by at most 0.0589 seconds.
Because of those wallclock adjustments, times recorded in the log are discontinuous. Although it’s not possible to correct for the adjustments made completely accurately, assuming that each of those adjustments corresponds to standard time (such as UTC), those can be applied backwards through times recorded in the log to bring them closer to that standard. This could result in some brief periods of entries with times earlier than preceding entries, but is as accurate an estimate possible given the data.
Adjustments found
The narrative constructed from the log is summarised in the following table.
This starts with the initial record of the boot process, giving its UUID, within a second of the Power button being pressed (at approximately 0.0 seconds) to initiate the startup. That’s followed by a gap of just over 5 seconds before the second log entry.
The first two wallclock adjustments were made at 10 seconds, before there was any evidence of network connectivity. Those took place one second before the loginwindow was launched.
Two subsequent adjustments were made shortly after 24 seconds, immediately following the removal of the loginwindow after successful authentication. A further three adjustments followed in the 2.5 seconds after the user was logged in, while the Desktop and Finder were being prepared and displayed.
Log entries reporting the timed service was running didn’t occur until shortly before the last of those wallclock adjustments, and that was recorded in the log 0.0003 seconds before timed obtained its first external time.
Multiple internal clocks
A total of seven wallclock time adjustments were made before timed was able to obtain a time from any external reference. Over the first 10 seconds, before the initial wallclock adjustment, those were substantial, amounting to 5.8 seconds. For those changes to be made to wallclock time, there must be another source of time deemed more accurate, against which wallclock time can be compared and adjusted.
I’ve been unable to find any trustworthy information about internal clocks and timekeeping in Apple silicon Macs. It has been suggested (and Google AI is confident) that local reference time is obtained from the Secure Enclave. However, Apple’s only detailed account of features of the Secure Enclave fails to mention this. Initialisation of the Secure Enclave Processor also occurs relatively late during kernel boot, in this case at around the same time as the first two adjustments were made to wallclock time.
Conclusions
Apple silicon Macs may make multiple adjustments to wallclock time during startup, resulting in several discontinuities in log timestamps, which can cause discrepancies in event times.
Several of those can occur before the Mac has access to external time references, and timed is able to obtain an external time against which to adjust wallclock time.
Wallclock time can’t be the only local source of time, and appears to be adjusted against another local source.
Over the last few weeks, I’ve been posed a series of questions that can only be resolved using the log, such as why Time Machine backups are failing to complete. The common confounding factor is that something has gone wrong at an unknown time, but if you don’t know exactly what you’re looking for, nor when to look, the Unified log is a hostile place, no matter which tool you use to browse its constant deluge of entries.
This is compounded by the fact that errors seldom come singly, but often propagate into tens of thousands of consequential log entries, and those not only make the cause harder to find, but can shorten the period covered by the log. In the worst case, by the time you get to look for them, the entries you needed to find are lost and gone forever.
In late 2017, I experimented with a log browser named Woodpile that approached the log differently, starting from a histogram of frequencies of log entries from different processes.
Viewed across the whole of a log file, this could draw attention to periods with frequent entries indicating potential problems.
The user could then zoom into finer detail before picking a time period to browse in full detail. Of course, at that time the Unified log was in its early days, and entries were considerably less frequent than they are now today.
A related feature in my later Ulbow log browser provides similar insights over the briefer periods covered, but like Woodpile that view seems little used, and isn’t offered in LogUI.
Another concern is that a great deal of importance can be recorded in the log, but the user is left in the dark unless they hunt for it. I documented that recently for Time Machine backups, and note from others that this isn’t unusual. Wouldn’t it be useful to have a utility that could monitor the log for signs of distress, significant errors or failure? To a degree, that’s what The Time Machine Mechanic (T2M2) sets out to do, only its scope is limited to Time Machine backups, and you have to run it manually.
Given the sheer volume and frequency of log entries, trying to monitor them continuously in real time would have a significant impact on a Mac, even if this were to be run as a background process on the E cores of an Apple silicon Mac. In times of distress, when this would be most critical, the rate of log entries can rise to thousands per second, and any real-time monitor would be competing for resources just when they were most needed for other purposes.
A better plan, less likely to affect either the user or the many background services in macOS, would be to survey log events in the background relatively infrequently, then to look more deeply at periods of concern, should they have arisen over that time. The log already gives access to analysis, either through the log statistics command, or in the logdata.statistics files stored alongside the folders containing the log’s tracev3 files. Those were used by Woodpile to derive its top-level overviews.
Those logdata.statistics files are provided in two different formats, plain text and JSON (as JSON lines, or jsonl). Text files are retained for a shorter period, such as the last four days, but JSON data are more extensive and might go back a couple of weeks. I don’t recall whether JSON was provided eight years ago when I was developing Woodpile, but that app parses the current text format.
Keeping an eye on the log in this way overlaps little with Activity Monitor or other utilities that can tell you which processes are most active and using most memory, but nothing about why they are, unless you run a spindump. Those also only show current figures, or (at additional resource cost) a few seconds into the past. Reaching further back, several hours perhaps, would require substantial data storage. For log entries, that’s already built into macOS.
I can already see someone at the back holding up a sign saying AI, and I’m sure that one day LLMs may have a role to play in interpreting the log. But before anyone starts training their favourite model on their Mac Studio M3 Ultras with terabytes of log entries, there’s a lot of basic work to be done. It’s also worth bearing in mind Claude’s recent performance when trying to make sense of log entries.
Since macOS Ventura, if not in late releases of Monterey, macOS has been loading Safari and other parts of the operating system, including dyld caches, in cryptexes, instead of installing them in the Data volume. In addition to those, Apple silicon Macs with AI enabled load additional cryptexes to support its features. I detailed those for macOS 15.5 last summer; this article updates that information for macOS Tahoe 26.2.
Cryptexes
These first appeared on Apple’s customised iPhone, its Security Research Device, which uses them to load a personalised trust cache and a disk image containing corresponding content. Without the cryptex, engineering those iPhones would have been extremely difficult. According to its entry in the File Formats Manual from five years ago (man cryptex), ‘A cryptex is a cryptographically-sealed archive which encapsulates a well-defined filesystem hierarchy. The host operating system recognizes the hierarchy of the cryptex and extends itself with the content of that hierarchy. The name cryptex is a portmanteau for “CRYPTographically-sealed EXtension”.’
In practice, a cryptex is a sealed disk image containing its own file system, mounted at a chosen location within the root file system during the boot process. Prior to mounting the cryptex, macOS verifies it matches its seal, thus confirming it hasn’t been tampered with. Managing these cryptexes is the task of the cryptexd service with cryptexctl. Because cryptexes aren’t mounted in the usual way, they’re not visible in mount lists such as that produced by mount(8).
System cryptexes
Once kernel boot is well under way, APFS mounts containers and volumes in the current boot volume group, followed by others to be mounted at startup. When those are complete, it turns to mounting and grafting the three standard system cryptexes, os.dmg containing system components such as dyld caches, app.dmg containing Safari and its supporting components including WebKit, and os.clone.dmg a clone of os.dmg that shares its data blocks with os.dmg. Grafting all three takes around 0.034 seconds, and typically occurs over 15 seconds after APFS is started, and around 25 seconds after the start of boot.
AI cryptex collection
About 5 seconds after the system cryptexes have been grafted, APFS checks and grafts a series of cryptexes primarily involved with Apple Intelligence features. These are handled one at a time in succession, and are listed in the Appendix. Typical time required to complete this collection is less than 0.5 seconds.
Ten new AI cryptexes have been added in Tahoe, and five of Sequoia’s have been removed, bringing the total including the PKI trust store from 23 to 28. Notable among the additions are:
language instruction support for image tokenisation
support for drafting replies in Messages
suggesting action items in Reminders
support for Shortcuts
suggesting recipe items.
Conclusions
Apple silicon Macs running macOS 26.2 with AI enabled load 28 additional cryptexes to support AI.
One cryptex is a secure PKI trust store, whose volume name starts with Creedence.
These cryptexes are installed and updated as part of macOS updates, although they could also be installed or updated separately, for example when AI is enabled.
If a Mac shows an unusual mounted volume with a name starting with Creedence or Revival, that’s almost certainly the respective disk image, which should normally be hidden and not visible in the Finder.
Appendix
Disk image names for the main AI cryptex collection in macOS 26.2 (Apple silicon):
New cryptexes are shown in bold. When these are mounted, their volume names add the prefix RevivalB13M202xxx where xxx are ID digits for that cryptex. That prefix replaces RevivalB13M201xxx used in macOS 15.5.
Additionally, a volume is mounted as a PKI trust store, as Creedence11M6270.SECUREPKITRUSTSTOREASSETS_SECUREPKITRUSTSTORE_Cryptex.
The following cryptexes found in macOS 15.5 appear to have been removed from 26.2:
If anyone claims they have engineered something so you can set it and forget it, remind them of the third step in that process, where you come to regret it. Without attentive monitoring, any system is likely to fail without your being aware. Time Machine is a good example, and this article illustrates how it can fail almost totally without you being aware that anything has changed.
Scenario
I’ve recently been testing a security product on my Mac mini M4 Pro. One of its more novel features is device control similar to Apple’s Accessory Security for Apple silicon Mac laptops. I’m sure I’m not the only person who has wondered why that feature hasn’t been incorporated into desktop models, and here is a third-party developer doing just that and more. For their implementation lets you specify precisely which peripherals can be connected, down to the serial number of each SSD.
When I installed and went through the onboarding of this product, I naturally assumed that my Time Machine backup storage, an external SSD, would be allowed by this control, as it was connected at the time. At that time I was offered no option to manually allow it, and as its three volumes remained listed in the Finder’s Locations I didn’t check its settings.
When I started that Mac up the following day, I discovered that I had lost access to that external SSD. Its three volumes were still there in the Finder, but any attempt to open them failed with an error. I quickly disabled the device control feature, just in time to allow Time Machine to make its first hourly backup since 12:35 the previous day, just after I had installed the security software. Time Machine had happily gone that long without backing up or warning me that it had no backup storage.
Compare that with what would have happened with any other backup utility, such as Carbon Copy Cloner, which would have informed me of the error in terms loud and clear. I think this results from Time Machine’s set and forget trait, and its widespread use by laptop Macs that are often disconnected from their backup storage. Thankfully I hadn’t come to regret it, this time.
Evidence
Not only does Time Machine not draw the attention of the user to this error, but it can be hard to discover from the log. Run T2M2, for example, and the evidence is subtle: Times taken for each auto backup were 4.3, 0.5, 0.6, 10.5, 2.5, 0.8, 0.9, 0.7, 0.6 minutes,
intervals between the start of each auto backup were 86.6, 29.3, 1197.7, 55.5, 60.3, 60.1, 60.1, 60.3 minutes.
(Emphasis added.)
A gap of almost 20 hours between backups far exceeds the nine hours it was shut down overnight. But at the end, T2M2 reports No error messages found.
I know from the security software’s log that it had blocked access to the backup storage after Time Machine had completed the last of its hourly backups at around 12:35. This is what the next attempt to back up reported: 13:23:54.382 Failed to find any mounted disk matching volume UUIDs: {("A3A3DADA-D88E-499B-8175-CC826E0E3DE4")}
13:23:54.382 Skipping scheduled Time Machine backup: No destinations are potentially available
13:23:54.487 attrVolumeWithMountPoint 'file:///Volumes/VMbackups/' failed, error: Error Domain=NSPOSIXErrorDomain Code=1 "Operation not permitted"
13:23:54.488 attrVolumeWithMountPoint 'file:///Volumes/OWCenvoyProSX2tb/' failed, error: Error Domain=NSPOSIXErrorDomain Code=1 "Operation not permitted"
13:23:54.489 attrVolumeWithMountPoint 'file:///Volumes/Backups%20of%20MacStudio%20(7)/' failed, error: Error Domain=NSPOSIXErrorDomain Code=1 "Operation not permitted"
13:23:59.103 attrVolumeWithMountPoint 'file:///Volumes/VMbackups/' failed, error: Error Domain=NSPOSIXErrorDomain Code=1 "Operation not permitted"
13:23:59.104 attrVolumeWithMountPoint 'file:///Volumes/OWCenvoyProSX2tb/' failed, error: Error Domain=NSPOSIXErrorDomain Code=1 "Operation not permitted"
13:23:59.104 attrVolumeWithMountPoint 'file:///Volumes/Backups%20of%20MacStudio%20(7)/' failed, error: Error Domain=NSPOSIXErrorDomain Code=1 "Operation not permitted"
Time Machine then fell back to what it has long been intended to do in such circumstances, making a local snapshot of the volume it should have backed up. This starts with a full sync of buffers to disk storage, 13:23:59.876 FULLFSYNC succeeded for '/System/Volumes/Data'
in preparation for that snapshot 13:24:00.024 Created Time Machine local snapshot with name 'com.apple.TimeMachine.2026-01-12-132359.local' on disk '/System/Volumes/Data'
These were repeated at 14:24:06.638, and hourly thereafter until the Mac was shut down. Accompanying those few entries were tens of thousands of errors from APFS and Time Machine.
The only clue as to the cause was a single log entry 14:24:06.805543 EndpointSecurity ES_AUTH_RESULT_DENY: event 1
in which Endpoint Security is logging the event that access to the external device was denied.
Lesson
If you do just set it and forget it, you will come to regret it. Attentive monitoring is essential, and when anything does go wrong, don’t pass over it in silence.
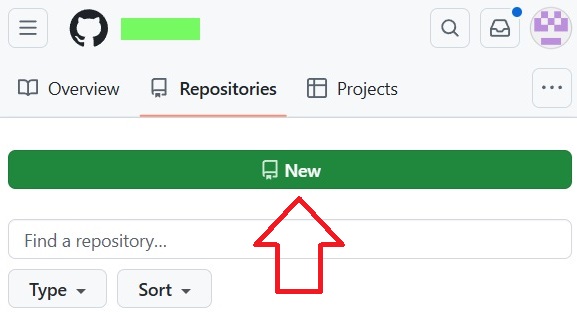
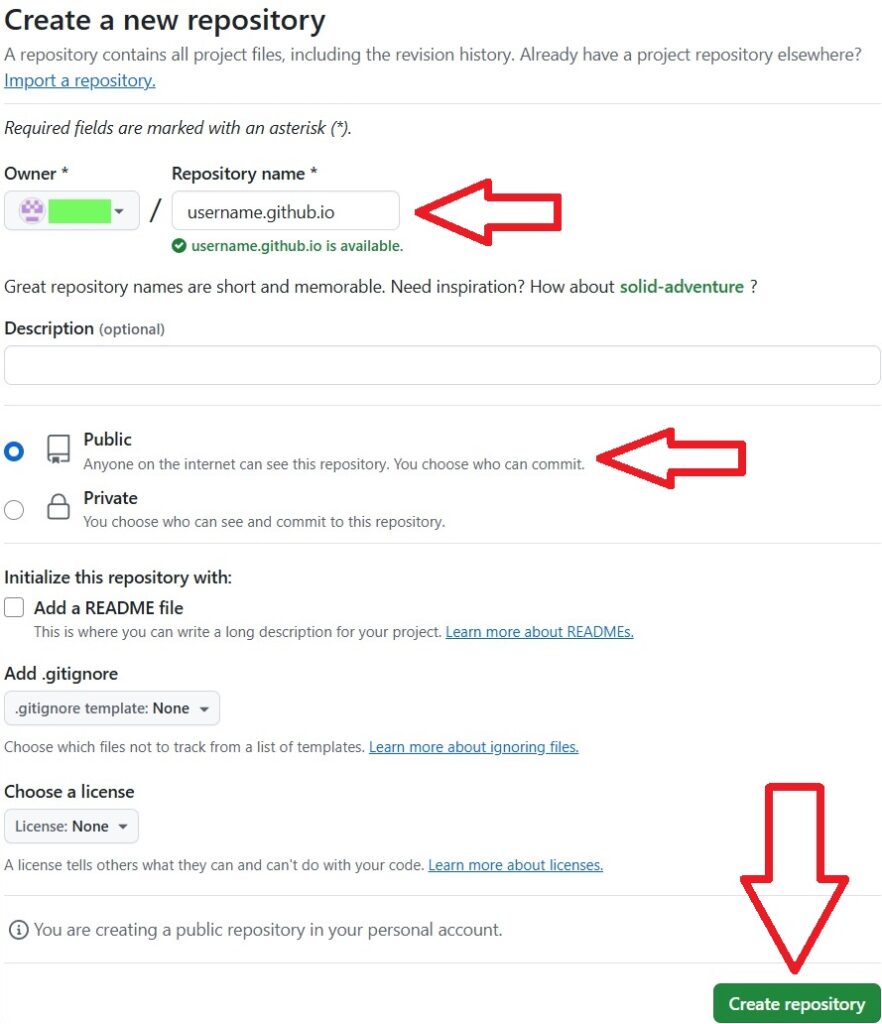
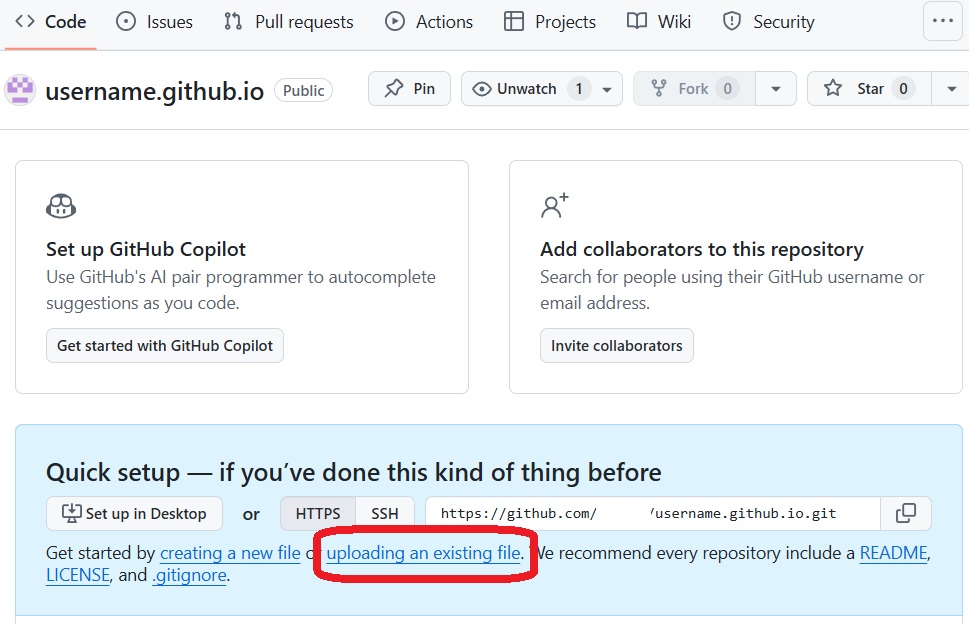
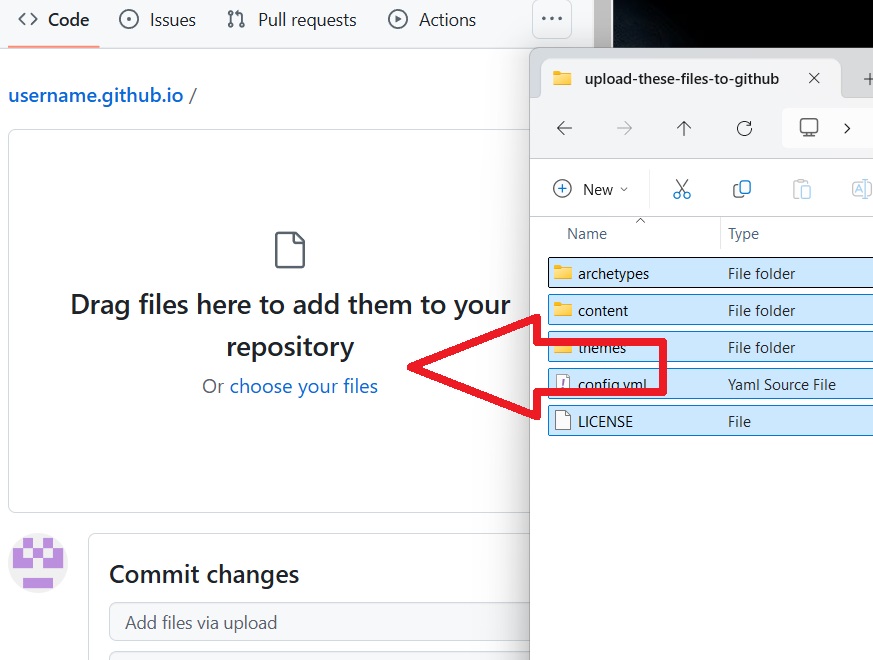
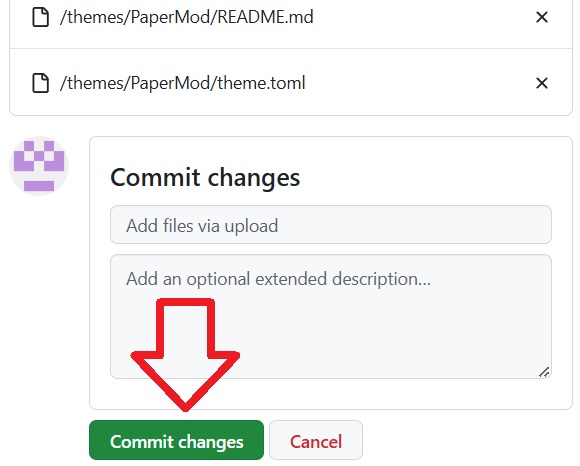
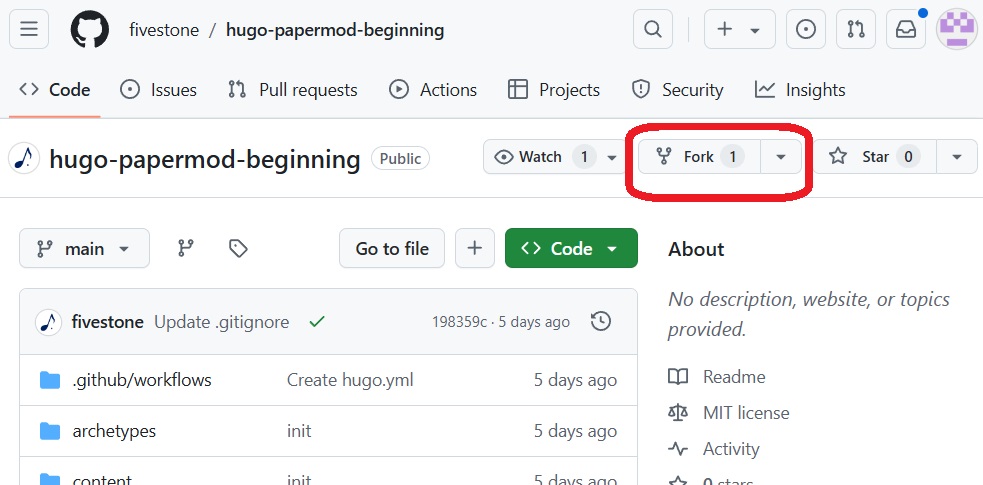
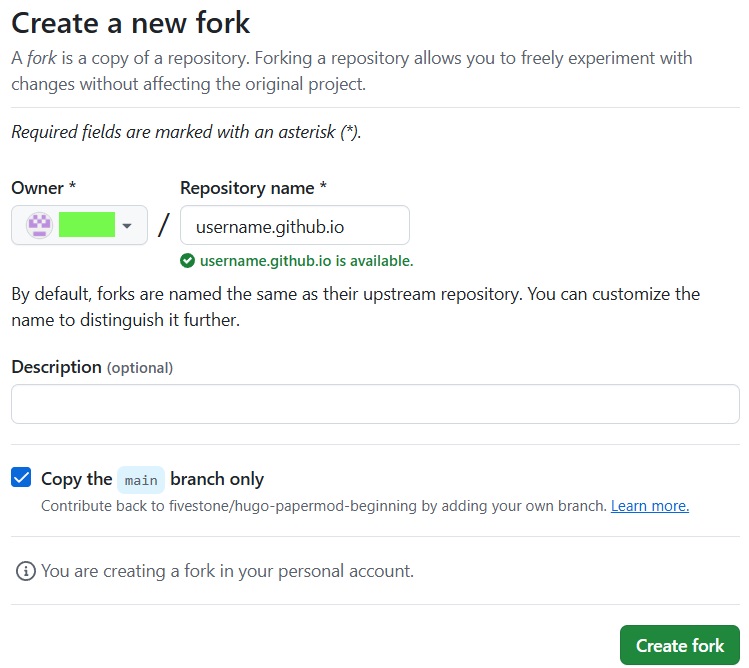
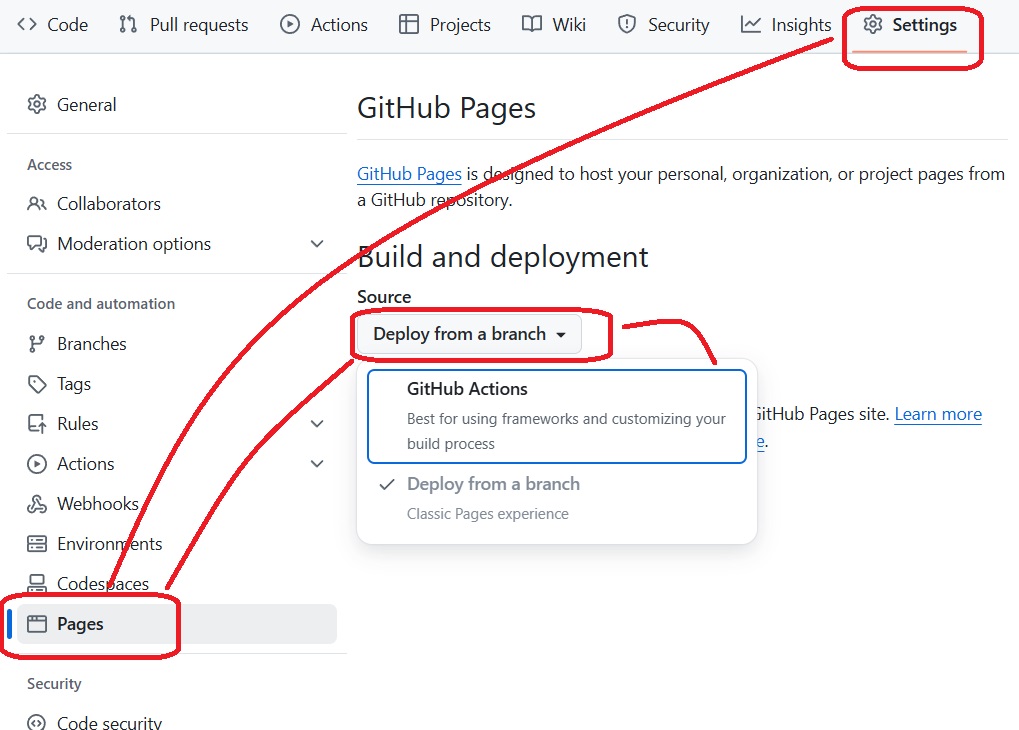
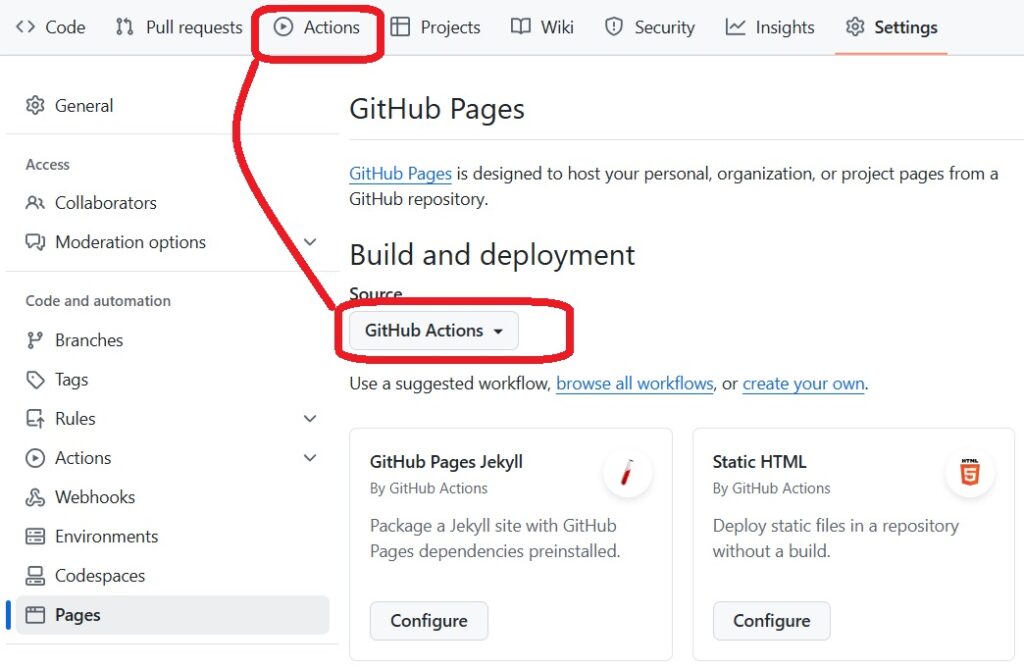
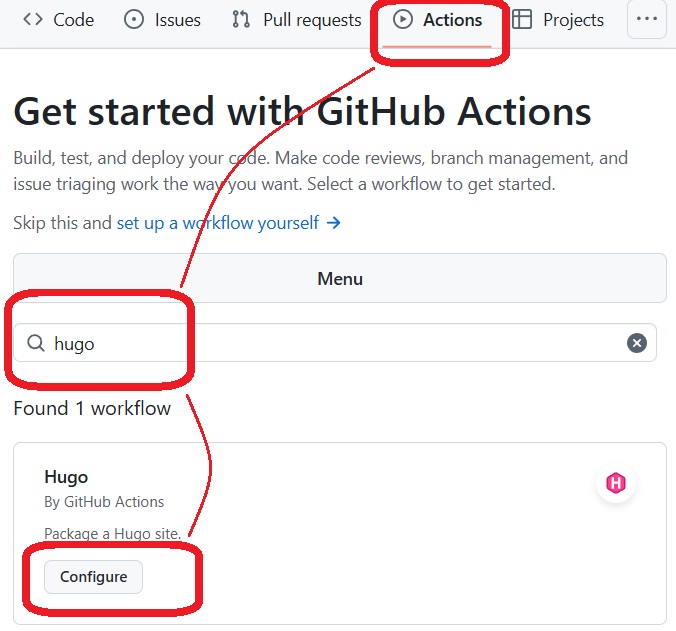
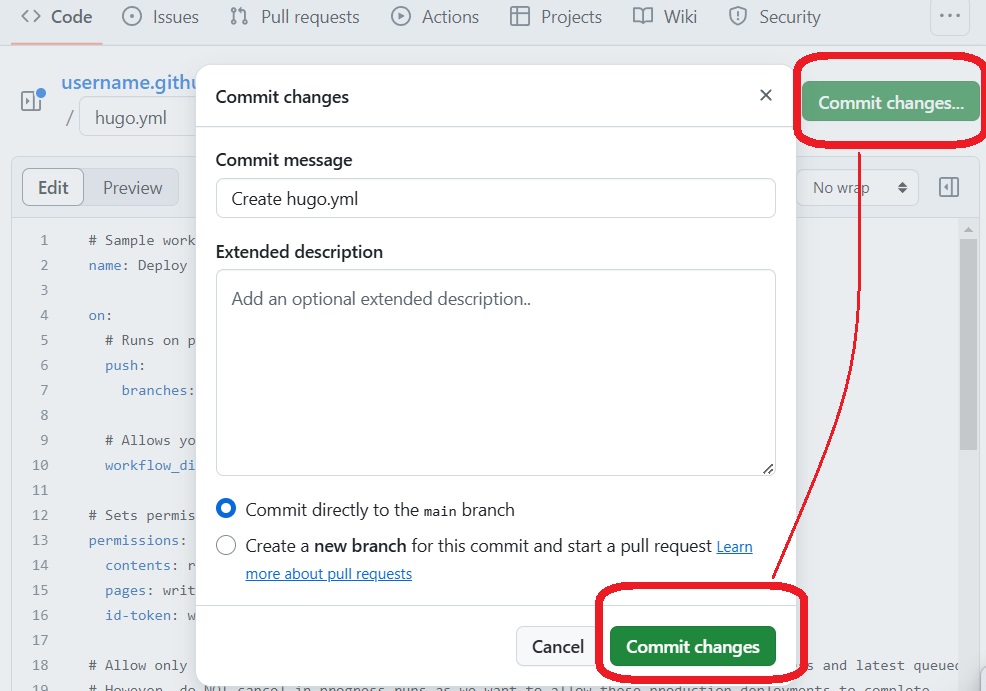
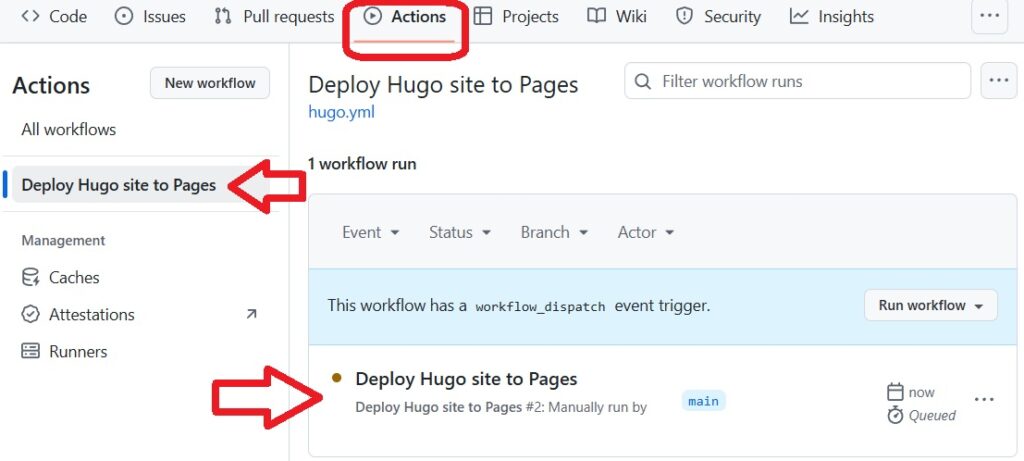
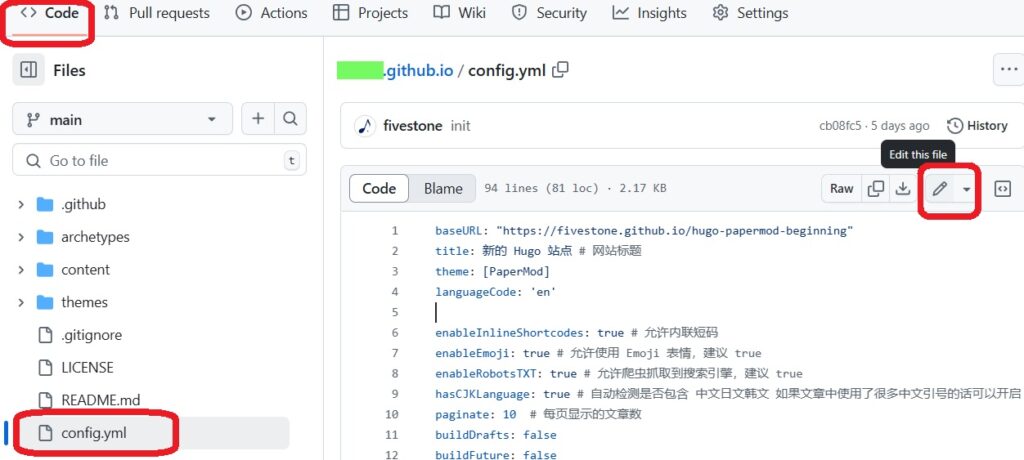
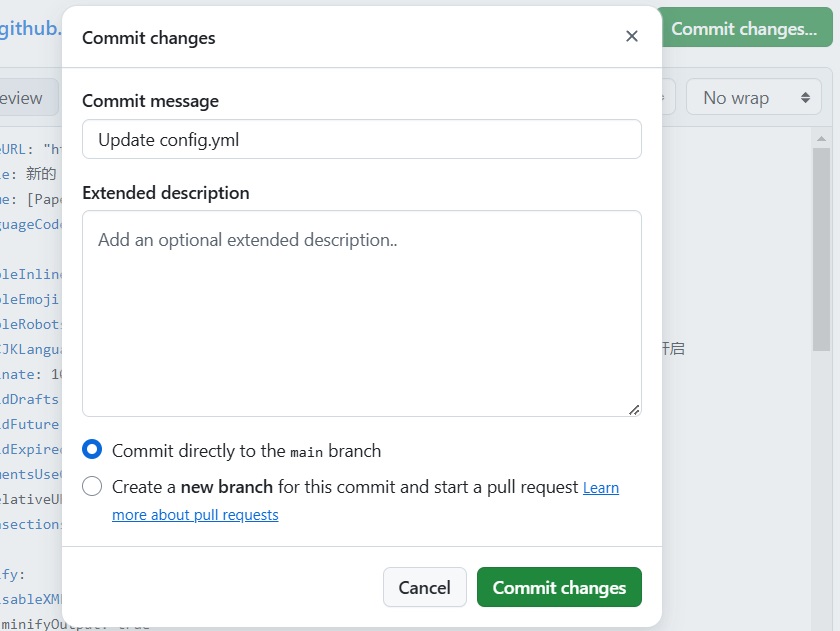
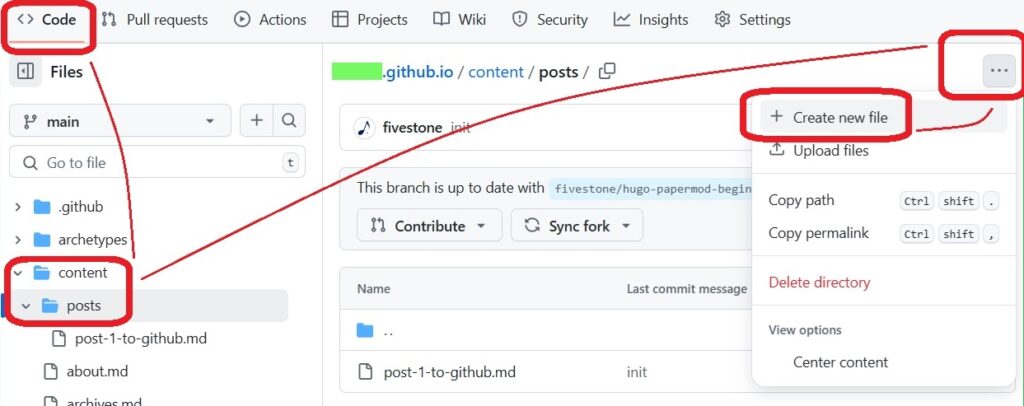
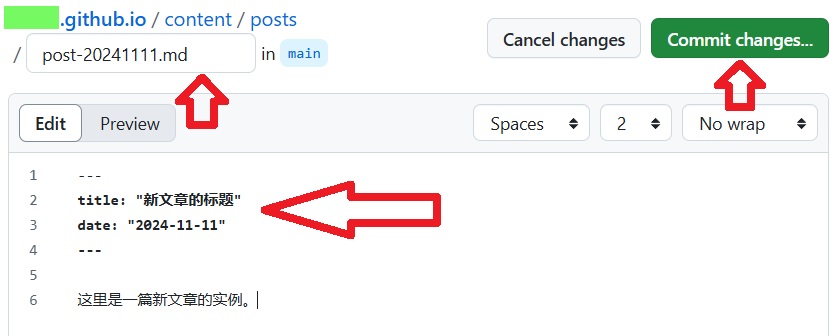
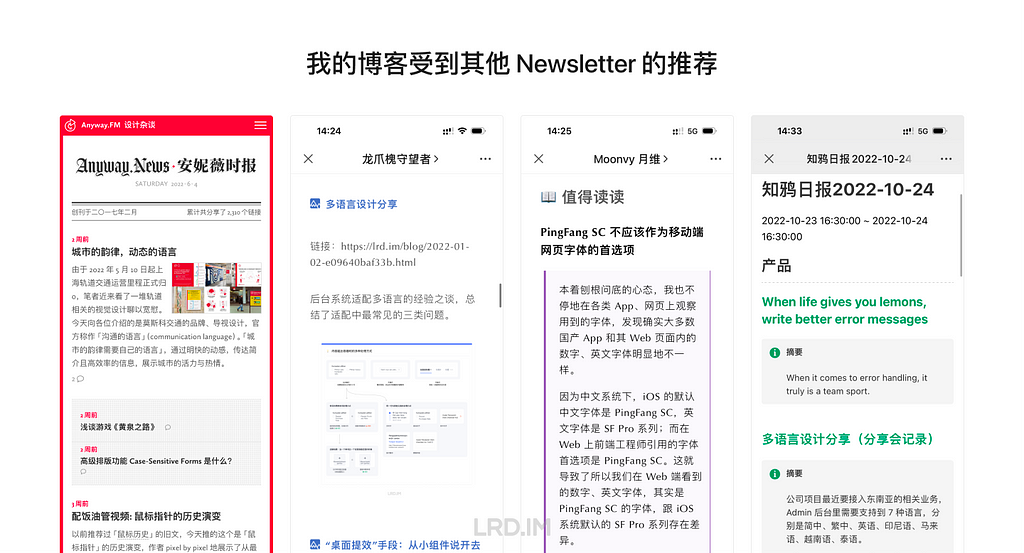
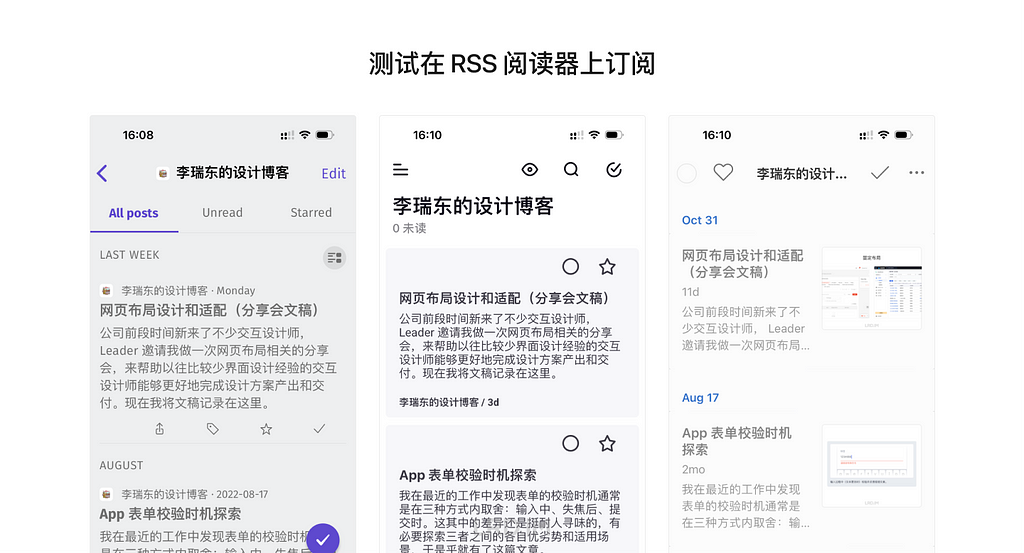
我其实对 Hugo 不熟,不知道这算不算重新发明了一遍轮子。但我搜索「如何在 github 上,用 hugo 架设自己的 blog?」时,搜到的教程,都需要用户在自己的电脑上,安装运行各种 git 和 hugo 的相关命令,感觉对新手并不友好。所以,我试着写了一个流程,让新人完全只需要在网页浏览器上操作,就能快速生成自己的 blog 网站。
在这次「封面图事故」之前,我就有换新的的想法了。一方面确实是,在日常写作和新增一些页面时会明显感觉到这种技术上的代际差,只是自己懒得动,能用就不改。我相信大部分程序员也是这么想的,代码屎山不就是这么回事嘛。但如果只是换个模版,其实不用想那么久,所以另一方面更核心的是,我在同时考虑把博客的套餐升级到 Explorer 版,还想提前买下后面几年的域名使用权,因此,在我心里,模版的更新、升级、域名这三件事是合并在一起考虑的。
作为童年爱好,这个 blog 曾经把「摄影」作为一个二层分类的顶端,下面包括很多细微的分类:拍的照片、心得、理论讨论……甚至还有过一个摄影 blog,后来停掉了,也没有合并过来。这边还多多少少留了些,就先堆在这里。——所以心中还是对此有爱的吧。要知道,连 IT 类原创都没资格独占一个分类,而是胡乱塞进 /tech /fyi /misc 里面……
In the past, my blog was hosted on Tencent Cloud using Typecho. Unfortunately, due to unforeseen circumstances, I lost ownership of that machine along with all my previous posts. Consequently, I took a hiatus from blogging, remaining in a state of silence for a few years. However, I now realize the importance of reviving my blog before lethargy engulfs me.
After conducting extensive research and considering various platforms such as Ghost, WordPress, Typecho ,Hugo and some other platforms, I finally settled on Ghost. Its remarkable speed, plethora of customized themes, aesthetically pleasing web user interface, and integrated membership system influenced my decision.
Check out all the cool stuff Ghost has to offer on their website below:
Due to the absence of Ghost in the NixOS packages, and the cumbersome nature of adapting it into a NixOS service, Docker has emerged as an excellent solution for hosting Ghost. Here, I have provided a comprehensive breakdown of the steps I followed to set up a blog using Ghost with Docker on NixOS. This can be modified to use on other platforms.
Step 0: Enable Docker on NixOS
Enabling Docker(Podman) on NixOS is a straightforward process, requiring modification of just one configuration file. I personally prefer using the vim editor, but feel free to use your preferred tool such as nano, emacs, or VS Code.
The initial step involves logging into the machine, particularly if it is being used as a server.
ssh ${username}@${server IP}
Then, we can start to modify the configuration file:
sudo vim /etc/nixos/configuration.ni
There are two ways of adding Docker to the NixOS system: for all users:
environment.systemPackages = with pkgs; [
  docker
];
And for one user only:
users.users.${username}.packages = with pkgs; [
  docker
];
You can choose either way based on your needs. The next step is to enable the Docker service.
Note that we're using oci-containers to control Dockers. If you have chosen to install Podman, remember to modify it accordingly. Some may question why we're not using docker-compose; this is a simple answer – we embrace the capabilities of NixOS, and that suffices.
Last, remember to create a directory for docker to use. Here's my example:
mkdir ~/.docker
Step 1: Set up Docker Network
Using the Docker CLI command docker network will indeed create the network, but it may not be the optimal approach. Since we're operating within the context of NixOS, we can add it as a service. Add the following code snippet to your configuration.nix file, ensuring to customize the name according to your requirements. In my case, I'm utilizing npm as an example since I'm employing nginx-proxy-manager as my Nginx reverse proxy service.
systemd.services.init-docker-ghost-network-and-files = {
  description = "Create the network npm for nginx proxy manager using reverse proxy.";
  after = [ "network.target" ];
  wantedBy = [ "multi-user.target" ];

  serviceConfig.Type = "oneshot";
  script =
    let dockercli = "${config.virtualisation.docker.package}/bin/docker";
    in ''
      # Put a true at the end to prevent getting non-zero return code, which will
      # crash the whole service.
      check=$(${dockercli} network ls | grep "npm" || true)
      if [ -z "$check" ]; then
        ${dockercli} network create npm
      else
        echo "npm already exists in docker"
      fi
    '';
};
Step 2: Set up Mysql for Ghost
We will now proceed with crafting Docker configurations. The initial step involves creating an external directory for MySQL to store its data, ensuring that we can modify MySQL without accessing the Docker environment directly. At present, this MySQL database is exclusively intended for Ghost; however, you have the freedom to tailor it according to your specific requirements.
mkdir ~/.docker/ghost-blog/mysql -p
Please add the following snippet to your configuration file as well:
Within this section, we configure the port mapping, environment variables, and volume mapping. Please note that you should customize the MySQL configurations in accordance with your specific setup in the final step.
Mail Server Set Up
Taking Gmail as an example, please note that you can modify this configuration according to your specific needs.
Please remember that the Google app password mentioned here is different from your actual Google account password. You can generate a Google app password by following the steps outlined in the Sign in with app passwords guide.
By configuring these settings, visitors will be able to sign up and leave comments on our website.
More Custom Options
Please refer to the instructions provided on the Ghost website at the following link:
There are numerous articles available on the internet that explain how to set up Nginx as a system service or utilize nginx-proxy-manager as a Docker service. For the purpose of this example, I will demonstrate the Docker service approach. Remember to create the necessary folders as well.
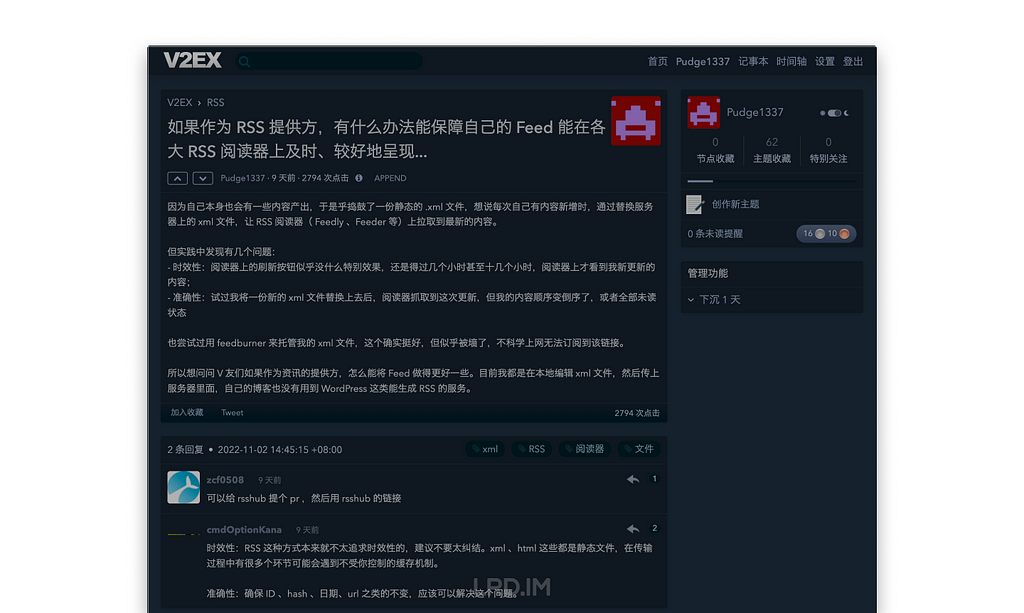
但我看到这个问题时,首先想到的,一个很重要的因素:大概是因为,这个站就一直在这儿吧~ 我的技术能力,不需要花什么额外的精力,就能让这个 blog 一直存活下去。于是,想写东西的时候,这里始终有个地方,可以让我写。
——也有很多时期,是完全写不下去的,长时期没法去面对、去反刍自己的生活;然而也没必要因此而关站,就让 blog 存活在那里,终归是个表述的出口。大概是因为,我也是希望,自己能够从那些「无法整理自己」的状态中,渐渐走出来,回复到可以写东西的状态吧。所以站点的持续存在,满重要的,因为确实能感觉到,想写点什么的时候,如果没有这么个站,又或者需要自己重新架一个,可能也就不写了……
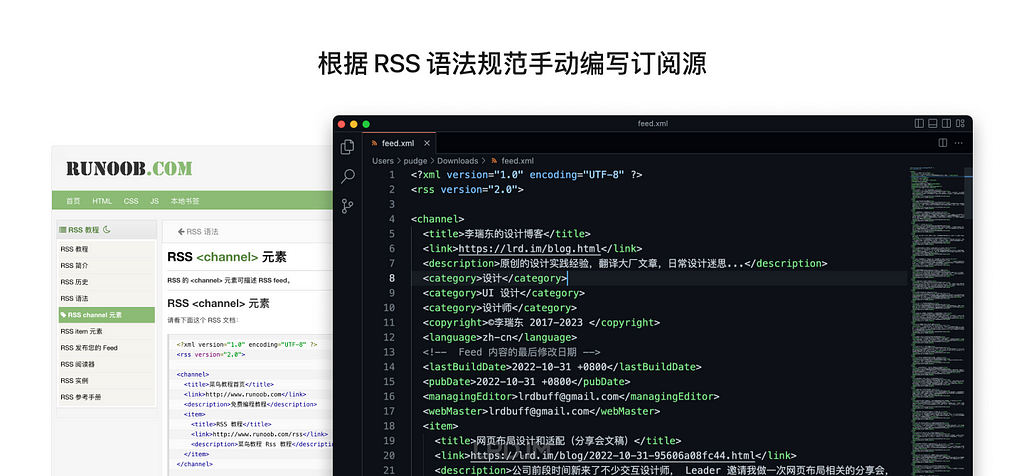
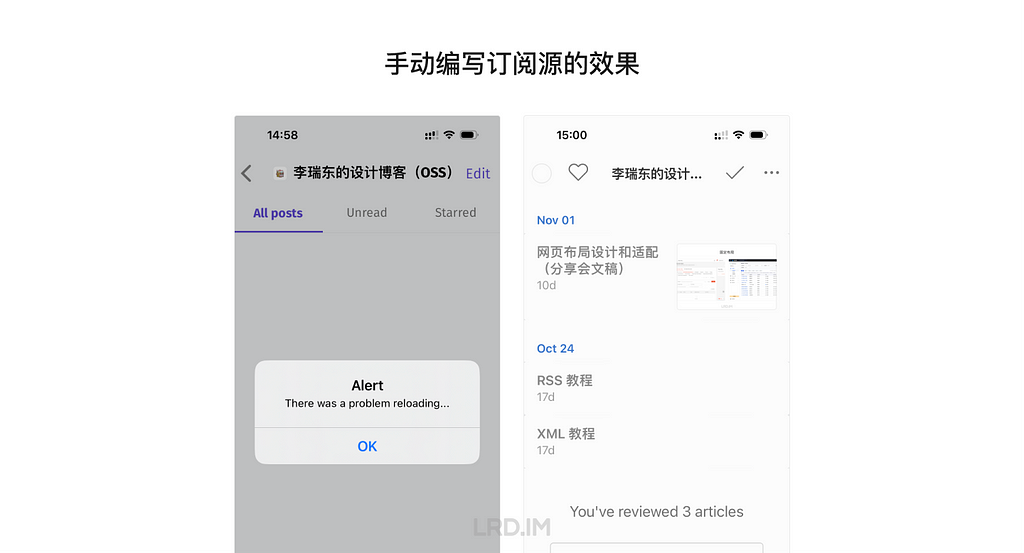
这种「随时可以在站点写东西」的状态,也影响着对 blog 平台的选择(怎么又拐到技术贴去了?好吧,之前也一直想吐槽这方面,就顺带提一下)。这些年一直有 〖wordpress vs 各种静态博客〗哪个更好的争论。双方确实各有利弊。总体来说,静态博客最大的优点就是……省钱,可以薅 github、vercel 之类托管网站的羊毛。但另一方面,静态博客每次发布、或者修改一篇文章的过程,其实满折腾的。通常情况下,它需要
好像也是可以通过一系列操作,实现用浏览器某个网站上编辑文章,然后自动编译发布到托管网站的。我没有仔细去关注。但是,如果把 blog 的生命周期,放到 5~10 年这个尺度上,那么这些网站之间的复杂依赖关系,很大程度上是不靠谱的。譬如我已经看到好几个静态 blog 的外挂评论系统,不知为什么不工作了……总之,相比之下,我可能更宁愿去使用那些免费带广告的 blog 平台。
我对写 blog 的新人的推荐,一直是——
如果有技术能力、也有服务器的话,自建 wordpress;
或者找人蹭一个。如果我们比较熟,你可以去买个域名,把 blog 挂在我的服务器上。这并不是很大的负担。(ps,个人 wordpress 小站,是可以不必安装开销很大的 mysql 数据库的);
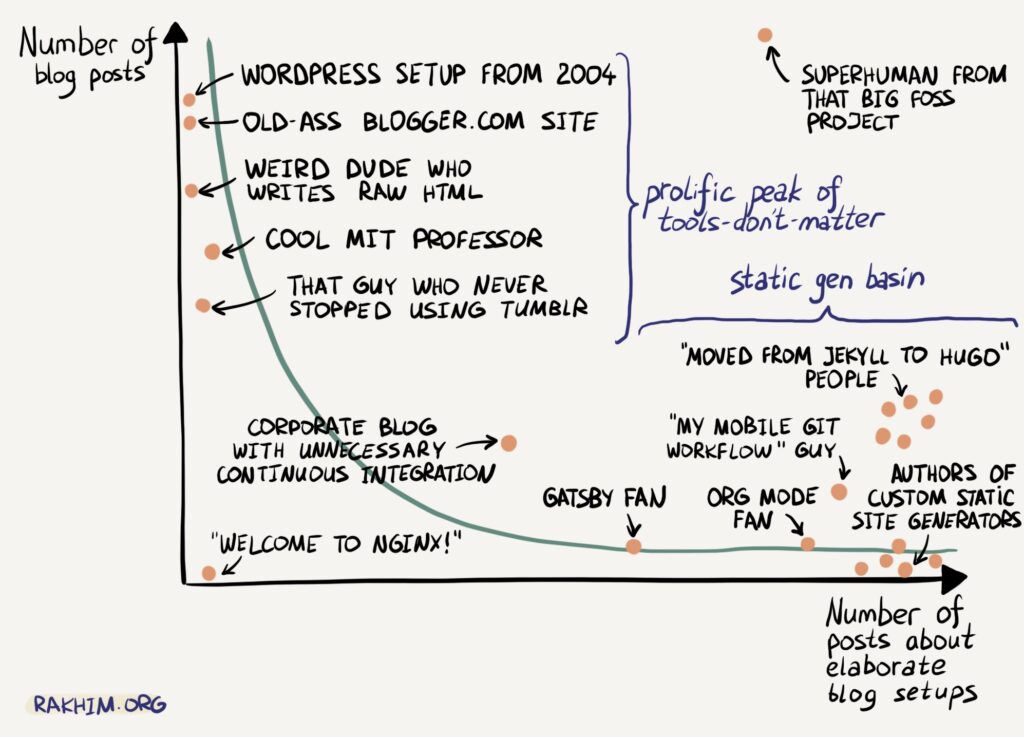
转一张图,对于熟悉这十几年来 blog 平台变迁的人,应该会很搞笑:用不同工具写 blog 的人,(写 blog 文章)vs(写关于怎么配置 blog 的文章)的对比。右下角那些术语,都是在各个年代,需要各种不同程度的折腾的,静态 blog 方案:gatsby、org mode、jekyll、hugo、git workflow……


 观看视频:
观看视频:

 (Abstract)终于不用再搞“先放大再缩小”这种傻操作了。