Reading view

There are new articles available, click to refresh the page.

Explainer: % CPU in Activity Monitor

The faster and more sophisticated the CPUs in our Macs get, the more anguished we get over their activity and performance. While there are alternatives that can display measurements of CPU activity in the menu bar and elsewhere, the most available tool is Activity Monitor. This article explains what it displays as % CPU, and how that needs careful interpretation.
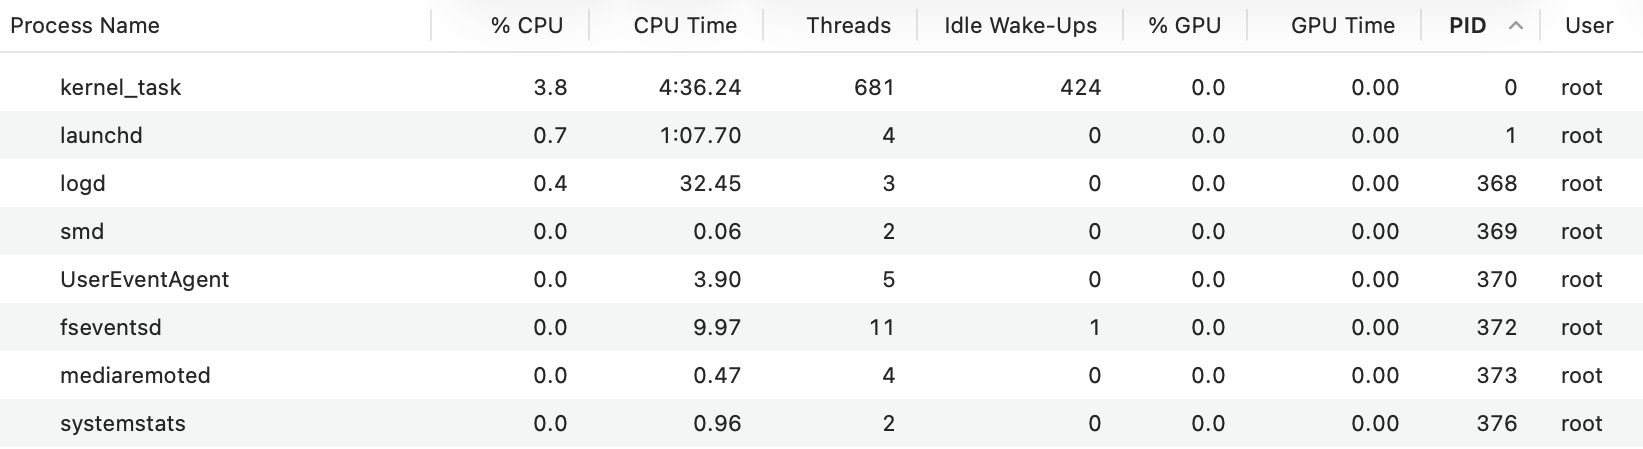
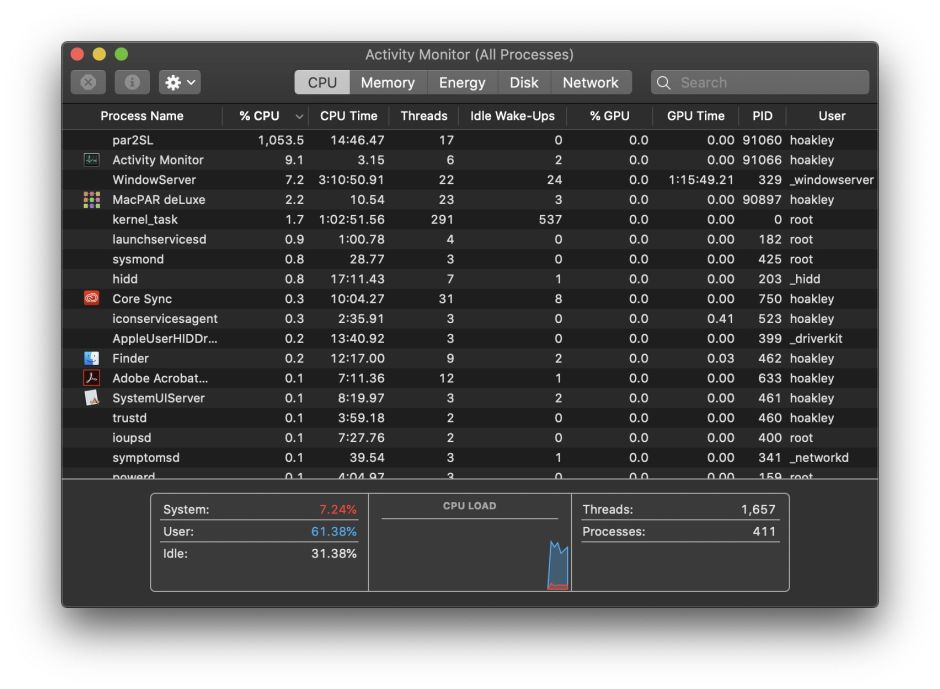
Activity Monitor

The CPU view in Activity Monitor samples CPU and GPU activity over brief periods of time, displays results for the last sampling period, and updates those every 1-5 seconds. You can change the sampling period used in the Update Frequency section of the View menu, and that should normally be set to Very Often, for a period of 1 second.

This was adequate for many purposes with older M-series chips, but thread mobility in more recent chips can be expected to move threads from core to core, and between whole clusters, at a frequency similar to available sampling periods. That loses detail as to what’s going on in cores and clusters, and may give the false impression that a single thread is running simultaneously on multiple cores.

However, sampling frequency also determines how much % CPU is taken by Activity Monitor itself. While periods of 0.1 second and less are feasible with the command tool powermetrics, in Activity Monitor they would start to affect its results. If you need to see finer details, then you’ll need to use Xcode Instruments or powermetrics instead.

% CPU

The heart of the CPU view is what Activity Monitor refers to as % CPU, defined as the “percentage of CPU capability that’s being used by processes”. As far as I can tell, this is essentially the same as active residency in powermetrics, and it’s central to understanding its strengths and shortcomings.

Take a CPU core that’s running at 1 GHz. Every second it ‘ticks’ forward one billion times. If an instruction were to take just one clock cycle, then it could execute a billion of those every second. In any given second, that core is likely to spend some time idle and not executing any instructions. If it were to execute half a billion instructions in any given second, and spend the other half of the time idle, then it has an idle residency of 50% and an active residency of 50%, and that would be represented by Activity Monitor as 50% CPU. So a CPU core that’s fully occupied executing instructions, and doesn’t idle at all, has an active residency of 100%.

Expressed more formally, residency is the percentage of time a core is in a specific state. Idle residency is thus the percentage of time that core is idle and not processing instructions. Active residency is the percentage of time it isn’t idle, but is actively processing instructions. Down residency, a feature of more recent cores, is the percentage of time the core is shut down. All these are independent of the core’s frequency or clock speed.

To arrive at the % CPU figures shown in Activity Monitor, the active residency of all the CPU cores is added together. If your Mac has four P and four E cores and they’re all fully occupied with 100% active residency each, then the total % CPU shown will be 800%.

Cautions

There are two situations where this can be misleading if you’re not careful.

Intel CPUs feature Hyper-threading, where each physical core acquires a second, virtual core that can also run at another 100% active residency. In the CPU History window those virtual cores are shown with even numbers, and in % CPU they double the total percentage. So an 8-core Intel CPU then has a total of 16 cores, and can reach 1,600% when running flat out with Hyper-threading.

coremanintel

This eight-core Intel Xeon runs a short burst with full Hyper-threading, during which it gains the eight virtual cores seen on the right. According to the % CPU in Activity Monitor shown below, it was then running at over 1,000%.

cpuendstop

The other situation affects Apple silicon chips, as their CPU cores can be run at a wide range of different frequencies under the control of macOS. However, Activity Monitor makes no allowance for their frequency. When it shows a core or total % CPU, that could be running at a frequency as low as 600 MHz in the M1, or as high as 4,512 MHz in the M4, nine times as fast. Totalling these percentages also makes no allowance for the different processing capacity of Performance and Efficiency cores.

Thus an M4 chip’s CPU cores could show a total of 400% CPU when all four E cores are running at 1,020 MHz with 100% active residency, or when four of its P cores are running at 4,512 MHz with 100% active residency. Yet the P cores would have an effective throughput of as much as six times that of the E cores. Interpreting % CPU isn’t straightforward, as nowhere does Activity Monitor provide core frequency data.

tuneperf1

In this example from an M4 Pro, the left of each trace shows the final few seconds of four test threads running on the E cores, where they took 99 seconds to complete at a frequency of around 1,020 MHz, then in the right exactly the same four test threads completed in 23 seconds on P cores running at nearer 4,000 MHz. Note how lightly loaded the P cores appear, although they’re executing the same code at almost four times the speed.

Threads and more

For most work, you should display all the relevant columns in the CPU view, including Threads and GPU.

tuneperf2

Threads are particularly important for processes to be able run on multiple cores simultaneously, as they’re fairly self-contained packages of executable code that macOS can allocate to a core to run. Processes that consist of just a single thread may get shuffled around between different cores, but can’t run on more than one of them at a time.

Another limitation of Activity Monitor is that it can’t tell you which threads are running on each core, or even which type of core they’re running on. When there are no other substantial threads active, you can usually guess which threads are running where by looking in the CPU History window, but when there are many active threads on both E and P cores, you can’t tell which process owns which thread.

Beachballing

A common mistake is to assume that high % CPU is somehow related to the appearance of a spinning beachball pointer. Although they can be related, they tell you different things about threads, processes and apps.

spinningbeachball

If you look in the Force Quit Applications window when an app is spinning a beachball, it doesn’t tell you anything about how much % CPU the app is taking, merely that the app is unresponsive. The most common cause of that is when the app’s main thread is too busy with a task to check in with macOS periodically.

All apps have a main thread, and many also have additional threads that handle time-consuming or computationally-intensive work. In most cases, well-written apps will avoid the main thread getting bogged down and unresponsive. One of the most common examples of this is with connections to remote sites. If those are handled in the main thread, then the whole app could be waiting for a slow-responding server to deliver its data, during which the app will be unresponsive, and macOS displays the spinning beachball.

The solution there is to handle the Internet connection asynchronously, allowing the main thread to get on with interacting with the user. When a background thread receives its data from the remote server, it can then update the main thread with that information.

Sometimes time-consuming tasks have to be handled in the main thread, and there may be no way to avoid unresponsiveness, but those are unusual if not exceptional now. At the same time, the appearance of the spinning beachball doesn’t mean that app has crashed or frozen, and it may well just be trying to get on with its work as well as it can in the circumstances.

It’s easy for an app to spin the beachball when it’s taking far less than 100% CPU, and many apps that can take over 500% in the right circumstances should remain fully responsive throughout.

Key points

  • % CPU is the percentage of time that CPU core isn’t idle, but is actively processing instructions. It takes no account of core type or frequency.
  • Total % CPU is the total of all individual values for CPU cores, and a maximum of 100% times the number of cores. For a chip with 8 cores, maximum total % CPU is 800%.
  • This can become confused in Intel CPUs with Hyper-threading, as that adds another set of virtual cores.
  • Apple silicon CPU cores operate at a wide range of frequencies, which aren’t taken into account in % CPU.
  • High % CPU is completely different from what happens when an app spins the beachball, which is the result of the app’s main thread becoming unresponsive.
  • An app can spin the beachball when its total % CPU is relatively low, and an app with a high total % CPU may remain highly responsive.

Last Week on My Mac: Why E cores make Apple silicon fast

If you use an Apple silicon Mac I’m sure you have been impressed by its performance. Whether you’re working with images, audio, video or building software, we’ve enjoyed a new turn of speed since the M1 on day 1. While most attribute this to their Performance cores, as it goes with the name, much is in truth the result of the unsung Efficiency cores, and how they keep background tasks where they should be.

To see what I mean, start your Apple silicon Mac up from the cold, and open Activity Monitor in its CPU view, with its CPU History window open as well. For the first five to ten minutes you’ll see its E cores are a wall of red and green with Spotlight’s indexing services, CGPDFService, mediaanalysisd, BackgroundShortcutRunner, Siri components, its initial Time Machine backup, and often an XProtect Remediator scan. Meanwhile its P cores are largely idle, and if you were to dive straight into using your working apps, there’s plenty of capacity for them to run unaffected by all that background mayhem.

handecpuhistory

It’s this stage that scares those who are still accustomed to using Intel Macs. Seeing processes using more than 100% CPU is terrifying, because they know that Intel cores can struggle under so much load, affecting user apps. But on an Apple silicon Mac, who notices or cares that there’s over a dozen mdworker processes each taking a good 50% CPU simultaneously? After all, this is what the Apple silicon architecture is designed for. Admittedly the impression isn’t helped by a dreadful piece of psychology, as those E cores at 100% are probably running at a frequency a quarter of those of P cores shown at the same 100%, making visual comparison completely false.*

This is nothing new. Apple brought it to the iPhone 7 in 2016, in its first SoC with separate P and E cores. That’s an implementation of Arm’s big.LITTLE announced in 2011, and development work at Cray and elsewhere in the previous decade. What makes the difference in Apple silicon Macs is how threads are allocated to the two different CPU core types on the basis of a metric known as Quality of Service, or QoS.

As with so much in today’s Macs, QoS has been around since OS X 10.10 Yosemite, six years before it became so central in performance. When all CPU cores are the same, it has limited usefulness over more traditional controls like Posix’s nice scheduling priority. All those background tasks still have to be completed, and giving them a lower priority only prolongs the time they take on the CPU cores, and the period in which the user’s apps are competing with them for CPU cycles.

With the experience gained from its iPhones and other devices, Apple’s engineers had a better solution for future Macs. In addition to providing priority-based queues, QoS makes a fundamental distinction between those threads run in the foreground, and those of the background. While foreground threads will be run on P cores when they’re available, they can also be scheduled on E cores when necessary. But background threads aren’t normally allowed to run on P cores, even if they’re delayed by the load on the E cores they’re restricted to. We know this from our inability to promote existing background threads to run on P cores using St. Clair Software’s App Tamer and the command tool taskpolicy.

This is why, even if you sit and watch all those background processes loading the E cores immediately after starting up, leaving the P cores mostly idle, macOS won’t try running them on its P cores. If it did, even if you wanted it to, the distinction between foreground and background, P and E cores would start to fall apart, our apps would suffer as a consequence, and battery endurance would decline. Gone are the days of crashing mdworker processes bringing our Macs to their knees with a spinning beachball every few seconds.

If seeing all those processes using high % CPU can look scary, the inevitable consequence in terms of software architecture might seem terrifying. Rather than building monolithic apps, many of their tasks are now broken out into discrete processes run in the background on demand, on the E cores when appropriate. The fact that an idle Mac has over 2,000 threads running in over 600 processes is good news, and the more of those that are run on the E cores, the faster our apps will be. The first and last M-series chips to have only two E cores were the M1 Pro and Max, since when every one has had at least four E cores, and some as many as six or eight.

Because Efficiency cores get the background threads off the cores we need for performance.

* For the record, I have measured those frequencies using powermetrics. For an M4 Pro, for example, high QoS threads running on the P cores benefit from frequencies close to the P core max of 4,512 MHz. Low QoS threads running on the E cores are run at frequencies close to idle, typically around 1,050 MHz. However, when the E cores run high QoS threads that have overflowed from the P cores, the E cores are normally run at around their maximum of 2,592 MHz. By my arithmetic, 1,050 divided by 4,512 is 0.233, which is slightly less than a quarter. Other M-series chips are similar.

How could logging out help?

When something’s not working right, one of the most common and effective solutions is to restart your Mac. What happens next is the Mac shuts down and immediately restarts, going through the full boot process. That’s not quite the same as shutting down, leaving your Mac a minute or so, then starting up, what’s sometimes referred to as a cold boot. But neither of those may be necessary, as it may be just as effective to log out and log back in again.

Whether logging out might help is determined by the processes it would restart, something you can see in Activity Monitor. In its View menu select the My Processes command, switch to the CPU view and order those by % CPU. Those are being run on your behalf, with you as the user, they should be closed when you log out and started up again when you log back in. Change the View to All Processes, then order the list by User, and you’ll see that the majority of processes running are yours. If you need to restart processes running as root, or the likes of _windowserver, then only a restart will help.

This can sometimes fix problems with WindowServer, even though it isn’t normally shut down when you log out, neither is the troublemaker cfprefsd. Contrary to what you might expect, some user processes continue running uninterrupted even after you’ve logged out. However, in the recent past macOS itself has used user logout as a way to restart WindowServer without rebooting. In more recent versions of macOS, particularly on Apple silicon Macs, the only reliable way to fix WindowServer problems is by restarting the whole of macOS.

cfprefsd is a particular nuisance here, as there are normally both root and user copies running to handle all those preferences. You wouldn’t expect the root copy to be affected by logging out, but at least the user copy could have the decency to do so. This means that, if you’re trying to slip a manual change to a preference file past cfprefsd, a full restart is likely to be required.

Another useful clue as to what’s likely to be restarted by logging out and back in again is given in their Process ID. With Activity Monitor still showing All Processes, order them by PID.

At the top with PID 0 you’ll see kernel_task, followed by launchd with a PID of 1. Next you’re likely to see the logd service responsible for writing and maintaining the Unified log. On Intel Macs that’s likely to have a PID of around 96, while it’s higher on Apple silicon Macs at around 368. That’s because of the many hardware-related processes that are run during startup to initialise all the features built into the chip.

As these PIDs are assigned in simple numerical order, they reveal the sequence of process startup. Find WindowServer in the list, and it’ll generally have a PID of around 442 (166 on Intel). Not too far below it you should see the first user process, loginwindow, at about 445 (205 on Intel); that’s also the first process to be given its own icon at the start of the line. Processes with lower PIDs were all started before login, and those with higher PIDs, including some running as root, were started afterwards.

Many of those user processes, and many with PIDs greater than loginwindow, should be shut down when you log out, then be started up again as needed, when you log back in again. But if you try that and check PIDs again, and glance at the CPU Time column, it’s apparent that many user and other late-loading processes retain low PIDs and long CPU times. To refresh those a restart will be needed.

Normally, logging out and back in should only take a few seconds to complete. Because your Mac isn’t starting up from scratch, its Bluetooth remains working throughout, so there’s no frustrating delay before you can type your password in. With a bit of luck your Mac should then be back in fine fettle again, ready for you to resume work with the minimum of disruption.

What this doesn’t do, of course, is flush the caches and clean up any accumulated crud in your user account. For that, starting up in Safe mode remains the only solution. That’s a little less convenient on Apple silicon, where you have to shut down and start up in Recovery with the Power button held. Then select the startup disk you want your Mac to boot from, and hold the Shift key. The button underneath that disk icon then changes to read Continue in Safe Mode. Click on that and your Mac will restart into Safe mode. Although hardly onerous, if logging out and back in again does fix the problem, it will save you significant time.

❌