
 Login
LoginCPU core frequencies updated for all current Apple silicon Macs
Thanks to your generous response to my appeal for information about CPU core frequencies in the MacBook Neo, M5 Pro and Max chips, this article updates the data to cover those new models, in addition to all previous M-series chips.
Super (S), Performance (P) and Efficiency (E) CPU cores in Apple silicon Macs are run at a range of different frequencies so they can deliver optimum performance with a minimum power and energy use. Cores are grouped into clusters of 2-6, and macOS sets the frequency of each cluster according to workload, Quality of Service, power mode and thermal status. Maximum frequencies differ according to the family, variant within that family, and between E, P and S cores. Current values are:
- M1 E 2064 MHz or 2.1 GHz; P 3228 MHz or 3.2 GHz;
- M2 E 2424 MHz or 2.4 GHz; P 3696 MHz or 3.7 GHz;
- M3 E 2748 MHz or 2.7 GHz; P 4056 MHz or 4.1 GHz;
- M4 E 2892 MHz or 2.9 GHz; P 4512 MHz or 4.5 GHz;
- M5 E 3048 MHz or 3.0 GHz; P 4380 MHz or 4.4 GHz; S 4608 MHz or 4.6 GHz;
- A18 Pro E 2424 MHz or 2.4 GHz; P 4044 MHz or 4.0 GHz.
The full table of frequencies reported by powermetrics is:
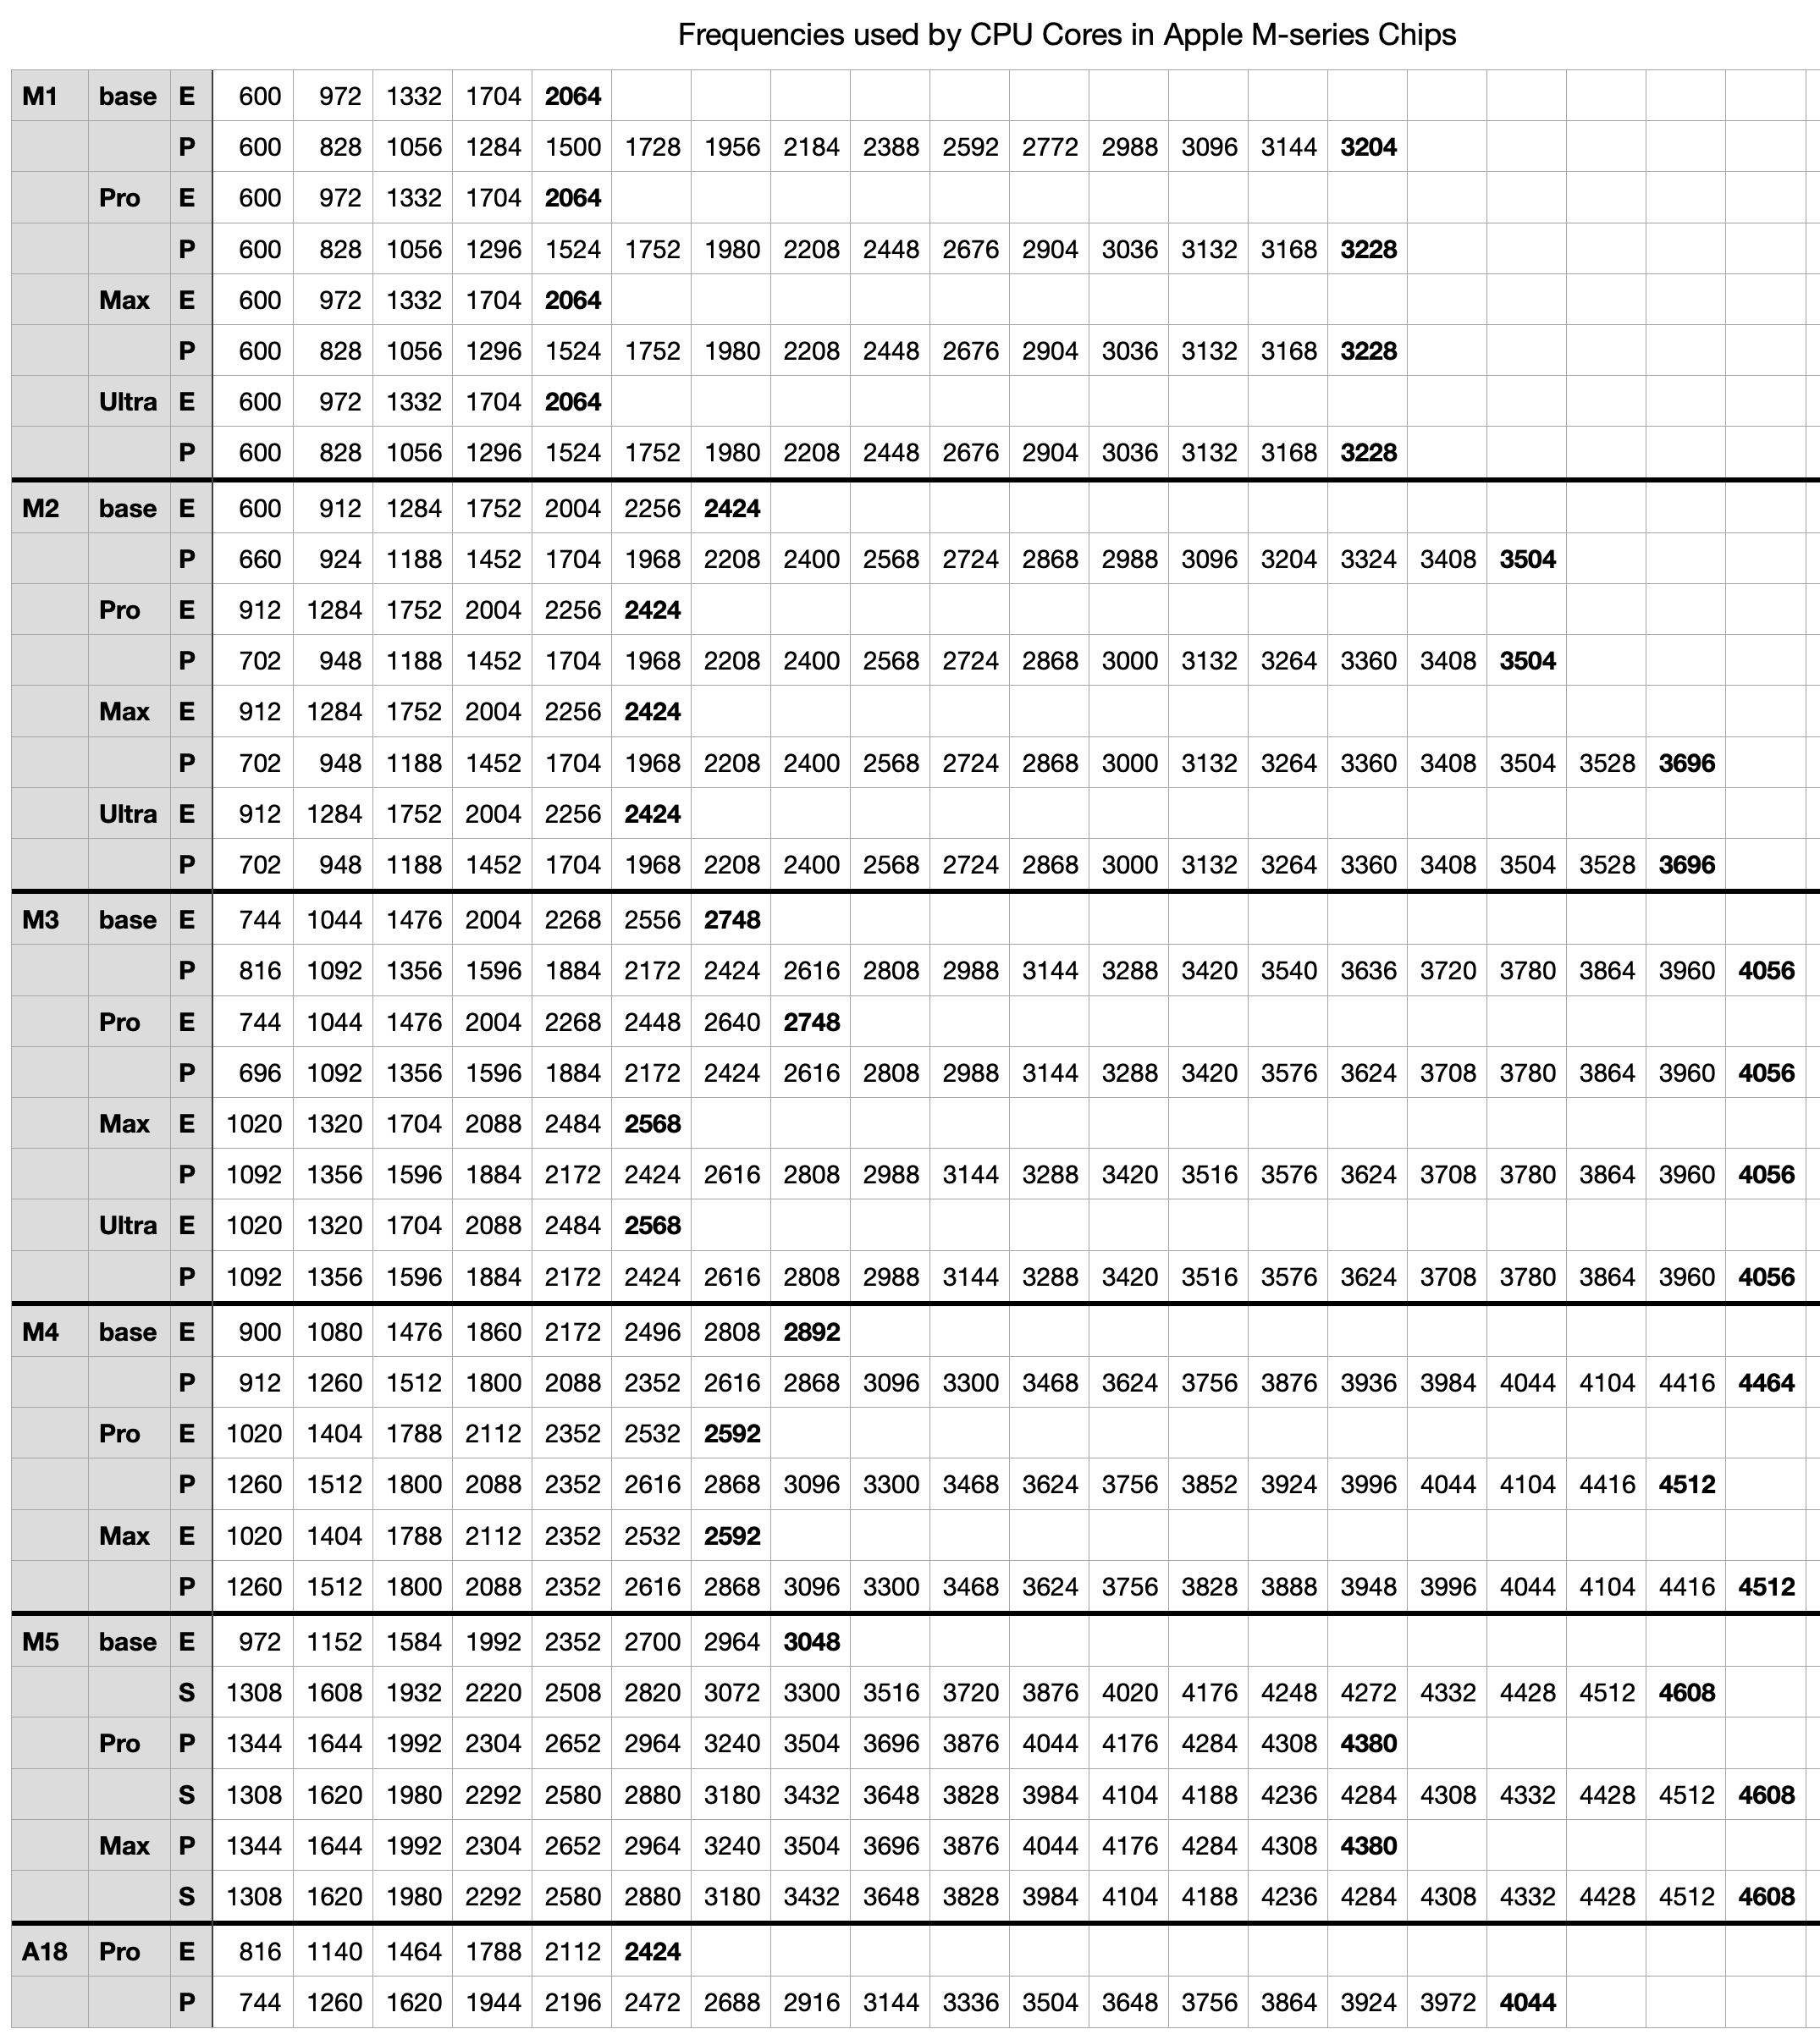
This is available for download as a Numbers spreadsheet and in CSV format here: mxfrequencies2
I have previously published a detailed analysis of frequencies in the M1 to M4 families, and a second last year adding those for the first of the M5 family. Since then, Apple has added M5 Pro and Max chips, reclassified the cores in M5 chips into three types, and released the MacBook Neo based on the A18 Pro.
Frequency range
Over the last five years and five families of chips, their frequencies have increased steadily, as shown in the charts below. Each bar in those charts spans the range of frequencies from minimum (idle) to maximum, for the base variant in that family.

Idle frequency in E cores has risen from 600 MHz to 972 MHz, a rise of over 60%, and their maximum frequency has risen from 2,064 MHz to 3,048 MHz, a rise of nearly 50%.

P and S cores have seen more substantial change. Their idle frequency has risen from 600 MHz to 1,308 MHz, a much larger rise of nearly 120%, and their maximum frequency has risen from 3,204 MHz to 4,608 MHz, just under 50%. The S core in M5 chips is notable for its greater rise in idle frequency, and smaller increase in maximum frequency.
Frequency steps
Rather than macOS set an arbitrary frequency, it appears to select from a list of steps that are distinctive to that family and variant. Looking at the table of frequency steps it might be easy to assume those numbers are chosen arbitrarily, but expressing them appropriately suggests they’re the result of sophisticated modelling.
To look at frequency steps and the frequencies chosen for them, I have again converted raw frequencies to make them comparable. First, I work out the steps as evenly spaced points along a line from 0.0, representing idle, to 1.0, representing the core’s maximum frequency. For each of those evenly spaced steps, I calculate a normalised frequency, as
(Fmax – Fstep)/(Fmax – Fidle)
where Fidle is the idle (lowest) frequency value, Fmax is the highest, and Fstep is the actual frequency set for that step.
For example, say a core has an idle frequency of 500 MHz, a maximum of 1,500 MHz, and only one step between those. Its steps will be 0.0, 0.5 and 1.0, and if the relationship is linear, then the frequency set by that intermediate step will be 1,000 MHz. If it’s greater than that, the relationship will be non-linear, tending to a higher frequency for that step. The following charts compare those normalised frequencies with steps evenly spaced between that core’s idle and maximum frequencies.

This chart shows normalised frequencies and steps for E cores in base M1 and M5 chips, the latter in red. It shows how, over those five years, the number of steps (available frequencies) has increased. In the M1, the frequency selected in the middle of its five steps was half-way between idle and maximum. Not only does the M5 have more intermediate frequencies available, six instead of three, but frequencies used in the upper half of its steps are higher those in the M1, when normalised.
This tends to boost higher frequencies used for running threads that can’t be accommodated on P cores, while running background threads at slightly lower frequencies than would be expected when at frequencies close to idle, as they are.

These curves have undergone evolution across different families, as shown here in a composite of the curves for all five families. The red curve of the M5 deviates more from the M1’s straight line of identity than any of the others, particularly at the top end.
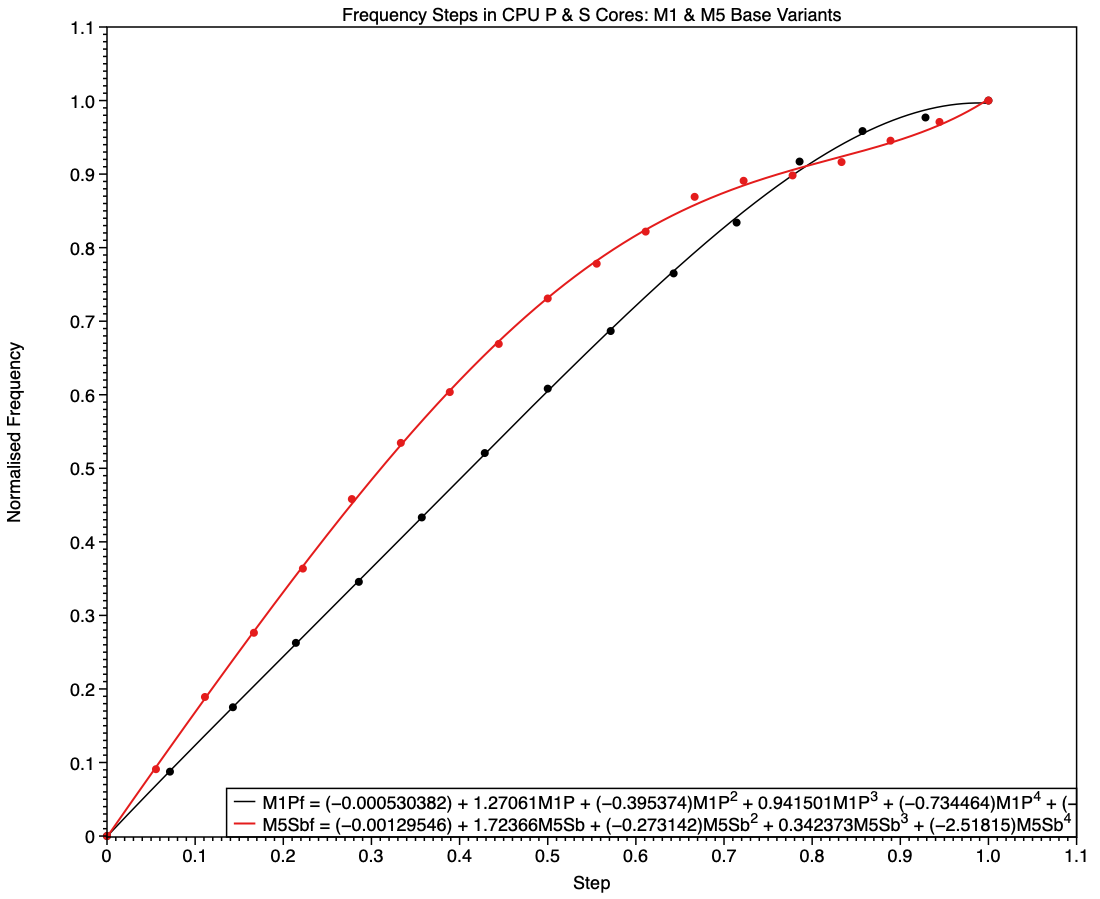
The equivalent comparison between frequencies of P cores in M1 and S cores in M5 chips (base models) shows a different picture. The M1 is again the simpler, being linear until it reaches a step of 0.8, while the M5 has higher frequencies in all except the top few values.
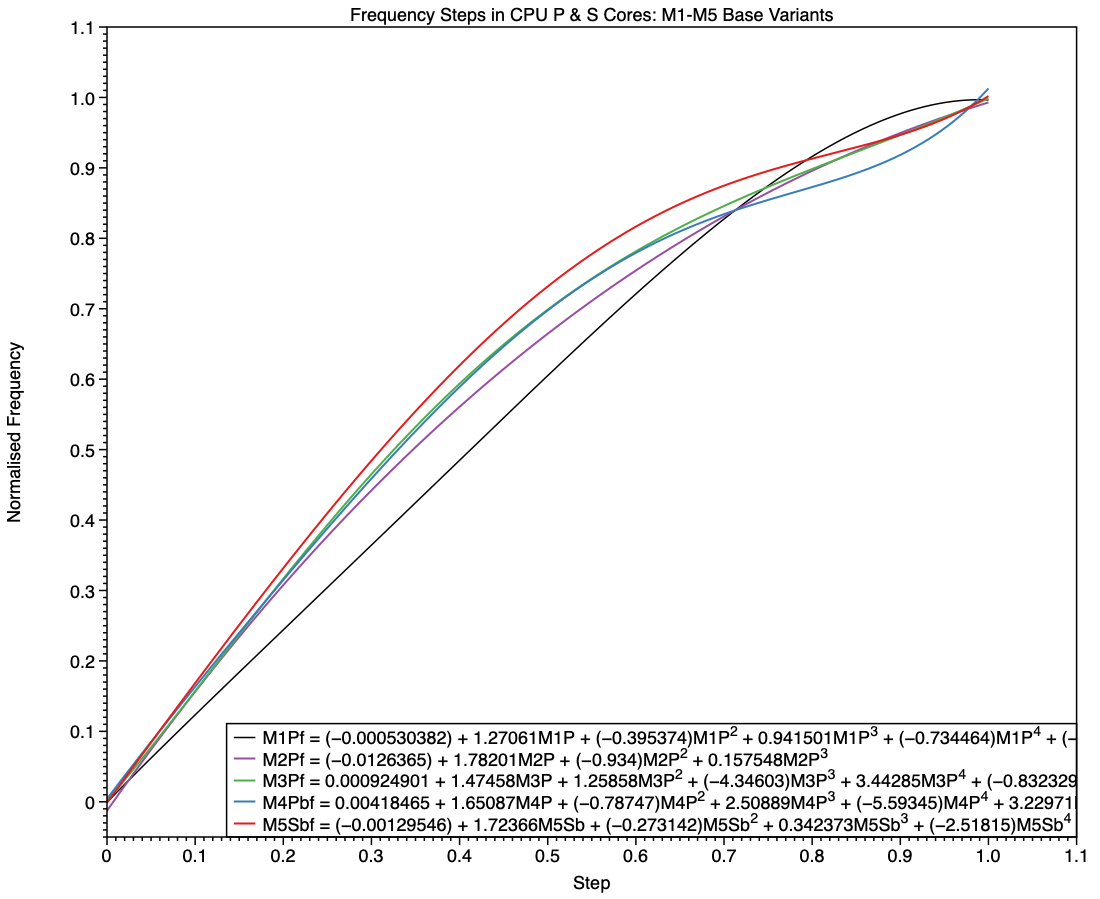
Shown here alongside curves for all earlier families, the red curve for the S cores in the base M5 has higher frequencies for every step apart from the last few.
Changes in M5 chips
The M5 family brings a major departure from all previous M-series chips, with the introduction of the S type, and replacement of E cores in its Pro and Max variants with P cores. Although the E cores still included in M5 base chips follow on from their predecessors, it’s harder to see where the P and S cores fit in. My first comparison is between P cores in the M4 Max, and the P and S cores in the M5 Max.
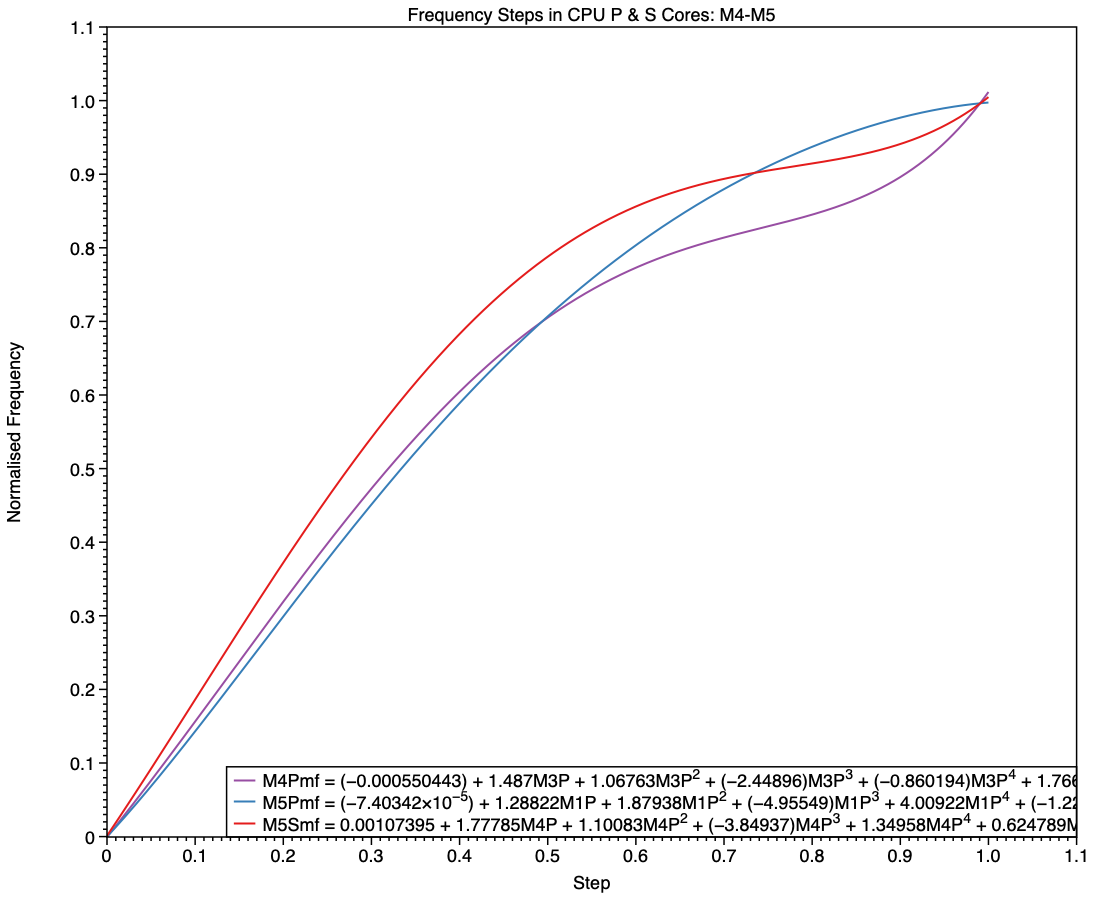
The simpler curve of frequencies for the M5 P core, shown here in blue, is more similar to those seen in E cores than it is to the M4 P (purple) and M5 S (red). While the M5 P core may deliver performance closer to that of the M4 P core, this suggests that its frequency management is intended to conform more closely to that of an E core.
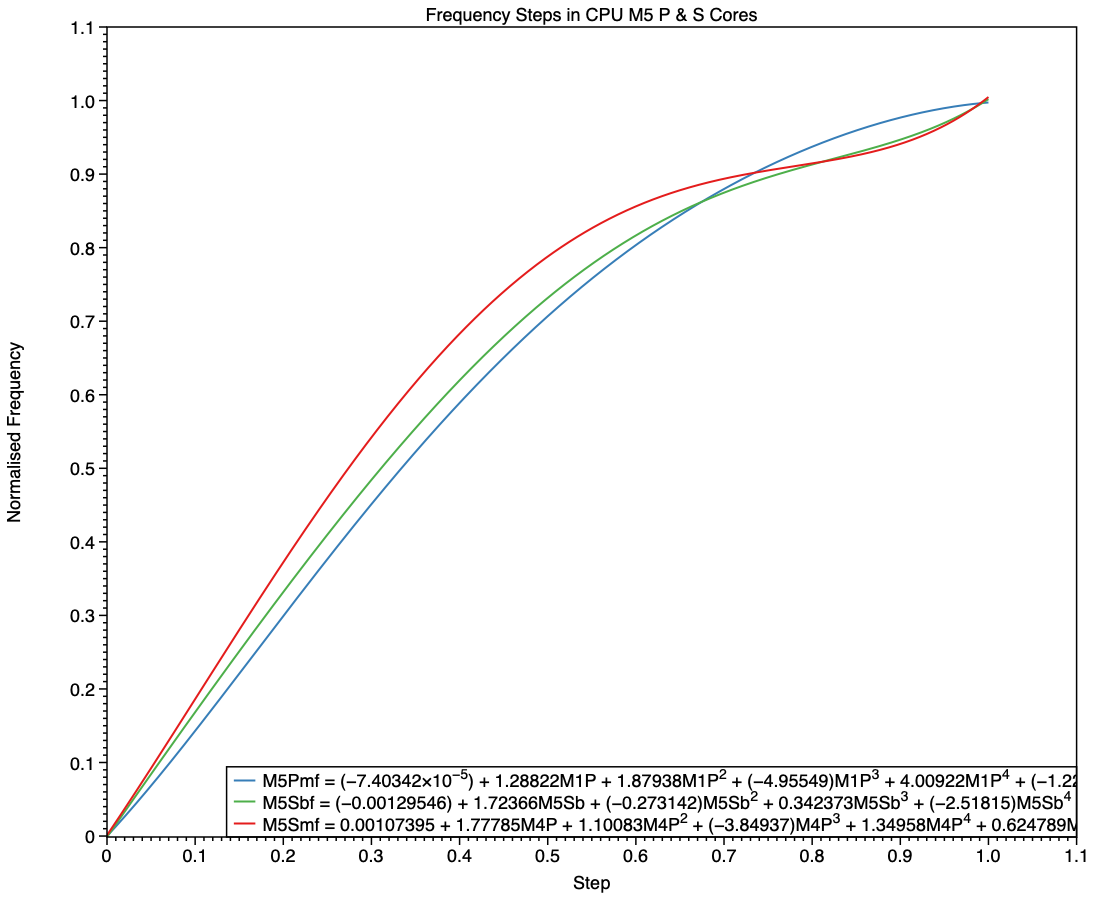
This final chart compares the P cores in an M5 Max with the S cores in the base M5 and its Max variant. This confirms the E-style frequency steps in the P core (blue), and the differences between the S cores in the base variant (green) and those in the Max (red). At all frequency steps, the S cores in a Max chip are run at the same or higher frequencies than those in a base variant.
MacBook Neo
In terms of frequencies, the A18 Pro used in the MacBook Neo has E cores with similar frequencies to those of an M2, while those of its P cores resemble P cores in an M3.
Conclusions
- Frequency steps for the M5 P core follow the pattern of E cores rather than earlier P cores, but with more intermediate frequencies.
- Frequency steps for S cores in base and Pro/Max variants of the M5 differ, although both resemble those of earlier P cores.
Key assumptions
- The frequencies reported by
powermetricsare accurate. - Control of frequencies uses discrete steps, rather than continuous values.
- Frequency steps seldom if ever change.
Corrections
I welcome corrections to the table of frequencies. To check them, use the following command in Terminalsudo powermetrics -n 1 -s cpu_power
which then prompts you for your admin password. A few seconds later the window fills with a single set of measurements in which the frequency steps will be shown for different core types.


