In my review of macOS virtualisation on Apple silicon, I quoted performance figures that were obtained some time ago, and didn’t consider minimum specifications for a usable VM. Given current interest in running a VM on a MacBook Neo, I thought it would be worth examining these afresh, from macOS Tahoe.
How fast?
Using the same host, a Mac mini M4 Pro, this time running macOS 26.4.1 on its 14 cores (10 P + 4 E) with 48 GB RAM and a 2 TB internal SSD, Geekbench 6.7.1 scores are slightly faster, on both the host and a guest given 5 virtual cores and 16 GB of virtual RAM:
The last of those gives single precision, half-precision and quantised test results, in that order.
Comparing CPU single-core figures, the VM runs effectively at 98% of the speed of the host. Comparison between the multi-core CPU results is difficult, as the host has more than twice the number of cores, although four of them are E cores. However, given that the host has twice the number of P cores alone, the VM appears to perform rather better than the host on this test.
GPU performance isn’t quite as good, with the VM delivering performance of 95% of that of the host, when the latter isn’t contending for the GPU as well.
The only real disappointment here is the virtual neural engine, which performs far slower than the host on half-precision and quantised tests. We might hope that macOS would process AI tasks using the CPU and GPU rather than the neural engine, when running in a VM.
How small?
With the arrival of the MacBook Neo, some wondered whether it would be able to run VMs. While there’s no doubt it should make a good host for Linux, I doubted whether it would be able to do anything useful with macOS in a VM. I was wrong.
To assess how small a macOS VM could be, I ran the same VM of macOS 26.4.1 on progressively smaller CPU core and memory allocations, using my virtualiser Viable. The VM’s display window was set to a standard 1600 x 1000, and I ran Safari through its paces and performed some lightweight everyday tasks, including Storage analysis in Settings.
Starting with 4 virtual cores and 8 GB vRAM, where the VM ran perfectly briskly with around 5 GB of memory used, I stepped down to 3 cores and 6 GB, to discover that memory usage fell to 3.9 GB and everything worked well. With just 2 cores and 4 GB of memory only 3.1 GB of that was used, and the VM continued to handle those lightweight tasks normally.
The only thing to be careful of when creating VMs on Macs with small internal SSDs is their size. Any macOS VM significantly smaller than 50 GB isn’t going to be able to update its macOS, and for comfort and safety you should aim for at least 60 GB. Fortunately, APFS comes to your aid here, as VMs are stored as sparse files, and a basic 100 GB VM should only require about 54 GB on disk. That would be better accommodated on the MacBook Neo with a 512 GB SSD.
Although not the place to try running your LLM, a macOS VM given only 2 virtual cores and 4 GB of memory, as should be feasible in a MacBook Neo, is thoroughly usable and capable of everyday tasks. Bring on the Neos!
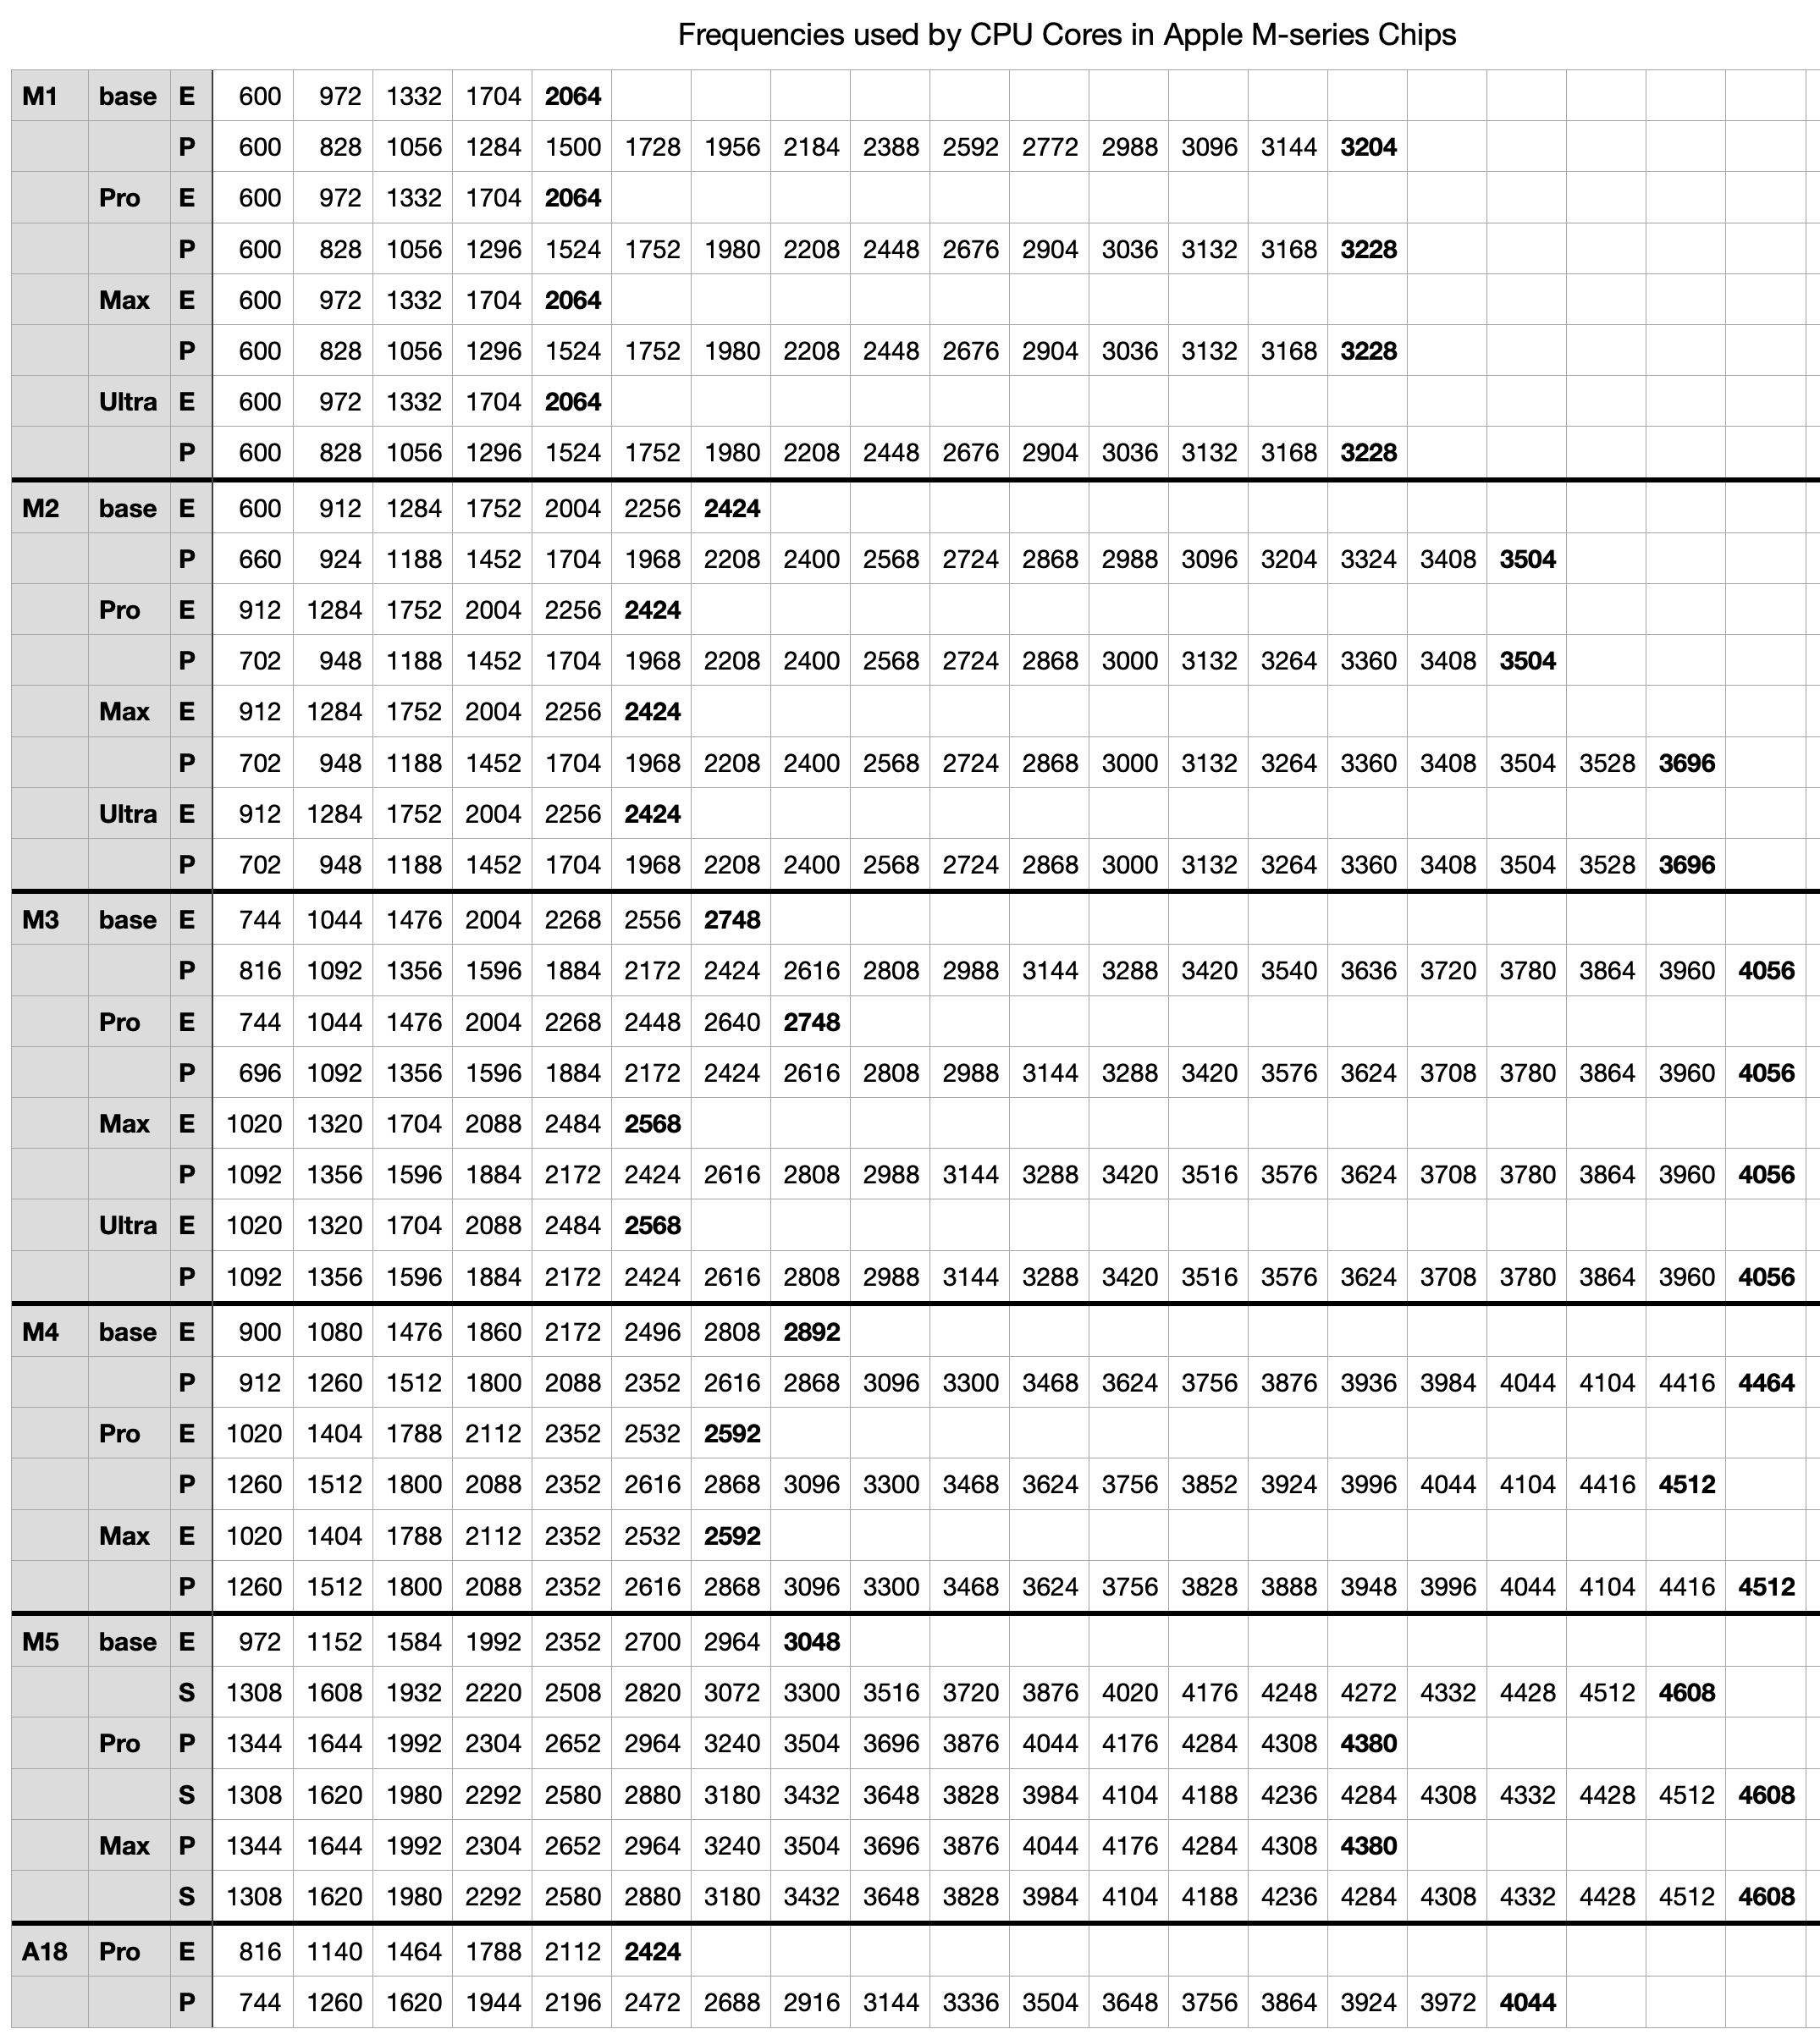
Thanks to your generous response to my appeal for information about CPU core frequencies in the MacBook Neo, M5 Pro and Max chips, this article updates the data to cover those new models, in addition to all previous M-series chips.
Super (S), Performance (P) and Efficiency (E) CPU cores in Apple silicon Macs are run at a range of different frequencies so they can deliver optimum performance with a minimum power and energy use. Cores are grouped into clusters of 2-6, and macOS sets the frequency of each cluster according to workload, Quality of Service, power mode and thermal status. Maximum frequencies differ according to the family, variant within that family, and between E, P and S cores. Current values are:
M1 E 2064 MHz or 2.1 GHz; P 3228 MHz or 3.2 GHz;
M2 E 2424 MHz or 2.4 GHz; P 3696 MHz or 3.7 GHz;
M3 E 2748 MHz or 2.7 GHz; P 4056 MHz or 4.1 GHz;
M4 E 2892 MHz or 2.9 GHz; P 4512 MHz or 4.5 GHz;
M5 E 3048 MHz or 3.0 GHz; P 4380 MHz or 4.4 GHz; S 4608 MHz or 4.6 GHz;
A18 Pro E 2424 MHz or 2.4 GHz; P 4044 MHz or 4.0 GHz.
The full table of frequencies reported by powermetrics is:
This is available for download as a Numbers spreadsheet and in CSV format here: mxfrequencies2
I have previously published a detailed analysis of frequencies in the M1 to M4 families, and a second last year adding those for the first of the M5 family. Since then, Apple has added M5 Pro and Max chips, reclassified the cores in M5 chips into three types, and released the MacBook Neo based on the A18 Pro.
Frequency range
Over the last five years and five families of chips, their frequencies have increased steadily, as shown in the charts below. Each bar in those charts spans the range of frequencies from minimum (idle) to maximum, for the base variant in that family.
Idle frequency in E cores has risen from 600 MHz to 972 MHz, a rise of over 60%, and their maximum frequency has risen from 2,064 MHz to 3,048 MHz, a rise of nearly 50%.
P and S cores have seen more substantial change. Their idle frequency has risen from 600 MHz to 1,308 MHz, a much larger rise of nearly 120%, and their maximum frequency has risen from 3,204 MHz to 4,608 MHz, just under 50%. The S core in M5 chips is notable for its greater rise in idle frequency, and smaller increase in maximum frequency.
Frequency steps
Rather than macOS set an arbitrary frequency, it appears to select from a list of steps that are distinctive to that family and variant. Looking at the table of frequency steps it might be easy to assume those numbers are chosen arbitrarily, but expressing them appropriately suggests they’re the result of sophisticated modelling.
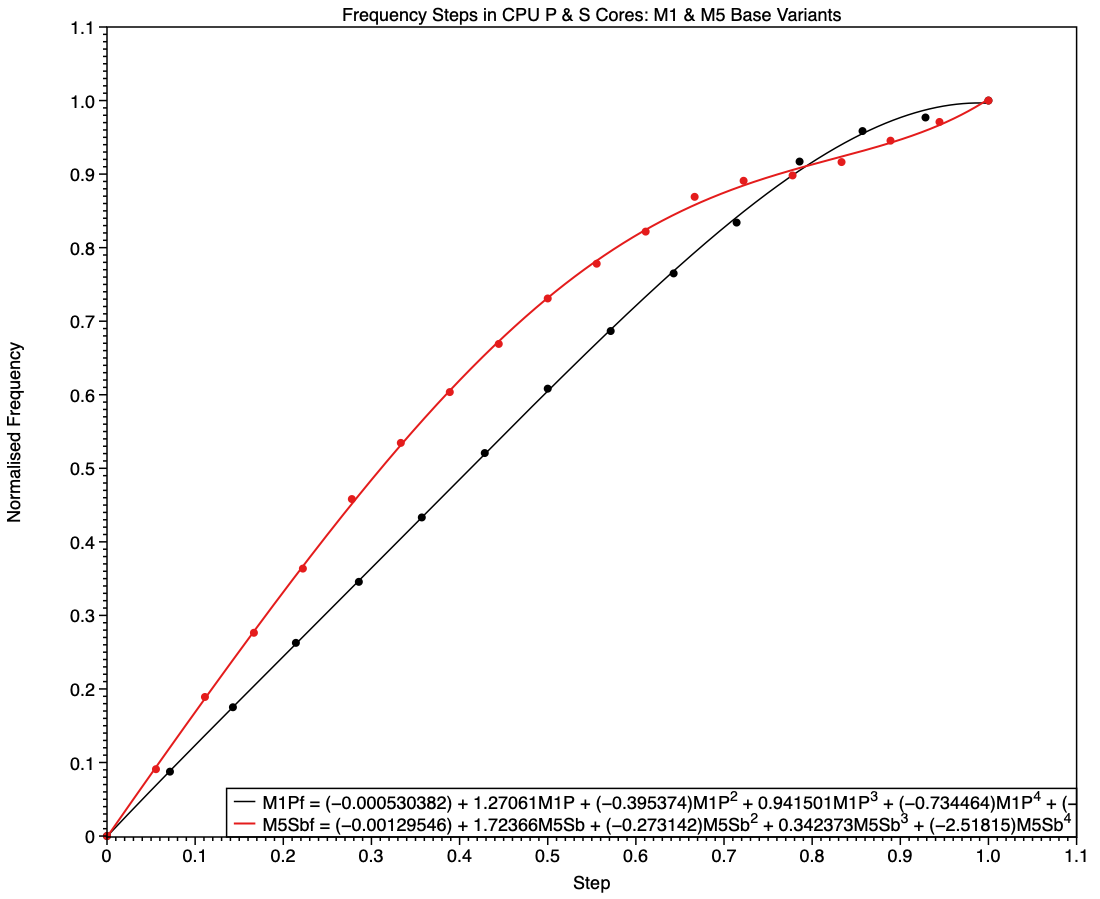
To look at frequency steps and the frequencies chosen for them, I have again converted raw frequencies to make them comparable. First, I work out the steps as evenly spaced points along a line from 0.0, representing idle, to 1.0, representing the core’s maximum frequency. For each of those evenly spaced steps, I calculate a normalised frequency, as (Fmax – Fstep)/(Fmax – Fidle)
where Fidle is the idle (lowest) frequency value, Fmax is the highest, and Fstep is the actual frequency set for that step.
For example, say a core has an idle frequency of 500 MHz, a maximum of 1,500 MHz, and only one step between those. Its steps will be 0.0, 0.5 and 1.0, and if the relationship is linear, then the frequency set by that intermediate step will be 1,000 MHz. If it’s greater than that, the relationship will be non-linear, tending to a higher frequency for that step. The following charts compare those normalised frequencies with steps evenly spaced between that core’s idle and maximum frequencies.
This chart shows normalised frequencies and steps for E cores in base M1 and M5 chips, the latter in red. It shows how, over those five years, the number of steps (available frequencies) has increased. In the M1, the frequency selected in the middle of its five steps was half-way between idle and maximum. Not only does the M5 have more intermediate frequencies available, six instead of three, but frequencies used in the upper half of its steps are higher those in the M1, when normalised.
This tends to boost higher frequencies used for running threads that can’t be accommodated on P cores, while running background threads at slightly lower frequencies than would be expected when at frequencies close to idle, as they are.
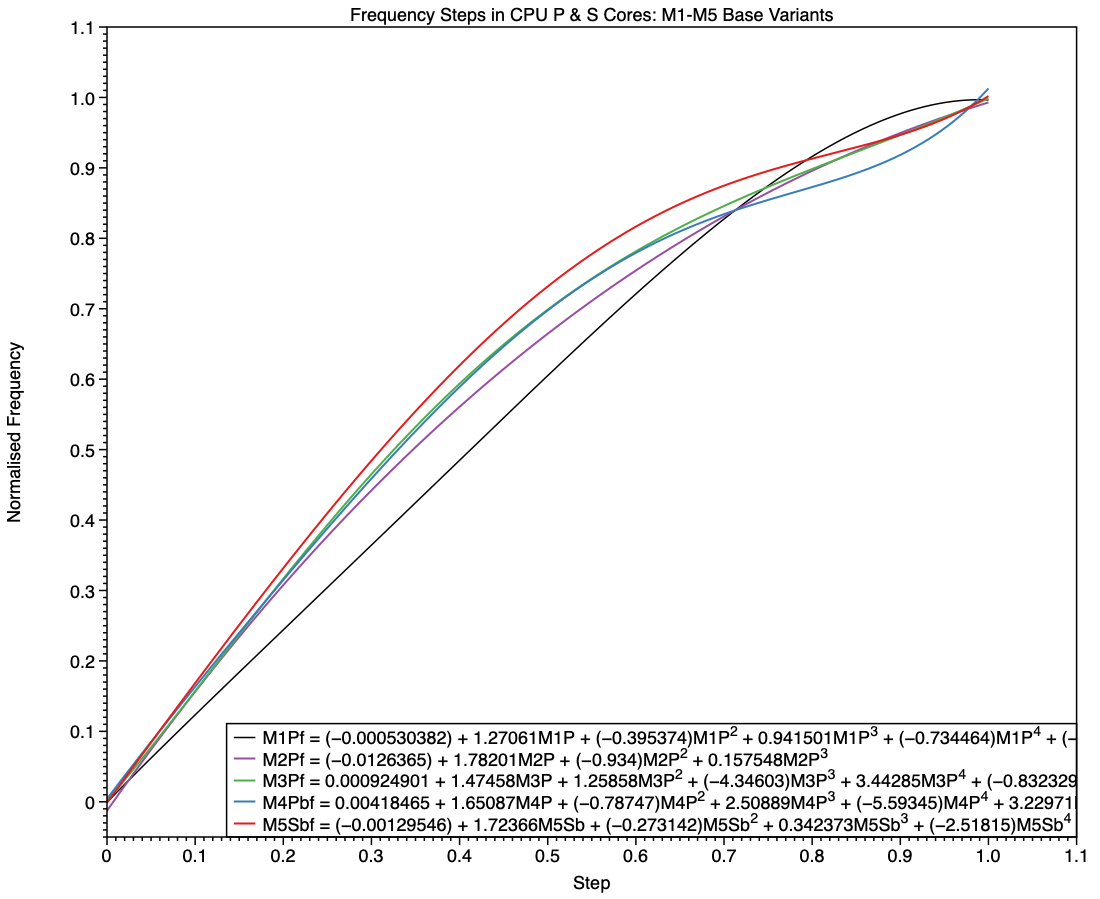
These curves have undergone evolution across different families, as shown here in a composite of the curves for all five families. The red curve of the M5 deviates more from the M1’s straight line of identity than any of the others, particularly at the top end.
The equivalent comparison between frequencies of P cores in M1 and S cores in M5 chips (base models) shows a different picture. The M1 is again the simpler, being linear until it reaches a step of 0.8, while the M5 has higher frequencies in all except the top few values.
Shown here alongside curves for all earlier families, the red curve for the S cores in the base M5 has higher frequencies for every step apart from the last few.
Changes in M5 chips
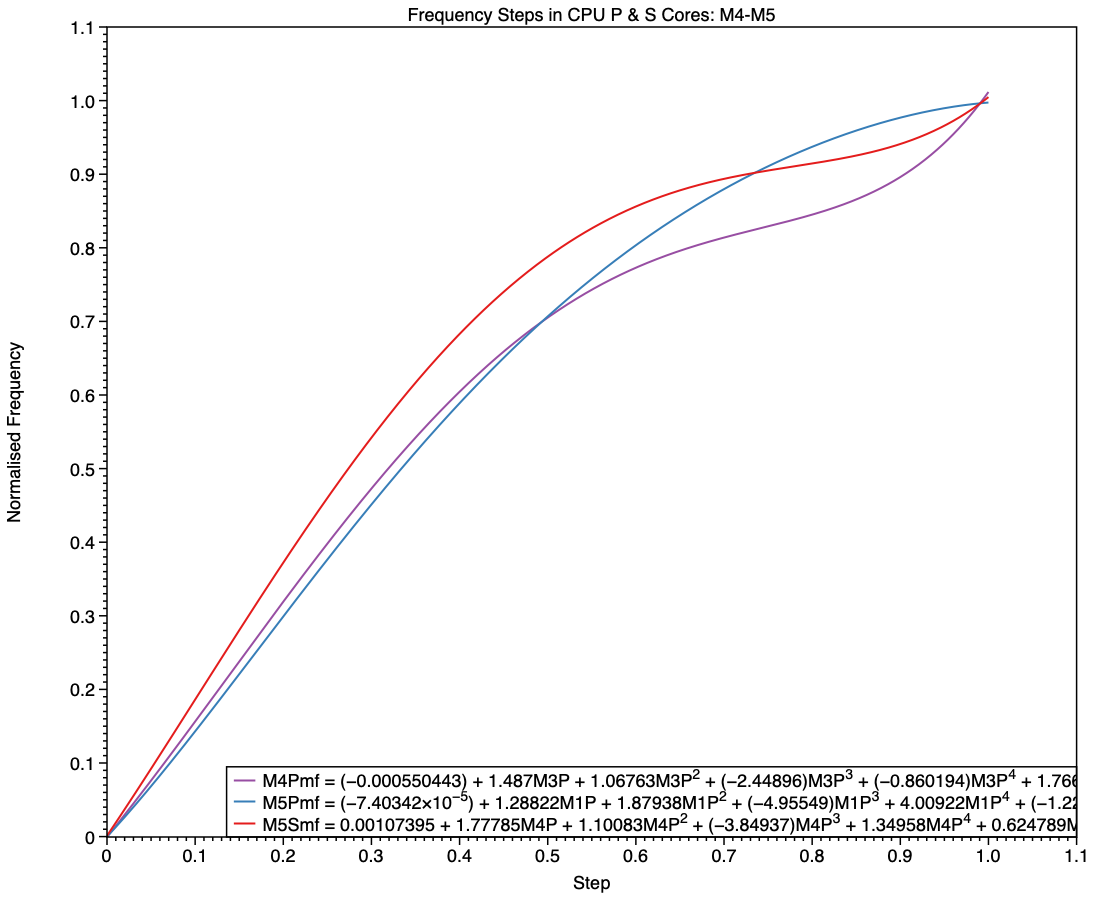
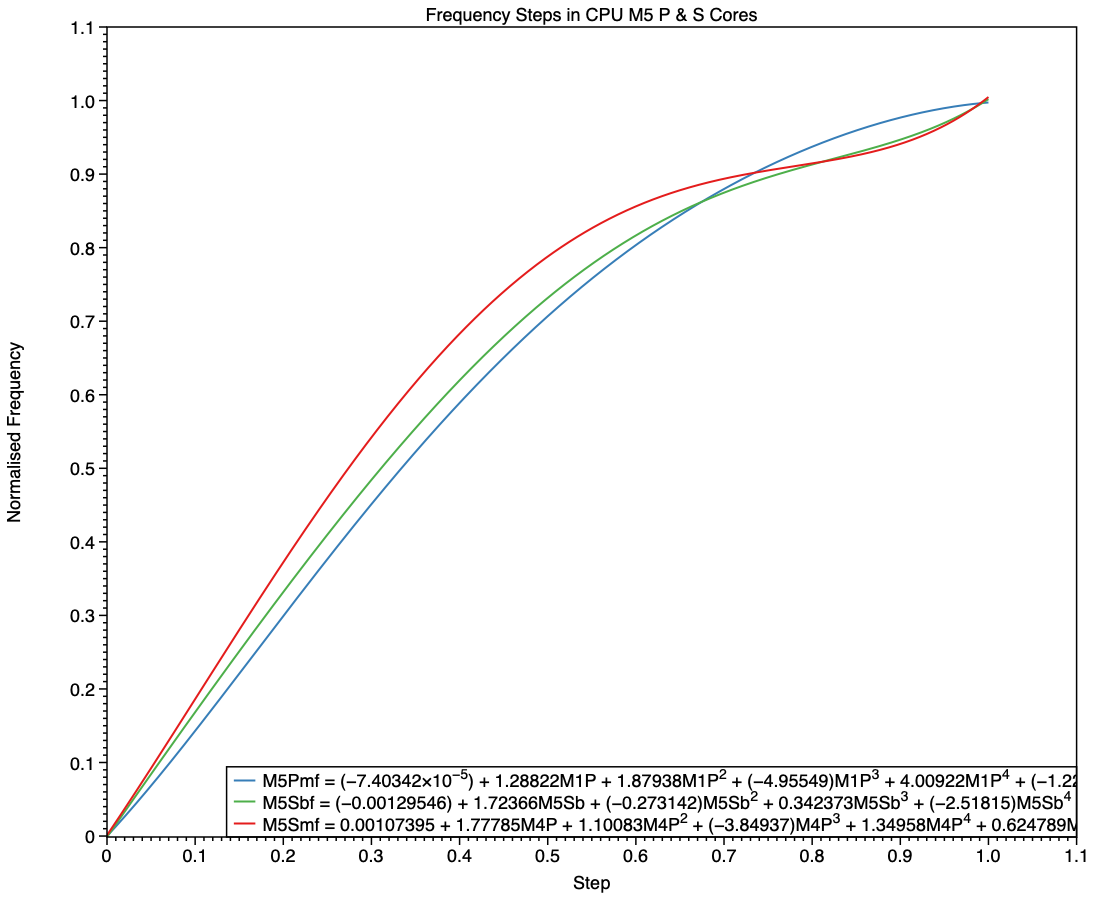
The M5 family brings a major departure from all previous M-series chips, with the introduction of the S type, and replacement of E cores in its Pro and Max variants with P cores. Although the E cores still included in M5 base chips follow on from their predecessors, it’s harder to see where the P and S cores fit in. My first comparison is between P cores in the M4 Max, and the P and S cores in the M5 Max.
The simpler curve of frequencies for the M5 P core, shown here in blue, is more similar to those seen in E cores than it is to the M4 P (purple) and M5 S (red). While the M5 P core may deliver performance closer to that of the M4 P core, this suggests that its frequency management is intended to conform more closely to that of an E core.
This final chart compares the P cores in an M5 Max with the S cores in the base M5 and its Max variant. This confirms the E-style frequency steps in the P core (blue), and the differences between the S cores in the base variant (green) and those in the Max (red). At all frequency steps, the S cores in a Max chip are run at the same or higher frequencies than those in a base variant.
MacBook Neo
In terms of frequencies, the A18 Pro used in the MacBook Neo has E cores with similar frequencies to those of an M2, while those of its P cores resemble P cores in an M3.
Conclusions
Frequency steps for the M5 P core follow the pattern of E cores rather than earlier P cores, but with more intermediate frequencies.
Frequency steps for S cores in base and Pro/Max variants of the M5 differ, although both resemble those of earlier P cores.
Key assumptions
The frequencies reported by powermetrics are accurate.
Control of frequencies uses discrete steps, rather than continuous values.
Frequency steps seldom if ever change.
Corrections
I welcome corrections to the table of frequencies. To check them, use the following command in Terminal sudo powermetrics -n 1 -s cpu_power
which then prompts you for your admin password. A few seconds later the window fills with a single set of measurements in which the frequency steps will be shown for different core types.
Apple silicon chips are designed to minimise the power and energy they use without compromising their performance. One of many tricks they use is to run their CPU cores at variable frequencies, and in more recent models to shut down those cores they don’t need. Last year, thanks to the many who contributed information about their Macs, we were able to assemble a table of CPU core frequencies for all the M-series chips then available. Those demonstrated that frequencies differed between families such as M1 and M2, and between models within each family such as M2 Pro and Max, as well as between P and E cores.
Since then Apple has released two new chips, M5 Pro and Max, a new chip series in the MacBook Neo, and reclassified the CPU cores in M5 chips into three types, Super, Performance and Efficiency. Those have brought the greatest changes since the first M1 was released. This article briefly reviews what we know about CPU core frequencies, and appeals for information about those new models.
The best way to discover which frequencies are supported by the cores in the CPU of an Apple silicon chip is using the output of the command tool powermetrics. This lists frequencies for core types, and this article relies on those it gives being correct. Although it’s most likely that these frequencies aren’t baked into silicon, so could be changed, I’ve seen no evidence to suggest that Apple has done that in any released Mac.
Frequencies
If powermetrics is to be believed, the maximum frequencies of each of the CPU cores used in each generation differ from some of those you’ll see quoted elsewhere. Correct values should be:
M1 E 2064 MHz or 2.1 GHz; P 3228 MHz or 3.2 GHz;
M2 E 2424 MHz or 2.4 GHz; P 3696 MHz or 3.7 GHz;
M3 E 2748 MHz or 2.7 GHz; P 4056 MHz or 4.1 GHz;
M4 E 2892 MHz or 2.9 GHz; P 4512 MHz or 4.5 GHz.
M5 E 3048 MHz or 3.0 GHz; Super 4608 MHz or 4.6 GHz (base variant only).
This is available for download as a Numbers spreadsheet and in CSV format here: mxfreqs1025
Why those frequencies?
Depending on workload, thread Quality of Service, power mode, and thermal status, macOS sets the frequency for each cluster of CPU cores. Those used range between the minimum or idle, and the maximum, usually given as the core’s ‘clock speed’ and an indication of its potential maximum performance. In between those are as many as 17 intermediate frequencies giving cores great flexibility in performance, power and energy use. Core design and development uses sophisticated models to select idle and maximum frequencies, and evidently to determine those in between.
Looking at the table, it would be easy to assume those numbers are chosen arbitrarily, but when expressed appropriately there are patterns. Apple’s engineers have clearly put considerable effort into picking optimised frequencies for each of the families and variants within them. If you think this is fine detail and only the maximum frequencies count, then bear in mind that both P and E cores spend a lot of their time running at those intermediate frequencies.
How to report frequencies
If you have a MacBook Neo, or a MacBook Pro with an M5 Pro or Max chip, you can add to this collection, please open Terminal and run the command sudo powermetrics -n 1 -s cpu_power
which then prompts you for your admin password. A few seconds later the window will fill with a single set of measurements looking like this:
All I’d like is a copy containing 3 lines from that:
Machine model at the top, to tell me which Mac it is, thus which chip.
E-Cluster HW active residency, which contains a list of frequencies for the E cores in the Neo.
P-Cluster HW active residency, which contains a list of frequencies for the P cores.
Super-Cluster HW active residency, which contains a list of frequencies for the Super cores in the M5 Pro or Max.
To help, I have highlighted those three lines in the screenshot above, although what you see may well be different given Apple’s new Super core type.
Input and output have long been key factors in computer performance, and capable of bringing everything to a crawl unless carefully managed. This is most obvious when foreground and background processes contend for common resources such as disk storage. A popular solution has been to impose delays on I/O performed for intensive background tasks, like backing up, so giving more important tasks preferential access to I/O. This policy is known as I/O throttling, and has come to determine hardware choice.
For example, folk wisdom is that there’s little point in wasting a faster drive to store your Time Machine backups, because when those backups are made, their write speed is throttled by macOS.
I/O Throttling
Documentation of I/O policy is in the man page for the getiopolicy_np() call in the Standard C Library, last revised in 2019, and prevailing settings are in sysctl’s debug.lowpri_throttle_* values. Those draw a distinction between I/O to local disks, being “I/O sent to the media without going through a network”, such as I/O “to internal and external hard drives, optical media in internal and external drives, flash drives, floppy disks, ram disks, and mounted disk images which reside on these media”, and those to “remote volumes” “that require network activity to complete the operation”. The latter are “currently only supported for remote volumes mounted by SMB or AFP.”
Inclusion of remote volumes is a relatively recent change, as in the previous version of this man page from 2006, they were explicitly excluded as “remote volumes mounted through networks (AFP, SMB, NFS, etc) or disk images residing on remote volumes.”
Five policy levels are supported for IOPOL_TYPE_DISK:
IOPOL_IMPORTANT, the default, where I/O is critical to system responsiveness.
IOPOL_STANDARD, which may be delayed slightly to allow IOPOL_IMPORTANT to complete quickly, and presumably referred to in sysctl as Tier 1.
IOPOL_UTILITY, for brief background threads that may be throttled to prevent impact on higher policy levels, in Tier 2.
IOPOL_THROTTLE, for “long-running I/O intensive background work, such as backups, search indexing, or file synchronization”, that will be throttled to prevent impact on higher policy levels, in Tier 3.
IOPOL_PASSIVE, for mounting files from disk images, and the like, intended more for server situations so that lower policy levels aren’t slowed by them.
However, the idea that throttled I/O is intentionally slowed at all times isn’t supported by the explanation of how throttling works: “If a throttleable request occurs within a small time window of a request of higher priority, the thread that issued the throttleable I/O is forced to a sleep for a short period. This slows down the thread that issues the throttleable I/O so that higher-priority I/Os can complete with low-latency and receive a greater share of the disk bandwidth.”
Settings in sysctl for Tier 3 give the window duration as 500 milliseconds, and the sleep period as 200 ms, except for SSDs, whose sleep period is considerably shorter at just 25 ms. Those also set a maximum size for I/O at 131,072 bytes. You can view those settings in the debug section of Mints’ sysctl viewer.
Some years ago it was discovered that the user can globally disable IOPOL_THROTTLE and presumably all other IOPOL_TYPE_DISK policy with the command sudo sysctl debug.lowpri_throttle_enabled=0
although that doesn’t persist across restarts, and isn’t documented in the man page for sysctl. This is provided in an option in St. Clair Software’s App Tamer, to “Accelerate Time Machine backups”, for those who’d rather avoid the command line.
Apple silicon Macs
Since the man page for getiopolicy_np() was last revised, Apple silicon Macs have changed I/O. Most is now handled in some way through specialised Arm cores within the chip, and CPU cores come in two (now three) types, Efficiency and Performance (and Super in the M5 family). Background threads such as those performing the work associated with IOPOL_THROTTLE are now most likely to be running on Efficiency (or M5 Performance) CPU cores.
If you wanted to do away with all throttling, you not only have to change the debug.lowpri_throttle_enabled setting, but you’d need to move those background threads to run them on Performance (M5 Super) CPU cores, which isn’t possible unless you have control over the code. There is evidence that macOS may do this anyway when performing the first full Time Machine backup, which achieves significantly faster speeds than subsequent incremental backups.
Dangers
The big disadvantage of completely disabling I/O throttling policy is this can only be applied globally, so including I/O for Spotlight indexing, file synchronisation, and other background tasks, as well as those needing high-priority access to I/O. Leaving the policy disabled in normal circumstances could readily lead to adverse side-effects, allowing Spotlight indexing threads to swamp important user storage access, for example.
Conclusions
Even when Macs were simpler and all CPU cores were the same, disabling I/O throttling was at best experimental, and ran the risk of compromising higher priority I/O. In Apple silicon Macs, relocating threads from E to P cores isn’t possible, except when running them in a virtual machine. Without that, there seems little if any benefit from disabling I/O throttling. However, the claim that there’s no performance benefit to be obtained from faster backup storage media is demonstrably false. Perhaps it’s time to return I/O throttling to the obscurity it deserves.

 Login
Login