
Last Week on My Mac: Didn’t macOS have a GUI?
Each week brings news of more ClickFix atttacks. Last week’s, dubbed Mach-O Man by Mauro Eldritch and detailed on ANY.RUN’s blog, tricks targets into “fixing” a fake connection problem by pasting a malicious command into Terminal. I have previously argued that these attacks are preventable by changing user behaviour. Here I consider the role of macOS and its increasing reliance on the command line.
This was inspired by Apple’s recent warning to administrators of forthcoming changes in network security, where Apple instructs them to copy and paste a near-unintelligible command in what mimics a ClickFix attack. Although a brief explanation of that command is given, this is bad practice. The reason it’s deemed necessary is that the utility provided in macOS for the last ten years to access the log, Console, simply isn’t up to the task.
I took the lengthy predicate recommended in Apple’s article"p=appstoreagent|appstored|managedappdistributionagent|managedappdistributiond|ManagedClient|ManagedClientAgent|
mdmclient|mdmd|mdmuserd|MuseBuddyApp|NanoSettings|Preferences|profiled|profiles|RemoteManagementAgent|
remotemanagementd|Setup|'Setup Assistant'|'System Settings'|teslad|TVSettings|TVSetup|XPCAcmeService AND s=com.apple.network AND m:'ATS Violation'|'ATS FCPv2.1 violation'"
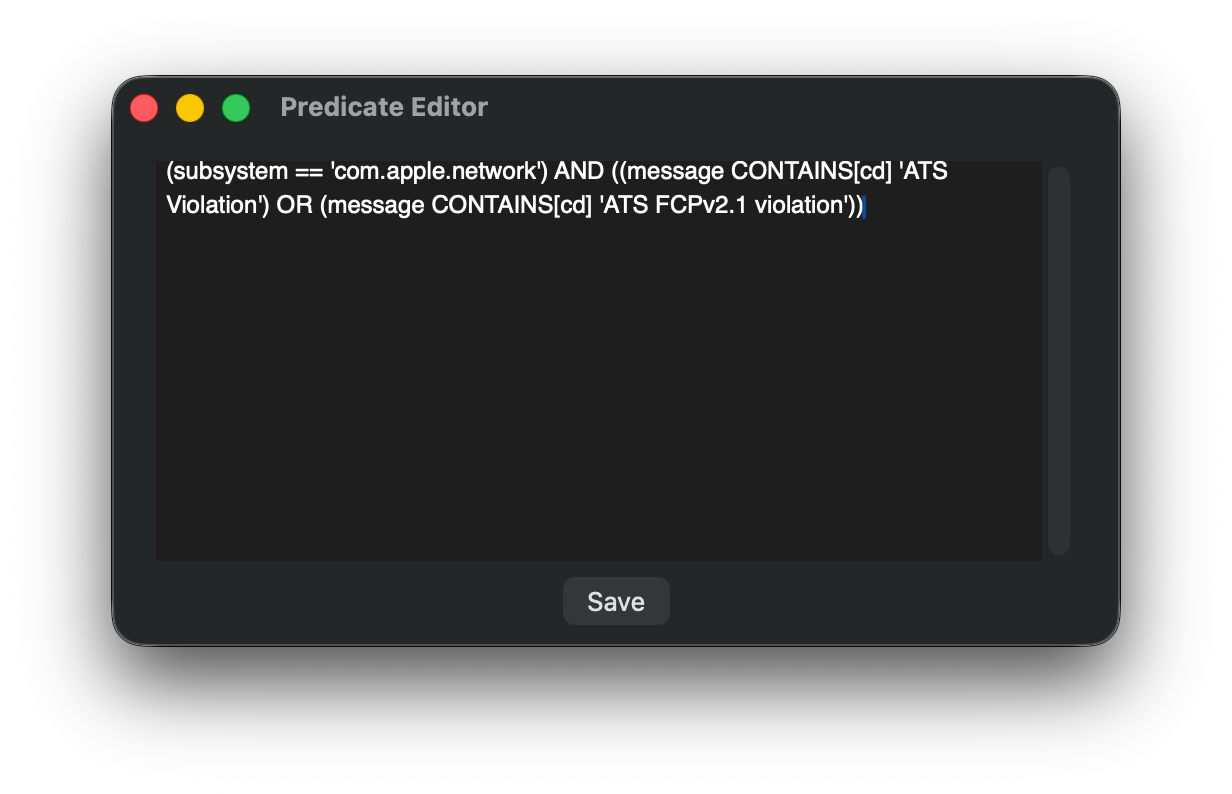
and broke it down into the far more understandable(subsystem = 'com.apple.network') AND ((message CONTAINS[cd] 'ATS Violation') OR (message CONTAINS[cd] 'ATS FCPv2.1 violation'))
and pasted that to use as a one-off predicate in LogUI.
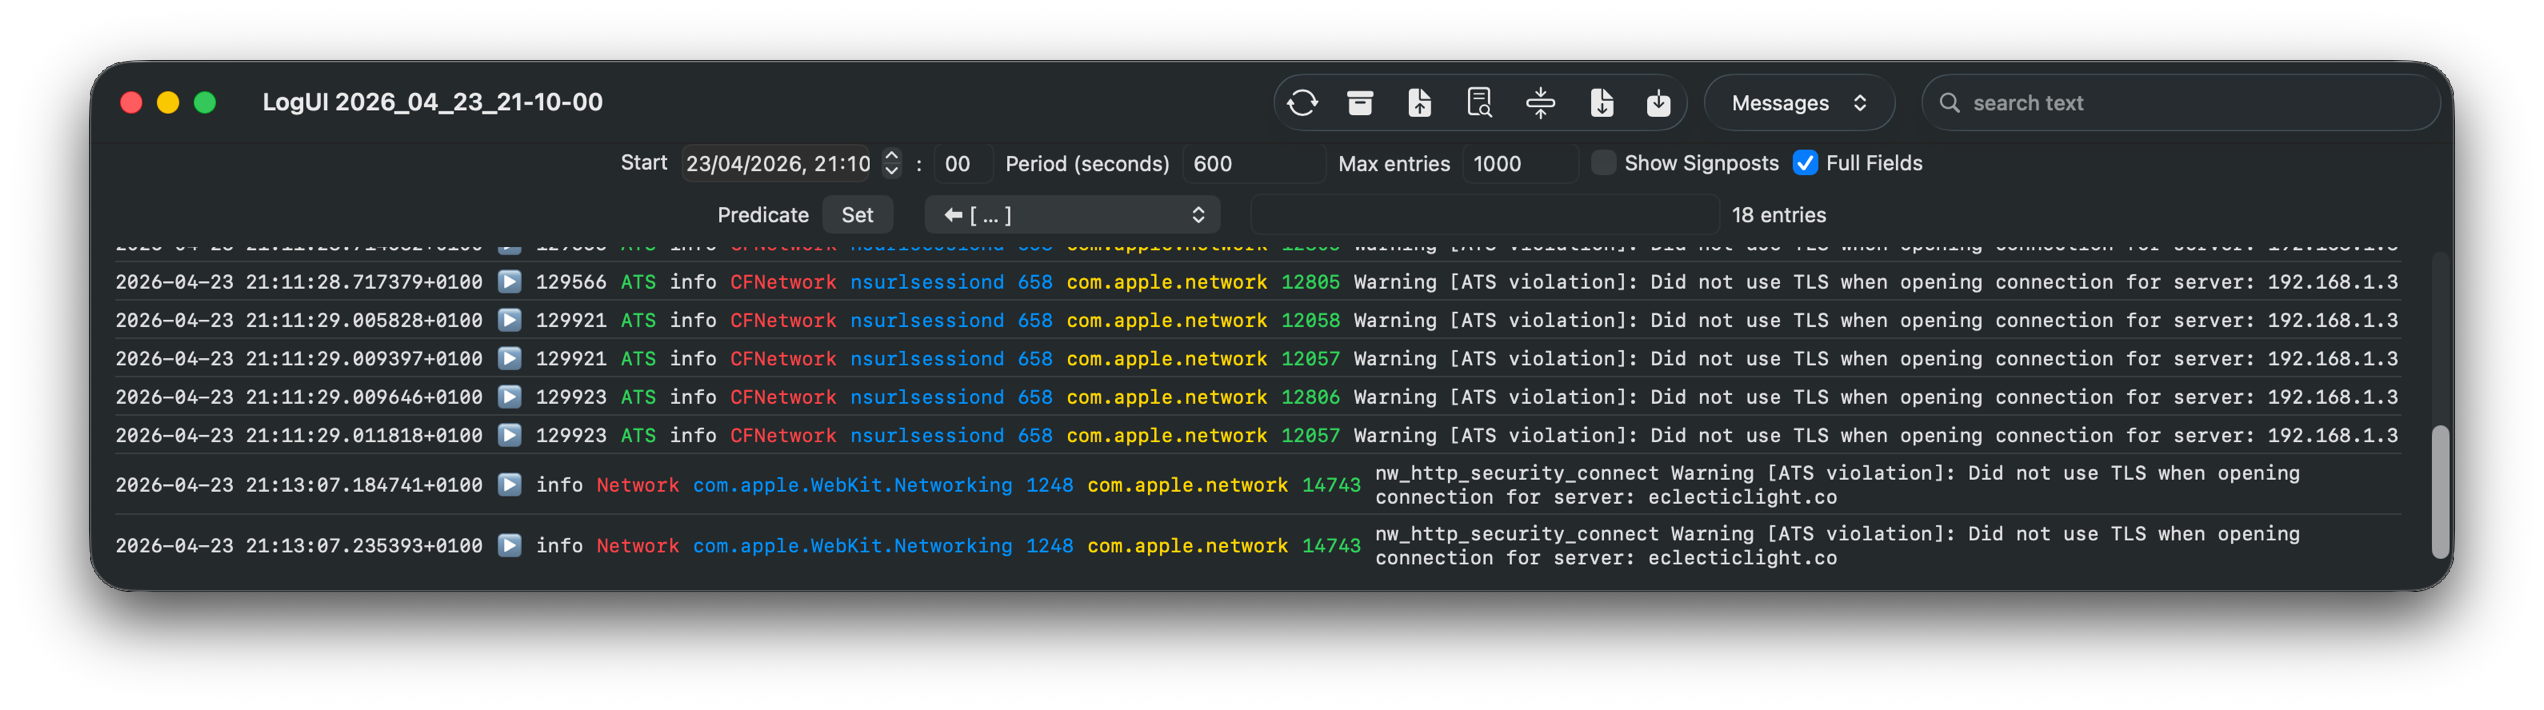
Over a ten-minute period of network access, that returned a workably small number of log entries for further checking.
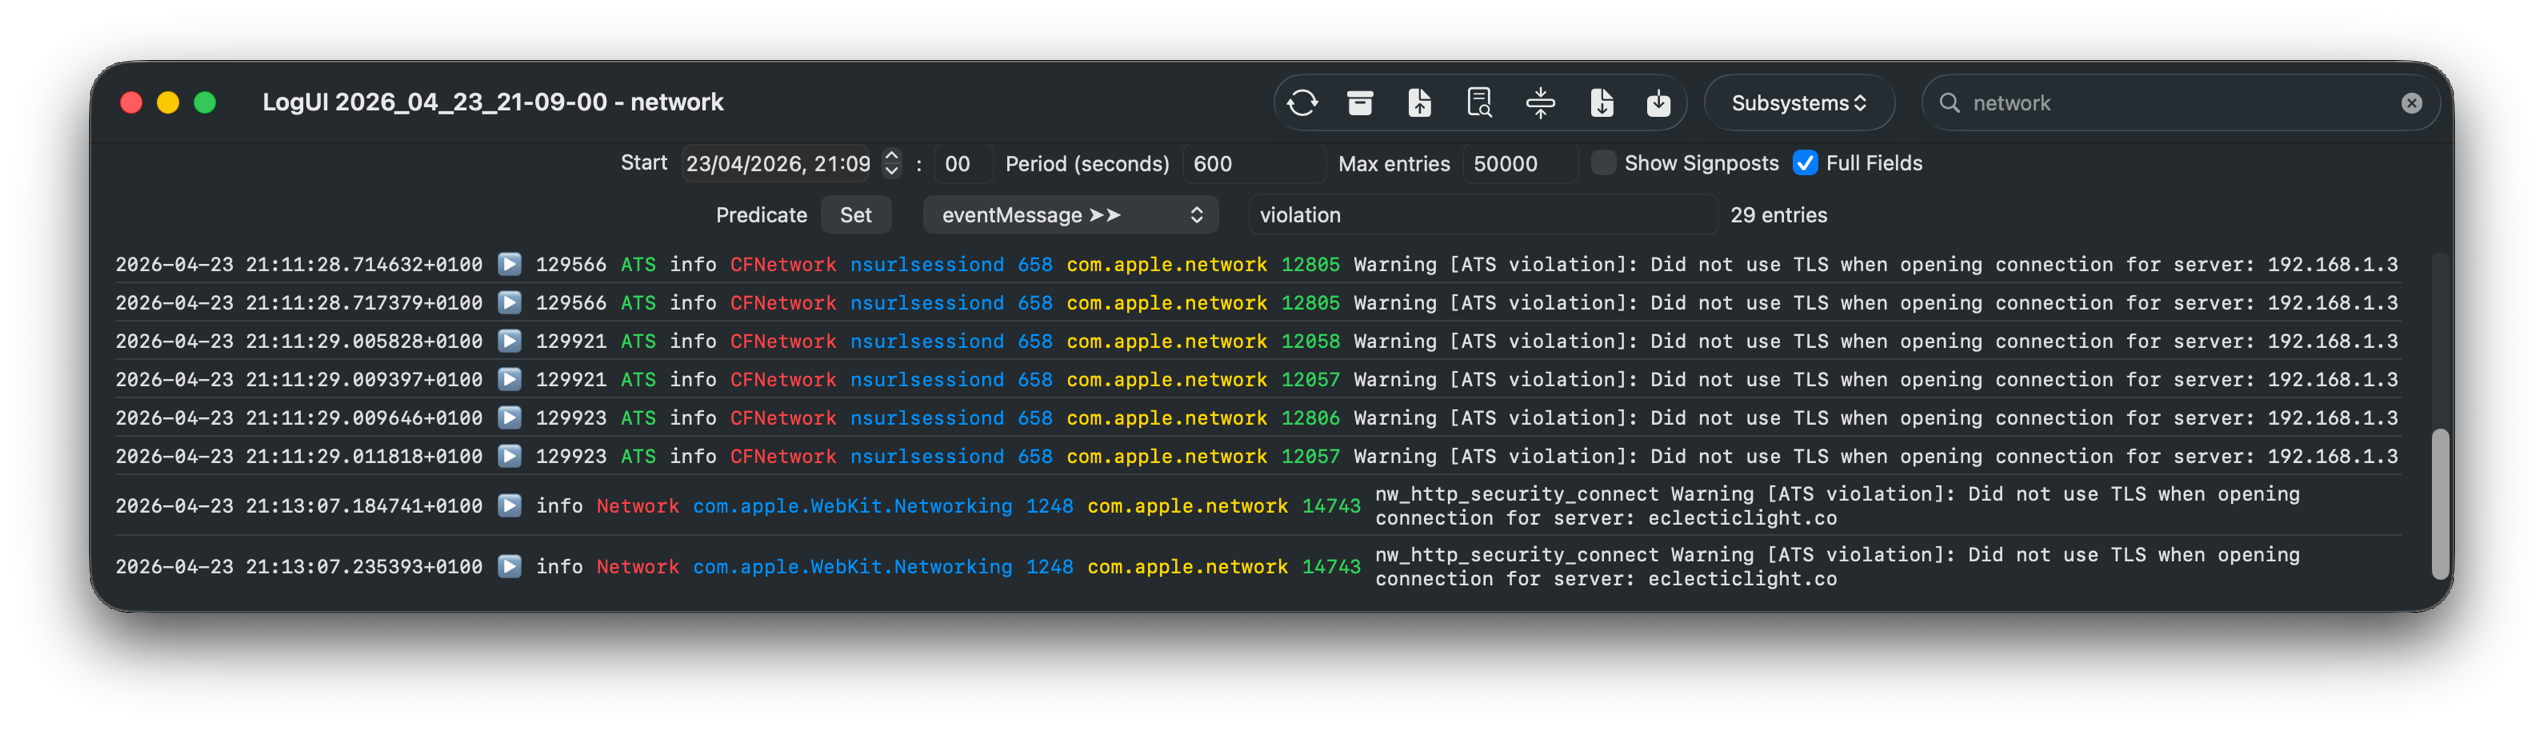
A little careful thought suggested a more logical approach, effectively using the predicate(message CONTAINS[cd] 'violation')
using LogUI’s popup predicate menu, then filtering those few entries using the word network in their subsystem field, with exactly the same results.
It really isn’t that hard to come up with a log browser that can handle such tasks far better than the command line ever could. But from the start it has been clear that Console isn’t intended to assist browsing the Unified log, only to discourage it.
Few of those now working for Apple can remember that for the first 17 years of Macs, until the arrival of Mac OS X, there was no command line at all. We got by with utilities crafted by Apple like ResEdit.

Here ResEdit is displaying the resources of QuarkXPress version 4.11 from around 2000. The app icons shown are stored in a resource of type BNDL, a ‘bundle’, but not in the later sense of the term.
![]()
I feel sure that more engineers will recall the GUI provided in Mac OS X Server, in its Server Admin app that wrapped many of its tricky tasks in a familiar interface, making administration a true joy. One weak area was DNS management, for which there were third-party alternatives including that from Men&Mice, now part of BlueCat.
![]()
In later, more consumer-oriented versions, Server.app was more concise but remained rich in function. Its sidebar let you manage users and groups, monitor your server, control its services, manage hardware, and control system, network and storage settings. Below that the Next Steps button provided access to help topics and useful suggestions.
In the years since, Apple has steadily stripped out many of those utilities that provided ordinary users with an alternative to the command line.

Network Utility contained a friendly front-end to a suite of valuable tools to help diagnose network problems. It was deprecated in Big Sur, then removed, with Apple explicitly advising the use of command tools instead.
Other utilities have followed a similar pattern. Initially, some of their more advanced features are removed, then the app is hidden away in /System/Library/CoreServices/Applications to discourage its use, in preparation for telemetry to justify its removal on the grounds of lack of use. Once it has gone all we have left is a clumsy conglomeration of options in a *util command tool, and users forced to copy and paste in training for a ClickFix attack.
This is good news for indie developers like Michael Tsai at C-Command, and Bryan Christianson, who can then build replacement apps such as DropDMG and WhatRoute, and some of my own utilities like Spundle. But they can only reach a limited audience, and the majority are left to rehearse for ClickFix.
At the same time that Apple has been normalising the use of the command line, it has invested heavily in app security, from Gatekeeper and quarantine, to XProtect and notarisation. Predictably, ClickFix attacks sidestep past those and exploit the behaviour that its victims have been conditioned to because macOS doesn’t provide the apps needed for its administration and maintenance.
ClickFix is thus largely self-inflicted by a modern macOS that places greater priority on apps that generate income, and design fads like Liquid Glass.
![]()