Normal view

There are new articles available, click to refresh the page.
Before yesterdayMain stream

Last Week on My Mac: Plan ahead with this summer’s mallyshag

By: hoakley
29 June 2025 at 15:00

Summer is an unpredictable time of year. With the Atlantic hurricane season already upon us, we could see searing heat or devastating storms. So it is with the announcements made at WWDC earlier this month: do we have time to try out some of the new features coming in three months, or must we get on with wrangling deprecations and changes looming in macOS Tahoe?

A glance through Apple’s beta release notes might suggest it should prove innocuous, and the great majority of code that’s already happy in Sequoia should have no problems in Tahoe, and so far that’s my experience. That should leave us plenty of time to adjust our app icons so they display properly in the Dock and elsewhere, but it’s there it gets more subtly complicated.

Fix app icons

I don’t think I can over-stress the importance of using Icon Composer for creating replacement app icons. If you don’t, then Tahoe seems determined to deface many traditional icons so they become almost illegible and unusable. The only exemptions are those already conforming to the fixed outline of a square with rounded corners. Any irregularity such as putting a pixel outside that, and they’re relegated to the sin bin.

Here are two icons for the same app viewed in Tahoe. The left one uses a traditional AppIcon.icns icon image, while that on the right is the same circular PNG that has been applied using Icon Composer and added as a .icon file. So far my attempts to get this to work using Xcode 16.4 have been unsuccessful, and the only solution has been to use a beta-release of Xcode 26.

Overhaul controls

That brings with it another problem, as it automatically converts AppKit and SwiftUI layouts so they use Tahoe’s new interface style, and that can generate further work. If you look closely at Apple’s demos of Tahoe at WWDC, you may notice that its controls have changed in size and shape. Not only do most have more rounded corners, but they also have different dimensions.

Interface conversion for apps that use AppKit or SwiftUI is clever, as it preserves the original for use in previous versions of macOS, and only adopts the new style when in Tahoe. Build your app with its smart new Tahoe-compatible icon and run it in Sequoia, and it looks just the same as it did.

This demo, Mallyshag, looks the same in Sequoia, but has become a mess in Tahoe because of those changed control dimensions.

Those three buttons are significantly wider, so now overlap one another and are wider than the text box below. They need a careful overhaul before they’re ready for Tahoe. Conversion can also have unexpected side-effects: for example, I’ve had some selectable text fields changed to be editable as well. You can see an example that I missed in the left view in XProCheck’s window. I now check carefully through every detail in windows that have been migrated by Xcode to support Tahoe.

This doesn’t just apply to AppKit windows in Interface Builder. Although SwiftUI dynamically positions controls, I’ve found it necessary to increase the minimum width of some views to ensure they remain fully usable.

Aside from any code changes needed, migrating an app to Tahoe thus requires:

  • creation of a new app icon using Icon Composer;
  • adding the .icon file to the Xcode project and setting it as the app icon;
  • careful checking and rectification of all windows and their contents.

NSLog

There’s one last thing that may have escaped your attention in Apple’s release notes: NSLog. When Apple introduced the Unified log in macOS Sierra, it preserved the longstanding use of NSLog as a means of making entries with a minimum of fuss. More formal methods are more cumbersome, although they’re also more powerful, so NSLog still remains popular with developers, at least until Tahoe’s change.

A long way down the release notes, and oddly announced under the subheading of New Features, Apple states that NSLog will no longer record anything of use in its entries in the Unified log, although they’ll still be reported in full in Xcode and to stdout. One of the other purposes of my test app Mallyshag was to verify just what is now recorded by NSLog.

This is the entry obtained using LogUI when running either version of the app in macOS 15.5:

And this is the extent of entries seen in macOS 26:

So what in earlier macOS might have been a useful
Error number 1467296 in Mallyshag
is redacted to the contentless stub <private>.

If you still use NSLog, you’ll almost certainly want to move on to a better alternative, again being careful to avoid ending up with its contents redacted.

Outcomes

Come the release of macOS 26 Tahoe, there’ll be three groups of apps:

  • those that haven’t been ported at all, whose icons will be almost unrecognisable;
  • those whose icons display correctly, but with flaws in interface controls;
  • those that work as expected, with conformant icons and controls.

Some will also write dysfunctional messages in the log, because they’re still using NSLog, although few users are likely to notice that.

That doesn’t take into account those apps relying on alternatives to AppKit and SwiftUI for their interface, as those have a great deal of ground to cover in just a few months if they’re going to be ready in time for Tahoe’s release.

That’s why I’ve started unusually early in getting my apps ready for the autumn/fall. I’m sure that summer still has some surprises in store.

Mallyshag?

This is a local Isle of Wight name for a caterpillar, usually a large and hairy one. It just seemed appropriate.

merianlappet
Maria Sibylla Merian (1647–1717), Metamorphosis of the Lappet (after 1679), watercolour, 19.3 x 15.9 cm, Städelsches Kunstinstitut und Städtische Galerie, Frankfurt am Main, Germany. Wikimedia Commons.

Starting up: early kernel boot in macOS 15, iPadOS 18 and iOS 18

By: hoakley
23 June 2025 at 14:30

Starting up a Mac, iPad or iPhone begins a series of processes progressing from their small boot ROMs to user login, starting up the services required for the operating system and booting the array of hardware in the chip. Early phases, before the kernel is booted, leave little in the way of records, just a few ‘breadcrumbs’ in NVRAM, but the kernel and processes it starts write a great many entries in the log. This article describes a few of those, concentrating on macOS 15.5, with additional information on iPadOS and iOS 18.5.

Logs

These were obtained from logarchives made soon after normal startup on:

  • Mac mini M4 Pro, booting macOS 15.5 in Full Security mode from the internal SSD;
  • iPad Pro 11-inch (4th generation)(Wi-Fi), with an M2 booting iPadOS 18.5 normally;
  • iPhone 15 Pro, booting iOS 18.5 normally.

Logarchives were opened in LogUI and all log entries (excluding Signposts) were extracted for the first 5 seconds following the start of kernel boot and saved to a LogUI JSON file. Following correction for time adjustments (see below), those contained:

  • for macOS, 20,000 entries in a total of 5.7 seconds;
  • for iPadOS, 10,000 entries in a total of 5.7 seconds;
  • for iOS, 10,000 entries in a total of 5.6 seconds.

Each set of entries opens with an entry recording the first moment of the boot process, for example
08:23:33.343017 === system boot: CCB8E0AC-5B94-4789-B951-BF0B893FF45F
following which there is a gap of over 5 seconds during which preboot is completed. The next entry then records the start of kernel boot, for example in macOS with
08:23:38.536777 kprintf initialized

Periods between those two entries were 5.2 seconds for macOS, 5.3 seconds for iPadOS, and 5.1 seconds for iOS.

Times and their correction

One potential source of major error in using log entries during startup results from clock time corrections. When started up, Macs and Apple’s devices appear invariably to have clock times about 6 seconds in advance of UTC. This is corrected about 4 seconds into kernel boot, and marked in two log entries such as
00.827884 === system wallclock time adjusted
00.860742 === system wallclock time adjusted

The first adjustment normally sets the clock back slightly more than necessary, but the second corrects that more accurately.

Effects on timestamps in log entries can appear confusing, as entries prior to time adjustment are given later timestamps than entries written after the adjustments have been made. This may give the impression that the order of log entries is incorrect, and any time calculations that depend on times recorded before and after adjustment require compensation by the two adjustments made. All times given below are taken from records made before system wallclock time adjustment, thus don’t require correction.

Time adjustments may need to be taken into consideration when accessing Endpoint Security events, as some may be written before adjustments are made, so might appear to be out of kilter with later events. This could apply to boot events for the launchd Subsystem, for example.

Log entries

Shortly after the start of kernel log entries with the initialisation of kprintf, the kernel banner is written, but only in macOS
Darwin Kernel Version 24.5.0: Tue Apr 22 19:53:27 PDT 2025; root:xnu-11417.121.6~2/RELEASE_ARM64_T6041

Virtual memory, logging and other fundamental features are then prepared, and in macOS (not iPadOS or iOS) TXM, the Trusted Execution Monitor, is started
TXM [Log]: build variant: txm.macosx.release.TrustedExecutionMonitor_Guarded-135.100.3
followed by the announcement of two stages of preboot, at 0.11 seconds after the start of kernel boot:
iBoot version: iBoot-11881.121.1
iBoot Stage 2 version: iBoot-11881.121.1

It’s notable that macOS gave an iBoot version of 11881.121.1, but iPadOS and iOS gave a slightly later version of 11881.122.1.

According to Apple, TXM (together with SPTM) is active on all three platforms, although it only appears to be well-reported in macOS. Apple explains: “Secure Page Table Monitor (SPTM) and Trusted Execution Monitor (TXM) on iOS, iPadOS, macOS and visionOS are designed to work together to help protect page tables for both user and kernel processes against modification, even when attackers have kernel write capabilities and can bypass control flow protections.” TXM then enforces the policies that govern code execution.

The kernel then turns its attention to loading Core Crypto support, reported in detail in all three platforms, and support for Image4 files, used extensively during and after boot:
0.295967 Darwin Image4 Extension Version 7.0.0: Tue Apr 22 19:44:19 PDT 2025; root:AppleImage4-320.100.22~1926/AppleImage4/RELEASE_ARM64E
and security policy is loaded (reported in macOS only).

AMFI and credential management

All three platforms then report loading of Apple Mobile File Integrity (AMFI), which obtains the model designator from the device tree:
AMFI: queried model name from device tree: Mac16,11
AMFI: queried model name from device tree: iPad14,3
AMFI: queried model name from device tree: iPhone16,1

which is probably the simplest way to confirm the model identifier from the log at this stage. On iOS only, AMFI next reports disabling Swift Playgrounds JIT:
AMFI: disabling Swift Playgrounds JIT services on iPhone devices

The kernel then turns to management of credentials with Credential Manager, which works with secrets managed by the Secure Enclave Processor (SEP) (all platforms). One key log entry to look for is the report of SEP Key Store startup,
"AppleSEPKeyStore":326:0: starting (BUILT: Apr 22 2025 19:45:09) ("normal" variant 🌽 , 1827.120.2)

Startup of hardware systems continues, with Bluetooth reported early, followed by IOThunderboltFamily, and the Apple Neural Engine ANE. In macOS only, the remains of an old copyright notice will then appear:
Copyright (c) 1982, 1986, 1989, 1991, 1993 The Regents of the University of California. All rights reserved.
iPadOS and iOS report Backlight startup in
AppleARMBacklight::start: Using new Backlight Architecture 1

CPU cores

After those, in macOS only, the log records registration of CPU cores and their clusters, then starts each in turn. Prior to this, all code has been run on a single core, but once the others have been started, multiple cores are available. The exact log entries recording this may vary between different M families, but typically run as follows:

  • ml_processor_register>pset_find(cluster_id=0) returned pset -1
  • ml_processor_register>pset_create(cluster_id=0) returned pset 0
  • ml_processor_register>cpu_id 0x0 cluster_id 0 cpu_number 0 is type 1
  • repeated to create each cluster and allocate CPUs to them, then
  • cpu_start() cpu: 0
  • arm_cpu_init(): cpu 0 online
  • for each CPU in turn.

Although the iPad tested has an M2 chip, no such sequence was reported for its CPU cores in the log.

Security policy

macOS reports Gatekeeper status and the start of AppleSystemPolicy:
AppleSystemPolicy GK status: enabled
AppleSystemPolicy Per file changetime scans: enabled
Security policy loaded: Apple System Policy (ASP)
AppleSystemPolicy has been successfully started

APFS

APFS follows, with differences between log entries according to platform. Initial loading is announced in each, giving the version number
apfs_module_start:3403: load: com.apple.filesystems.apfs, v2332.120.31, apfs-2332.120.31.0.2, 2025/04/22
In macOS only, NFS is announced shortly afterwards
com_apple_filesystems_nfs: successfully loaded NFS module
and handling individual file system devices follows.

Boot devices are recorded in full:
Got boot device = IOService:/AppleARMPE/arm-io@10F00000/AppleH16GFamilyIO/ans@9600000/AppleASCWrapV6
/iop-ans-nub/RTBuddy(ANS2)/RTBuddyService/AppleANS3CGv2Controller/NS_01@1/IOBlockStorageDriver
/APPLE SSD AP2048Z Media/IOGUIDPartitionScheme/Container@2/AppleAPFSContainerScheme/AppleAPFSMedia
/AppleAPFSContainer/Macintosh HD@1
(macOS)
Got boot device = IOService:/AppleARMPE/arm-io@10F00000/AppleT811xIO/ans@77400000/AppleASCWrapV4
/iop-ans-nub/RTBuddy(ANS2)/RTBuddyService/AppleANS3CGv2Controller/NS_01@1/IOBlockStorageDriver
/APPLE SSD AP0512Z Media/IOGUIDPartitionScheme/Container@1
(iPadOS)
Got boot device = IOService:/AppleARMPE/arm-io@10F00000/AppleH16IO/ans@F9400000/AppleASCWrapV6
/iop-ans-nub/RTBuddy(ANS2)/RTBuddyService/AppleANS3CGv2Controller/NS_01@1/IOBlockStorageDriver
/APPLE SSD AP0128Z Media/IOGUIDPartitionScheme/Container@1
(iOS)

Each platform states the BSD root in a paired entry:
BSD root: disk3s1
, major 1, minor 15

By that time, the boot process is well underway and log entries are being made every few microseconds.

Key points

  • Log entry times need to be corrected when they straddle clock adjustments marked by === system wallclock time adjusted
  • === system boot: marks the start of preboot, following which there are no log entries for over 5 seconds before kernel boot starts.
  • Start of Trusted Execution Monitor (TXM) is only logged in macOS, although it’s also active in iPadOS and iOS.
  • iBoot versions may differ between macOS, and iPadOS/iOS.
  • An early log entry from AMFI reports the model designator.
  • AMFI reports disabling Swift Playgrounds JIT services on iPhones.
  • In macOS only, CPU clusters and cores are registered, and started up individually.
  • macOS then reports Gatekeeper (GK) status and the start of AppleSystemPolicy.
  • The boot device is reported in full.
  • Throughout these, many other services and hardware features are started up.
  • During early kernel boot, macOS writes 20,000 log entries in about 5.7 seconds, iPadOS and iOS 10,000.

Boot disk structure in macOS, iOS and iPadOS, and AI cryptexes

By: hoakley
20 June 2025 at 14:30

Volume structure of internal startup disks has grown increasingly complex during the transition from Intel to Apple silicon Macs. There also seems to be little information on iOS and iPadOS to compare against. This article briefly reviews structures of macOS 15 Sequoia on Apple silicon, iOS 18 and iPadOS 18.

Information for macOS is derived from the diskutil command tool, and from APFS entries in the log when booting a Mac mini M4 Pro in macOS 15.5. That for iOS is drawn from APFS entries in the log when booting an iPhone 15 Pro in iOS 18.5. That for iPadOS is drawn from APFS entries in the log when booting an iPad Pro 11-inch (4th generation)(Wi-Fi) in iPadOS 18.5. All three had Apple Intelligence enabled prior to booting. iOS and iPadOS logs were obtained from sysdiagnoses, and all logs were read using LogUI.

macOS 15 (Apple silicon)

The boot volume group consists of six volumes in a single container (partition). Two other containers are normally hidden from the user:

  • the first container of around 524 MB is reserved for preboot and secure boot support.
  • another container of about 5.4 GB is used for fallback recovery frOS, and in Big Sur was the primary recovery system, until the introduction of paired recovery volumes in macOS 12 Monterey.

The boot volume group contains:

  • System, left unmounted after booting from its Signed System Volume (SSV) snapshot;
  • Data, the only encrypted volume in the group, with numerous cryptexes grafted into it, and firmlinked to the SSV at multiple points;
  • paired, primary Recovery, containing a disk image of the Recovery system;
  • VM, the backing store for virtual memory;
  • Preboot, for early stages in the secure boot process, with cryptexes grafted into it;
  • Update, used as a working volume for macOS updates.

There are two groups of cryptexes grafted onto those volumes:

  • system cryptexes, including the large SystemCryptex or os.dmg of about 4.3 GB mainly containing dyld caches, and the smaller AppCryptex or app.dmg containing Safari and supporting components;
  • PFK volumes containing support components for Apple Intelligence features. These are numerous, and some are listed in the Appendix at the end.

If you’re wondering what a PFK volume might be, so am I. But this is what Google’s AI had to say: “Mac PFK” likely refers to a combination of MAC knives and Practical Fishkeeping (PFK) magazine. MAC knives are known for their high-quality, sharp blades and are popular among chefs and home cooks. Practical Fishkeeping is a magazine focused on fishkeeping, covering various aspects of the hobby.

These are summarised, without the help of Practical Fishkeeping, in this diagram.

iPadOS 18

In contrast to macOS since Big Sur, iPadOS and iOS only appear to have two containers (partitions) on their internal storage. The first is presumed to be similar in purpose to that in macOS, in supporting preboot and secure boot, although there is a xART volume in the boot volume group. In iPadOS, this container is smaller, at around 367 MB.

The boot volume group contains a slightly different range of volumes:

  • there is no Recovery volume;
  • there is no VM volume, as iPadOS doesn’t ordinarily support swapping/paging, although M-series models can in certain circumstances;
  • User, a second encrypted volume, appears unique to iPadOS;
  • xART and Hardware volumes are additional.

Cryptexes appear similar, with both system cryptexes and PFK volumes.

These are summarised below.

iOS 18

This is similar to iPadOS, with a first container/partition of around 351 MB, and the following differences in the boot volume group:

  • there is no User volume, and no Update volume;
  • Baseband Data is additional.

Cryptexes appear similar, with both system cryptexes and PFK volumes.

These are summarised below.

Conclusions

  • Volume structure of internal startup disks differs considerably between macOS, iPadOS and iOS.
  • As would be expected, iPadOS and iOS are most similar, but even they have substantial differences.
  • They each run their systems from a Signed System Volume firmlinked to an encrypted Data volume.
  • They each graft on two sets of cryptexes, one supplementing the system with dyld caches and Safari, the other providing components for AI.
  • There are now at least 24 cryptexes used to support AI.

I welcome corrections and explanations, please.

Appendix: Some PFK volumes from cryptexes

  • UC_FM_LANGUAGE_INSTRUCT_300M_BASE_GENERIC_GENERIC_H14G_Cryptex.dmg
  • UC_FM_LANGUAGE_INSTRUCT_300M_BAUC_FM_LANGUAGE_INSTRUCT_300M_BASE_GENERIC_GENERIC_H14G_Cryptex.dmg
  • UC_FM_LANGUAGE_INSTRUCT_3B_DRAFTS_GENERIC_GENERIC_H14G_Cryptex.dmg
  • UC_FM_LANGUAGE_INSTRUCT_3B_CONCISE_TONE_DRAFT_GENERIC_GENERIC_H14G_Cryptex.dmg
  • UC_FM_LANGUAGE_INSTRUCT_3B_MAIL_REPLY_DRAFT_GENERIC_GENERIC_H14G_Cryptex.dmg
  • UC_FM_LANGUAGE_INSTRUCT_3B_MAIL_REPLY_DRAFT_GENERIC_GENERIC_H14G_Cryptex.dmg
  • UC_FM_LANGUAGE_INSTRUCT_3B_BASE_GENERIC_GENERIC_H14G_Cryptex.dmg
  • UC_FM_LANGUAGE_INSTRUCT_3B_PROFESSIONAL_TONE_DRAFT_GENERIC_GENERIC_H14G_Cryptex.dmg
  • UC_FM_LANGUAGE_INSTRUCT_3B_SUMMARIZATION_DRAFT_GENERIC_GENERIC_H14G_Cryptex.dmg
  • UC_FM_LANGUAGE_INSTRUCT_3B_TEXT_EVENT_EXTRACTION_DRAFT_GENERIC_GENERIC_H14G_Cryptex.dmg
  • UC_FM_LANGUAGE_INSTRUCT_3B_PROOFREADING_REVIEW_DRAFT_GENERIC_GENERIC_H14G_Cryptex.dmg
  • UC_FM_HANDWRITING_SYNTHESIS_GENERIC_H14G_Cryptex.dmg
  • UC_FM_LANGUAGE_INSTRUCT_3B_TEXT_EVENT_EXTRACTION_MULTILINGUAL_DRAFT_GENERIC_GENERIC_H14G_Cryptex.dmg
  • UC_FM_LANGUAGE_INSTRUCT_3B_MESSAGES_REPLY_DRAFT_GENERIC_GENERIC_H14G_Cryptex.dmg
  • UC_FM_LANGUAGE_INSTRUCT_3B_AUTONAMING_MESSAGES_DRAFT_GENERIC_GENERIC_H14G_Cryptex.dmg
  • UC_FM_LANGUAGE_INSTRUCT_3B_URGENCY_CLASSIFICATION_DRAFT_GENERIC_GENERIC_H14G_Cryptex.dmg
  • UC_FM_LANGUAGE_INSTRUCT_3B_FRIENDLY_TONE_DRAFT_GENERIC_GENERIC_H14G_Cryptex.dmg
  • UC_FM_HANDWRITING_SYNTHESIS_MULTILINGUAL_GENERIC_GENERIC_H14G_Cryptex.dmg
  • UC_FM_VISUAL_IMAGE_DIFFUSION_V1_BASE_GENERIC_H14G_Cryptex.dmg
  • UC_FM_LANGUAGE_INSTRUCT_3B_TEXT_PERSON_EXTRACTION_MULTILINGUAL_DRAFT_GENERIC_GENERIC_H14G_Cryptex.dmg
  • SECUREPKITRUSTSTOREASSETS_SECUREPKITRUSTSTORE_Cryptex.dmg
  • UC_FM_LANGUAGE_INSTRUCT_3B_TEXT_PERSON_EXTRACTION_DRAFT_GENERIC_GENERIC_H14G_Cryptex.dmg
  • UC_FM_LANGUAGE_INSTRUCT_3B_MAGIC_REWRITE_DRAFT_GENERIC_GENERIC_H14G_Cryptex.dmg
  • UC_IF_PLANNER_NLROUTER_BASE_EN_GENERIC_H14G_Cryptex.dmg

Source: iPadOS 18.5, configured with AI enabled for British English.

The future of SilentKnight, and updates to XProCheck and LogUI

By: hoakley
19 June 2025 at 14:30

SilentKnight’s history goes back to an unfortunate error in late 2016 when Apple shipped a batch of brand new MacBook Pros with SIP inadvertently disabled. At that time the only way to tell that was in Terminal, so I set about creating an app to make it easier to check. That became the first release of LockRattler in December 2016.

lrattlerdemo4

Demand for this grew steadily, as did LockRattler, and within a year it was checking additional security data in macOS.

sipblock2

At the same time it became clear from several reports that some Macs had EFI firmware that was woefully out of date. Some models were particularly prone to this, but at the time there were no lists of up-to-date firmware versions, and no local means to check them. In the summer of 2019, I started development on what was to become SilentKnight, originally named EFIcienC. This relied on a database that I built from looking inside macOS updaters to discover the latest firmware versions that should have been installed, but sometimes weren’t.

EFIcienC01

That soon took the familiar look of SilentKnight.

silentknight01d

Three years later, there wasn’t much that SilentKnight didn’t check for.

sk221

Since the first version of SilentKnight, Apple has steadily been putting its house in order, and Macs have undergone great change. Next year’s major version of macOS 27 will no longer support Intel Macs, and that questions whether there’s a role for SilentKnight in the future.

Much of what SilentKnight does today is rapidly becoming redundant:

  • T2 and Apple silicon firmware updates are now reliable and tied to macOS versions, so no longer need to be checked separately.
  • In Apple silicon Macs, disabling SIP requires reducing boot security, so doesn’t need to be checked separately.
  • XProtect updates are now delivered via iCloud and are more reliable, and not amenable to forced update.
  • XProtect Remediator updates have become infrequent, every month or so.
  • XProtect Remediator scans require separate, more detailed checks to interpret them properly.
  • The TCC database has changed and is no longer updated as it used to be.
  • Few security data updates are now delivered by softwareupdate.

Although SilentKnight has been a comfort over the last six years, its value is declining rapidly, and I don’t intend supporting it for macOS 27. It will though continue to support Macs running Tahoe and earlier, including all Intel models. Instead, I’d much prefer to develop Skint as a lightweight replacement for Apple silicon Macs in the future. Please provide me with your thoughts in comments here.

For those still using LockRattler, that hasn’t been updated for Sonoma or later, and the command tool companion to SilentKnight, silnite, doesn’t support Sequoia or later. They have both given good service over the years, but Macs and macOS have moved on.

XProCheck 1.7

If you use SilentKnight, you’ll be aware that XProtect Remediator scans have changed over the last year or so. Prior to that, the only time that scans by its plugins were cancelled was after an update. Now they’re run against a timer, and if they overstay their time limit, that plugin scan is cancelled. When this first started to occur, it wasn’t clear whether this was going to be a lasting behaviour, but it’s now well-established and common if not universal.

This new version of XProCheck now reports cancelled scans separately, using a ⏹ emoji rather than a warning. I have also optimised its main view to look better when running in macOS 26 Tahoe, and made its app icon compatible with Tahoe’s requirements.

XProCheck 1.7 for macOS Big Sur and later is now available from here: xprocheck17
from its Product Page, and via its auto-update mechanism.

LogUI 1.0 build 68

Although this new build of my log browser LogUI is primarily to improve compatibility with macOS 26 Tahoe, including a new conformant app icon, this may bring a pleasant surprise for those who want to browse huge log extracts. According to a presentation at this year’s WWDC, “on macOS, lists of over 100,000 items now load six times faster.”

LogUI 1.0 build 68 for macOS Sonoma and later is now available from here: logui168
and from its Product Page.

App icons

Even if you didn’t watch any of the presentations at WWDC this year, you should by now have noticed that app icons are changing for Tahoe. Please bear with me as I progressively bring mine into conformance. I will explain more, with illustrations, in my Sunday morning article here.

WWDC25 设计课程合集【中英字幕】

By: Steven
13 June 2025 at 21:40

因为想了解苹果对 Liquid Glass 的定义和执行,以及对设计和开发的建议和约束,通过这些来进一步分析这套全新的设计语言究竟意味着什么,所以在翻看官方资料的过程中也顺便就把这些视频给翻译(用 AI 辅助)了。我集中上传到了自己的B站主页,为了方便其他人,我也在 blog 这里建立一个合集页面。

这六条并不是设计相关内容的全部视频,官方课程中还有其他视频,只是这六条是我自己比较关心的部分,和我后续的视频要分析的东西相关,因此挑选了这六条。如果你有其他关心的主题,可以前往以下官方页面寻找对应的内容。

https://developer.apple.com/videos/wwdc2025/

WWDC25新设计-01|了解新的设计系统 Get to know the new design system

深入了解新的设计系统,探索视觉设计、信息架构和核心系统组件的关键变化。了解该系统如何重塑界面与内容之间的关系,让您能够创建动态、和谐且跨设备、屏幕尺寸和输入模式一致的设计。

WWDC25新设计-02|认识液态玻璃 Meet Liquid Glass

Liquid Glass 统一了 Apple 平台的设计语言,同时提供了更具活力、更富表现力的用户体验。了解 Liquid Glass 的设计原理,探索其核心的光学和物理特性,并了解它的适用场景和使用原因。

WWDC25新设计-03|从创意到界面的设计基础 Design foundations from idea to interface

优秀的应用给人以清晰、直观、使用便捷的感觉。在本课程中,您将探索应用设计如何提升功能性、传达目标、引导用户浏览内容,以及如何巧妙地运用组件,在保持简洁体验的同时又不失影响力。本课程面向各种技能水平的设计师和开发者,以及所有对设计感兴趣的人士。

WWDC25新设计-04|设计交互式片段 Design interactive snippets

代码片段是由 App Intent 调用的紧凑视图,用于显示来自您 App 的信息。现在,代码片段可以让您的 App 为 Siri、Spotlight 和快捷指令 App 带来更多功能,方法是在 Intent 中包含按钮和状态信息,从而提供额外的交互性。在本课程中,您将学习设计代码片段的最佳实践,包括布局、排版、交互和 Intent 类型的指导。

WWDC25新设计-05|迎接应用图标的新外观 Say hello to the new look of app icons

概览 iOS、iPadOS 和 macOS 的全新 app 图标外观,包括明暗色调和清晰选项。学习如何运用雾面和半透明效果,让你的 app 图标更加鲜明、动感、富有表现力,以及如何确保你的图标与镜面高光完美契合。

WWDC25新设计-06|使用 Composer 创建图标 Create icons with Icon Composer

了解如何使用 Icon Composer 为 iOS、iPadOS、macOS 和 watchOS 制作更新的 app 图标。了解如何从您选择的设计工具中导出素材,将它们添加到 Icon Composer,应用实时玻璃属性和其他效果,以及如何预览并根据不同的平台和外观模式进行调整。

LogUI build 65 introduces a Logarchive Tool

By: hoakley
11 June 2025 at 15:00

Just before the start of WWDC, I released an update to my log browser LogUI adding support for accessing logarchives. I promised that there was more support for logarchives on its way. LogUI 1.0 build 65 dedicates a whole window to them, in its Logarchive Tool.

There are many situations where you can’t access the active log, and you can’t create a logarchive using the log command tool or a sysdiagnose. These include:

  • When you only have access to the contents of the Mac or device’s storage, particularly in forensics, or following hardware failure.
  • When you want access to the logs in a backup. Time Machine backups normally include full log files, for example.
  • When you don’t have ssh or similar access to a remote Mac.
  • When the log records may be incomplete or damaged.

Provided that you can copy two folders from the hidden /var/db folder on that Mac or device, LogUI can turn those into a browsable logarchive.

Create a logarchive from folders

On your Mac, create a folder somewhere convenient such as ~/Documents. As this method doesn’t use the log command, this can be on an external disk if you wish.

From the source Data volume copy the folders at /var/db/diagnostics and /var/db/uuidtext to your folder, so it looks like this.

Open LogUI, and from its Window menu open its Logarchive Tool. This offers you four tools and two checkboxes. Click on the Create Logarchive tool and first select the folder you created, containing the log folders. Then give the new logarchive a suitable name and save it somewhere convenient.

LogUI should then inform you in its window that creation has completed. As this is performed using undocumented code for an undocumented format, it may not always work correctly. If there are any problems, repeat the same with the Debug checkbox ticked, and it will give you a detailed commentary of what it does, which should help you understand what went wrong.

Getting info about a logarchive

The trickiest part of accessing logarchives is knowing what they contain, more specifically the time periods for which they have log records. LogUI’s Logarchive window provides two aids to provide you with that information, in its Catalogue and Analyse tools.

Catalogue simply lists all the tracev3 files in the logarchive, giving the datestamps each was created and last modified, together with the period between those, and the file size.

Leave that open as you browse that logarchive, to guide your way through its entries.

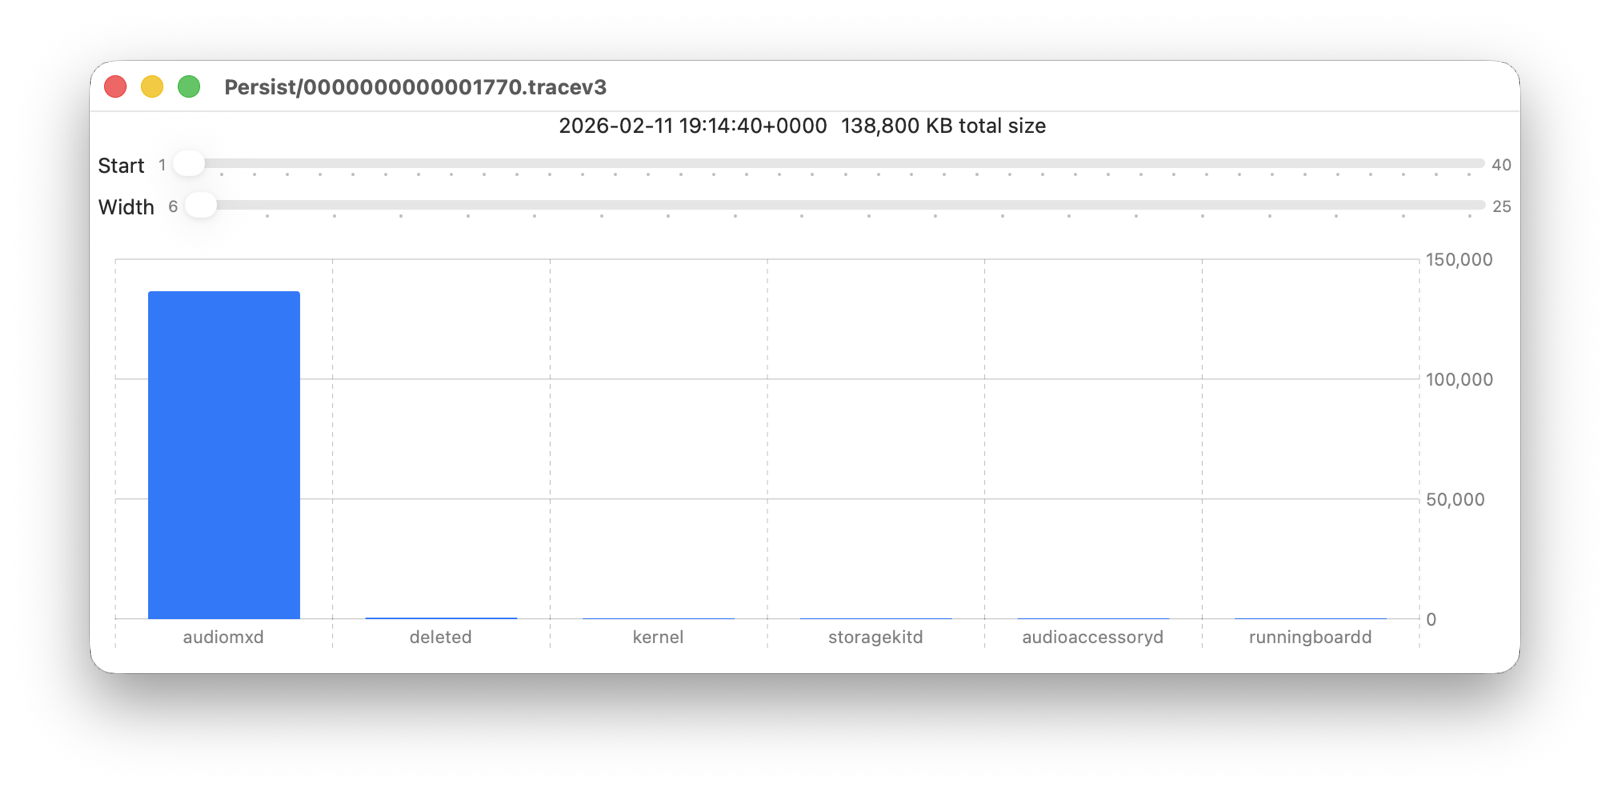
Analyse goes further, in telling you about the entries in each of the persist tracev3 files in the logarchive. It tells you the most common processes that wrote the entries in each of those files, allowing you to hone in on which are of most interest. If you want to extract that information for analysis in a spreadsheet, tick the CSV checkbox and it will be shown ready to import into your favourite spreadsheet.

Finally, to save the contents of the current window as a text file, click on the Save Text tool at the right.

I have now checked LogUI’s compatibility with the first developer beta of Tahoe, and found and fixed one obscure bug in the Logarchive Tool before this new build. LogUI should now be fully compatible with macOS 14.6 and later, including Tahoe. It’s available now from here: logui165
and from its Product Page.

Enjoy!

iPhone 系统最激进更新来了!iOS 26 变玻璃,iPad 迎「史诗级升级」,苹果 AI「明年再说」

By: 周奕旨
10 June 2025 at 05:49

一块玻璃,意外抢走了 WWDC 上苹果 AI 的风头。

去年,苹果在 WWDC 上高调推出 Apple Intelligence,重新定义果式 AI,但刚刚召开的 WWDC 却又回到了苹果最熟悉的舒适区,开始讲 UI,讲系统,讲体验。

整场发布会的核心,是一次 UI 层面的深度重构,也是自 iOS 7 以来跨度最大的一次设计体系升级。从 iPhone 到 Mac,从 iPad 到 Vision Pro,苹果统一了全家桶的界面语言和交互逻辑。

AI 也没有缺席,让用户在滑动、切换、点击之间,自然而然地用上它。而这,正是苹果最擅长的叙事方式。

用一块玻璃,重塑苹果全家桶的 UI

开眼在即

在这句宣传标语的上方,是取材于 Apple Park 拱门形状的宣传标识,揭示了 WWDC25 的头个重点——全新的 UI 设计:Solarium(阳光房)

如果用一个关键词来概括 Solarium,那就是在 WWDC25 中作为前半部分主要转场的玻璃。

更具体地说,是液态玻璃。

▲ iOS 26 系统截图

这种玻璃材质可以反射和折射周围环境,使屏幕上的内容更加聚焦,并为控件、导航、应用图标和小组件注入新的活力,Solarium UI 设计来自于 Vision Pro,这套 UI 整体视觉风格向 visionOS 靠拢,大量使用玻璃材质来承担界面中的层级分化任务。

显然,苹果仍将 Vision Pro 视为「明日产品」,并希望以其设计理念为基础,构建下一代用户界面的设计体系。

通过 WWDC 的演示,我们可以看见在滑动时,液态玻璃上也会照应出底部的页面变化,这是一种相当拟真的折射效果,苹果声称:

只要与其交互,新的 UI 都会实时响应并渲染效果。

Solarium 将会影响 iOS、iPadOS、macOS 等操作系统,覆盖各核心视觉元素,包括图标、菜单、应用、窗口样式及系统按钮,我们熟悉的控制中心也包括其中,其整体目标是通过简化交互逻辑,让用户更高效、更自然地使用设备。

值得一提的是,Solarium 也会延伸到 CarPlay 与 tvOS 上。

如果一切顺利的话,自 2013 年的 WWDC 发布的 iOS 7 延续至今的扁平化设计,将会第一次出现大改,这套全新的系统设计将在稍后随着各系统的测试版推出,并于下半年正式更新,来到每个人的面前。

随着全面覆盖的 Solarium UI 一起而来的,还有苹果在系统命名上的大一统:

从现在开始,苹果操作系统版本名称将发生以下变化:

  • iOS 19 变成 iOS 26
  • iPadOS 19 变为 iPadOS 26
  • macOS 16 变为 macOS 26
  • watchOS 12 变为 watchOS 26
  • visionOS 3 变为 visionOS 26

结合之前提到的 UI 设计大更新来看,这次命名的统一,是苹果软件品牌大升级中的重要一环,也是在呼应苹果在多系统整合方面所做出的努力。

iOS 26 稳中向好,也有一点新野心

在 iOS 26 上,最先抢眼的,毫无疑问是新的 Solarium UI 设计语言。

从锁屏界面开始,新的 UI 就开始填充你的视野——

无论是顶部的时间、底部的快捷小组件按钮还是中间的通知弹窗,在 iOS 26 中都换上了通透的液态玻璃质感,其中,时间显示甚至能根据壁纸主体智能延展,将「液态」的设计理念体现得淋漓尽致。

锁屏界面的另一个升级,则是基于重力感应的空间壁纸效果,这种效果不再是以往的平面移动,而是一种类似于空间视频的微妙立体感。

如果说锁屏只是开胃小菜,那 Solarium 真正大显身手的地方,是在相机。

借着新 UI 的东风,相机 app 进行了大刀阔斧的重塑,相机的主界面被极致简化,只留下了拍照与视频两个核心模式,其他功能和参数设置则分别通过滑动、轻扫等手势从液态玻璃般的边缘唤出。

过往版本中,相机功能日益臃肿、设置项藏在复杂二级菜单里的问题,终于有希望被 iOS 26 解决掉,你只需要按快门就行。

与相机 app 一起改变的,是 iOS 18 上保守诟病的相册。

新的相册将「图库」与「精选集」彻底分离,图库回归纯粹,你可以在这里不受干扰地浏览所有照片;而原先的相簿、回忆、人物分类等功能,则被悉数归纳进「精选集」中,当你需要的时候再切过去就好。

虽然相册没有回到我们熟悉的样子,但新的相册总比现在混在一起的要好。

值得一提的是,相册还新增了一项有趣的功能:它能将普通照片一键转化为「空间照片」,以轻微的幅度呈现立体动态,并与前文提到的空间壁纸联动。

相机和相册固然重要,但在 iPhone 的日常使用中,还有一些 app 也占据了一定的使用时间。

Solarium UI 进入了 Safari 浏览器中,在 iOS 26 上,Safari 可以全屏观看网页,而网址栏、分享、刷新等功能键,则会以液态玻璃的形态悬浮于屏幕底部,尽可能不影响网页的沉浸浏览体验,召之即来,挥之即去。

除了我们熟悉的终端,Solarium UI 还顺理成章地延伸至 CarPlay。

新的 CarPlay 的视觉语言将与更新了 Solarium UI 的 iPhone 或 iPad 等移动终端保持一致,此外,来电通知等信息会以更紧凑的弹窗呈现,保证导航信息依旧占据大部分屏幕空间,为驾驶安全保驾护航。

以上是 Solarium UI 带来的 iOS 26 的使用提升,当然,除了视觉效果带来的升级,iOS 26 还有更多使用体验上的新东西——比如游戏 app。

独立的游戏应用

近年来,苹果愈发痴迷于推出如无边记、手记等更加细分的系统应用程序,以满足全球超过十亿用户的多样化需求。

而在 WWDC25 上,苹果故技重施,推出了一款专为游戏玩家打造的独立应用程序——Games。

这个应用源自一个隐藏已久的功能:游戏中心。

相信不少人都注意到,每次打开游戏时,手机会弹出一个关于 Game Center 的提示,现在,这个功能终于脱离了原本的框架,成为一款独立应用。

用户可以通过这个应用启动已下载的游戏,查看游戏内的成就、排行榜等信息,也可以和自己的好友聊天。

同时游戏 app 也会承担一部分 App Store 的任务,推荐符合你喜好的游戏,或是告诉你某个游戏最近的更新内容是什么。

简单来说,它就像是手机上的 Steam。

同时,这款应用还将推出 Mac 版本,并能管理来自 App Store 以外平台的游戏。

推出这样一款独立的游戏应用程序,其实是顺理成章的事。

近年来,无论是 Mac 还是 iPhone,都在强调游戏能力,并成功移植了像《刺客信条》这样的 3A 大作,虽然画质、帧数等表现还有待提升,但也侧面反映了苹果对游戏市场的野心。

同时,iPhone 是全球用户最多的移动终端之一,其 App Store 的收入有大约三分之二来自游戏及游戏内交易,这样庞大体量的潜在游戏群体,也需要一个独立的游戏管理中心;

除此之外,苹果还收购了 RAC7 Games——后者作为独立的游戏工作室,曾开发了广受欢迎的 Apple Arcade 独占游戏《Sneaky Sasquatch》。

这笔收购进一步彰显了苹果对游戏市场的重视,这些独立工作室可以为苹果旗下设备提供更多优秀的独占游戏,提升 iPhone 和 Mac 在游戏市场的竞争力。

除了新的游戏 app,苹果还对部分软件进行了修修补补式的功能拓展。

电话

感谢苹果还没忘记手机最基本的功能。

现在,电话 app 中,个人收藏、最近通话列表以及语音信箱会显示在一起,在 Apple Intelligence 的帮助下,重要的内容也会提前显示。

另一个帮助用户消除来电干扰的通话筛选功能也将在 iOS 26 上线,这个功能以实时语音信箱为基础,iPhone 会静默陌生来电,来电者在语音信箱中给出名字与事由,由用户判断是否有必要接听。

而在大家的另外一个痛点上,iPhone 也有升级——通话保留助理。

在不可避免用电话联系客服时,我们常常遇到人工客服需要排队的情况,在 iOS 26 上,iPhone 会自动检测排队时出现的音乐,并让你继续使用手机,等到客服接通后,iPhone 会通过铃声提示你继续通话。

当然,使用这个功能的前提是你能绕过一重又一重的人工智能客服。

信息

iMessage 是苹果另一项原生的通讯功能,而在 iMessage 的群聊中,吃什么、去哪玩这类世纪难题终于迎来了终结者——投票功能。

你只需点击新增的投票按钮,输入问题和选项,群里的每个人都能参与投票,结果也会实时更新。

更有趣的是,Apple Intelligence 还会根据上下文智能建议投票选项,比如当你们在讨论晚餐时,它可能会自动为你生成披萨、汉堡或寿司等选项,同时为投票设计了实时动态,哪个选项最受青睐,一目了然。

对了,还有基于端侧的内容筛选功能,更精准地清除干扰短信,当然,重要的临时通知,比如快递取件码之类的还是会保留。

Apple Music

除了开头提到的动态专辑封面锁屏这个小而美的视觉更新,Apple Music 还有一些可以实打实提升使用体验的小功能。

在 iOS 26 的 Apple Music 中,新增的歌词翻译功能可以帮助用户理解他们喜欢的外语歌的含义,而另一个歌词发音功能,则可以帮助用户轻松跟唱歌曲——哪怕你从未学习过这个语言。

要我说,全民 K 歌还是太超前了。

你还可以将喜欢的音乐和专辑放在音乐界面的顶部,一键即达你的最爱。

地图

除了音乐,Apple 地图的更新也同样贴心。

你是否也曾想不起某家去过的宝藏小店?现在,iPhone 可以为你加密记录并回顾这些足迹,如果你想回顾某个去过的地方,却记不住地址,不妨去曾去过的地方中找找。

此外,地图会默默学习你的通勤习惯,当你准备出发上班或回家时,它早已为你规划好优选路线,并能提前告知路况变化,主动为你推荐替代方案,如果出现路况不佳之类的情况,iPhone 会主动提醒你切换备用路线,哪怕此时你还没来得及导航。

实时翻译

在 iPhone 上,语言不通的尴尬或许将成为历史。

在 iOS 26 中,Apple Intelligence 支持实时翻译功能,这个功能横跨电话、信息与 Facetime 三个通讯软件,当你收到外语信息时,系统会自动将其翻译成你的语言;

同样的,你发出的内容也会被实时翻译成对方的语言,让跨语言交流变得前所未有的顺畅。

实时翻译功能完全基于端侧,你的对话内容不会由此流通到任何未经允许的地方。

由 Apple Intelligence 驱动的实时翻译功能将通过 API 接口,向所有第三方开发者开放,开发者可以将实时翻译功能集成到任何通讯软件中。

采用 Solarium 的 iOS 26 支持 iPhone 11 及之后的机型升级,包括 iPhone SE 2,这意味着 iPhone Xr、Xs 以及 Xs Max 最高停留在 iOS 18。

需要注意的是,新系统中的部分基于 Apple Intelligence 的功能可能仍需 iPhone 15 Pro 及以后的机型才能使用。

搭载 Solarium UI 设计的各系统公测版更新时间为七月,而开发者预览版今晚更新,爱范儿将第一时间上手体验新的 UI 设计与新功能,敬请关注。

AI 没有高调登场,但在 iPhone 里已经无处不在

过去一年,苹果在海外推出了如 Genmoji、图乐园等 AI 功能,帮助用户更自由、有趣地表达内容,而外界最为关心的 AI Siri 将什么时候落地,在今年 WWDC 依旧并没有给出具体的日期。

用苹果的话来说,「我们想把它做好,还需要点时间,期待在来年分享更多信息。」

语言适配方面倒是有所进展,Apple 智能将在今年年底前支持另外八种语言:丹麦语、荷兰语、挪威语、葡萄牙语、瑞典语、土耳其语、繁体中文和越南语。

划重点,国行 iPhone,不在这批名单里。

另一个大动作,是苹果宣布推出 Foundation Models Framework。这是一项全新的 API,允许第三方开发者调用 Apple Intelligence 核心的大型语言模型(LLM),并将其集成到自家应用中。

开发者无需构建自己的 AI 模型,也不必依赖云端服务,就能在自己的 App 中调用一个功能强大、响应快速、且重视隐私保护的智能助手。

更重要的是,不怕断网,离线也能跑。

举个例子:你在野外露营,计划徒步旅行。只需事先下载好路线数据,在没有网络的环境下,也可以通过 Apple 智能描述自己的需求,比如「今天想走一条风景优美、不太累的路线」,系统便能基于你的情绪描述和当前环境,用本地模型智能推荐合适的路径。

去年上线的视觉智能功能,今年也升级了。现在,它可以直接分析你眼前的屏幕内容。

具体来说,在 Apple 智能的加持下,用户将能够跨 APP 搜索、提问,使用方式也非常简单,只需按下截图和按键组合,屏幕四角将显示功能,并进一步展开操作。

例如,看到一款球鞋,就能搜索类似图片,系统即可通过 Google 等平台找出相似商品。

不仅如此,视觉智能还可自动识别屏幕中的时间、日期与地点信息,主动建议用户添加至日历。无论你是在地图应用中发现活动地点,还是在社交软件中看到聚会邀约,它都能及时提供操作建议。

苹果表示,此功能全面兼容 iPhone 上的各类 App,并基于 Apple 智能的设备端处理技术开发,既提供个性化、上下文相关的智能辅助,又严格保障用户隐私。

今天,苹果还宣布计划开放 Xcode 的接口,支持开发者对接第三方大语言模型,开发者以后可以用自己更熟悉、更信任的大模型来写代码了。

简言之,不急于讲一个 AI 的宏大叙事,Apple 智能正在以缓慢且充满生机地融入你手里的 iPhone。

watchOS 26:变聪明,也更懂你了

watchOS 26 引入了液态玻璃设计,带来更加通透、动态的操作体验。

在健身这块,watchOS 26 推出了「Workout Buddy」健身搭子。

基于 Apple 智能,它能够根据用户的运动数据和历史记录,在陪你锻炼的过程中实时鼓励、即时反馈,堪称最懂你的腕上教练。

此外,智能叠放功能也能结合用户上下文和传感器数据,主动判断你的场景,并及时推送相关功能建议,如在常去的健身房提醒开启特定训练。

还有一些值得细节值得讲讲,watchOS 26 加入实时翻译功能,备忘录 App 也终于有了,随手记录、打勾清单都不在话下,换句话说,手表也可以是大脑的备份盘。

macOS Tahoe 26:换肤也换名,真·一眼惊艳

从美国加州的太浩湖(Lake Tahoe)汲取灵感,苹果 macOS 新版本命名为「macOS Tahoe」,这是继 2020 年 Big Sur 之后,macOS 又一次迎来大刀阔斧的界面升级。

选择这个名字,并非偶然。

「Lake Tahoe」不仅是加州著名的度假胜地,也是不少苹果员工的休闲和第二居所,因湖水清澈、倒映群山而闻名,这种视觉体验恰好契合今年 macOS 在界面上想带来的那种「一眼惊艳」。

visionOS 26:沉浸感拉满,游戏党狂喜

在视觉体验这一块,visionOS 26 直接拉满了。

全新的自影像拥有更自然的面部表现,包括头发、睫毛、肤质等细节全面提升,支持侧面视角、更多定制选项(如眼镜样式),创建流程更便捷。

并且,visionOS 26 原生支持 180°、360° 和广角视频内容,带来更身临其境的观看体验。游戏党别走,visionOS 现在支持 PlayStation VR2 Sense 手柄,6DoF 动作追踪、触觉反馈也都安排上了。

iPados 26:真不是大号 iPhone 了

iPad,开始活成了 Mac 的样子。

同样地,iPadOS 26 也用上了液态玻璃设计,为锁屏、控制中心、主屏幕等系统界面带来通透且动感的视觉升级,主屏也能更自由定制,图标颜色、风格都能玩,浅色/深色主题你说了算。

全新窗口管理系统支持自由缩放、拖拽、平铺、等,提供桌面级别的多任务体验。

并且,iPadOS 26 引入全新菜单栏,支持下拉操作与搜索功能,开发者还可以定制自己的菜单,生产力工具这次是真升级了。

对于用户来说,今年的 WWDC 大会没有惊艳的 One more Thing,也没有 AI 大张旗鼓的宣传,连带着整场发布会都稍显克制。

但转头来看,其实脱离了 AI 浪潮以后,苹果将目光放回了原本 WWDC 的节奏上,把注意力重归设计、交互与系统本身保有的软件。

回到 WWDC25 的开头,在介绍 Solarium UI 的时候,苹果为其贴上了一个颇有重量的标签:

Solarium 是我们设计的一个令人兴奋和美丽的新篇章,为我们产品的下一个时代以及您每天如何与他们互动奠定了基础。

联系之前的爆料,我们可以大胆推测——Solarium UI 设计就是为苹果未来发布的硬件产品奠定基础,其中就包括 2027 年推出的「二十周年」纪念款 iPhone——

这款新机型的设计也同样主打「玻璃」:机身采用一体成型的玻璃设计,边框将非常狭窄,并且也没有「刘海」或者「灵动岛」,苹果内部将其称为「玻璃翼(Glasswing)」,这是一种透明翅膀的蝴蝶。

苹果不想让 UI 只是浮在玻璃上的图层,而是真正把玻璃也变成界面的一部分:能透光、有深度、会动,会「活」。

在硬件层面做到像素级的动画抗锯齿,让灵动岛、多任务手势这些交互逻辑自然落地,在 Vision Pro 上同时调度双芯片、双系统,实现 UI 材质的实时动态合成,这可以说是苹果一直以来的拿手好戏。

从某种意义上来说,这也算是一种 Only Apple Can Do。

作者:周奕旨、莫崇宇

让我有个美满旅程

#欢迎关注爱范儿官方微信公众号:爱范儿(微信号:ifanr),更多精彩内容第一时间为您奉上。

爱范儿 | 原文链接 · 查看评论 · 新浪微博


LogUI build 60 reads iOS, iPadOS, macOS and other logarchives

By: hoakley
9 June 2025 at 14:30

Until now, LogUI has only been able to access the active log of your Mac, by reading it directly. There are occasions when you can’t do that, or want to preserve the log for future reference. You also can’t browse the log directly on any of Apple’s devices. In these cases, and others, the best solution is to make a logarchive, and browse that instead. I’m delighted to provide an update to LogUI that can browse logarchives, including those created in iOS, iPadOS, and on Apple’s other devices.

What is a logarchive?

A logarchive is an undocumented package containing copies of all the files from the active log at the moment the logarchive was created. They can be opened and browsed by Console, Consolation 3, Ulbow, the log command tool, and now by LogUI. Because they contain all the files that make up the log, they can be large, and typically range in size from about 300 MB to over 1 GB. All the files containing log entries are stored in their original binary tracev3 format, proprietary to Apple, and again undocumented, although that format has been reversed in the past.

Create a logarchive

The easiest way to create a logarchive is to run a sysdiagnose, and that’s the standard way for saving a logarchive on one of Apple’s devices. Methods vary by device, and include:

  • On a Mac, use the System Diagnostics… option in Activity Monitor’s Action tool, or press the Shift, Command, Control, Option and . keys at the same time, or run sudo sysdiagnose -f ~/Documents to save it to your Documents folder.
  • On an iPhone or iPad, press and hold both volume buttons and the side or top button at the same time, for about 2 seconds. This combination may trigger other features, though. The sysdiagnose file will be made available in Settings > Privacy & Security > Analytics & Improvements > Analytics Data, from where you can transfer it to your Mac.

Unpack the .tar.gz archive resulting from that, and you’ll find a system_logs.logarchive inside it.

On a Mac, you can instead use the log collect command to create a logarchive directly. For example,
log collect --output ~/Documents/my.logarchive --last 5m
collects the last 5 minutes of log in the specified logarchive package. macOS security will block you from trying to save that logarchive on an external volume, though.

My free log browser Ulbow uses another method for assembling logarchives, and the next build of LogUI will incorporate that and other tools for working with logarchives.

Browse a logarchive in LogUI

This new build of LogUI has a seventh tool, to Use Logarchive. Click on that and you’ll be prompted to select the logarchive to open and browse.

Because the dates and times used in the logarchive will be different from current clock time, the LogUI window displays red warning text just to the left of the Start time. Set the date and time to a period within the scope of that logarchive, and use the Get Log tool as normal.

The log excerpt shown in the screenshot above is taken from the kernel boot sequence of my iPhone 15 Pro, to demonstrate how this all works.

If you want to return that window to browsing the active log, click on the Use Logarchive tool again, but this time cancel the selection. Other windows will of course continue to browse the active log unless you set them to use a logarchive as well.

Coming soon

Although browsing saved log entries in a logarchive is exactly the same as those of the active log, dates and times can be a pain. If you want to check when log files in a logarchive were written, use the Finder’s contextual menu to show their contents, scroll to the foot of the folders inside, select the Persist folder and check the file creation dates there.

This is made even easier in the forthcoming new build of LogUI, which features a Logarchive Tool to help you navigate logarchives, and learn which date and time ranges are appropriate.

LogUI 1.0 build 60 is now available from here: logui160
and from its Product Page.

I’ll be along with a new build in a few days, once I have tested and documented its Logarchive Tool. In the meantime, I hope you’ll find LogUI useful for studying the first beta-releases of Apple’s new operating systems.

LogUI build 58 reads and writes JSON, and more

By: hoakley
5 June 2025 at 14:30

Until now, LogUI has largely been an interactive log browser, and only able to export log excerpts in Rich Text format. This new build adds three tools to greatly increase its usefulness, as it can now write log excerpts in JSON format, open saved files, and filter out unwanted log entries. To give a simple example, this screenshot shows a log extract that has been reduced to entries made only by LaunchServices, converted from JSON to CSV, and imported into Numbers.

There are three new tools in LogUI’s toolbar.

From the left:

  • Get Log fetches and displays log entries specified by the current log settings, as before.
  • Read JSON opens a dialog for you select a LogUI JSON file, and loads its log entries into the window, replacing its current contents.
  • Gloss opens the Gloss window with message text from selected log entries, enabling you to use Writing Tools and other aids, as before.
  • Reduce applies the current search to current log entries. This removes all entries that are excluded by that search, so reducing the number of log entries. If you want to keep a copy of the unreduced log, save it as a JSON file before reduction.
  • Save JSON opens a dialog for you to save the current log records to a new LogUI JSON file. This has the type co.eclecticlight.loguilog, and the extension .logui, and can be used as a regular JSON export with other apps capable of importing JSON format.
  • Save RTF saves the current log excerpt as a Rich Text Format file, using the same colour conventions, as before.

You can now filter log entries in several ways, one at a time or all together:

  • You can apply a predicate to determine which log entries are fetched in the first place, perhaps limiting them to one or two subsystems.
  • You can search for subsystems, sender or process names, or contents of messages in the search box.
  • When you have filtered the displayed log entries to those that you want, you can reduce the excerpt to include just those, and save that excerpt.
  • You can then open the saved, reduced excerpt and use further searches to navigate and analyse those entries.

As we’ve recently been discussing different types of Spotlight search, I should perhaps explain that LogUI’s search isn’t word-based, simply finds matching sequences of characters, and doesn’t support regex or wild card search. If you search for the characters arb, then it will find them in the words nearby and arbitrary, but not in arabesque.

There are two current limitations with these new JSON documents. If you double-click one, LogUI should launch automatically and will then open a new window, but won’t load that document into the window, as that part of its internal wiring isn’t yet complete. The same also happens if you try dropping a document onto the app. I did hope to have drag and drop working in this release, but the resulting code proved too complex for the Swift compiler in Xcode to negotiate, so that will also wait for a future build.

LogUI 1.0 build 58 is now available from here: logui158
and from its Product Page.

This is likely to be the last update for a couple of weeks, as I expect I’ll be immersed in WWDC and its fallout for much of the next fortnight. My outstanding tasks are:

  • complete the predicate editor in Settings;
  • add support for opening documents from the Finder;
  • add drag and drop support.

I’m also thinking about additional search/filter support, and whether a more compact binary document format might be a worthwhile alternative for large log excerpts.

As ever, I value your comments and suggestions.

Last Week on My Mac: Successful search strategies

By: hoakley
1 June 2025 at 15:00

How everything grows over time. Twenty years ago a hard disk of 100 GB was often ample, now twenty times that can be insufficient, and some have even larger media libraries. Finding files from among tens of thousands used to be straightforward, but now we’re working with millions we’re often struggling. Last week’s discussions of Spotlight search and its alternatives highlighted how important search strategies have become.

Strategy

Perhaps the most common strategy we use to search quickly and effectively is to apply a series of properties or attributes narrowing from the general to the specific: a dog, a small dog, a small grey-and-white dog, a small grey-and-white Havanese dog. In just a few adjectives we have narrowed the field to a description applying to a small number of domestic pets.

This strategy has two essential requirements: the target of your search must be included in the list of items being searched, and each of the attributes or criteria you apply in succession must include the search target. The first is obvious and critical to Spotlight’s success, and the second is the basis of how attributes are chosen. If the dog’s colour had been specified as red, then that search would have failed.

One of many skills in successful searching is judging how exclusive each criterion should be, and being more inclusive to ensure none of the criteria might inadvertently exclude the target.

Although you can combine attributes in this way when searching using the general Spotlight search window accessed through the menu bar, that’s a global search including websites and everything searchable from Wikipedia to Photos albums and Messages. When looking for a file, searching in the Finder immediately narrows the scope, and saves you wading through many irrelevant results. You can then add a search bar for each criterion, perhaps specifying that you’re looking for an image in your ~/Documents folder, each time reducing the number of hits until your choice becomes sufficiently limited.

Incremental search

Spotlight offers another technique that has become popular in search engines as their performance has improved, in what’s known as live or incremental search. As you type letters into one of its search boxes, it shows results as it gets them. This isn’t much use when entering common combinations of letters, but as they become more specific this can save time and accommodate any uncertainty you might have over spelling or the rest of the word. I use this frequently in MarsEdit when looking for old articles I have written: for example, typing wrestl will find wrestler, wrestlers, wrestling, wrestled, etc.

This works well with most languages including English, where roots and meanings are concentrated in the first parts of words, and declension and conjugation are usually found in their endings. Not all languages work like that, though, and this may not perform as well in Georgian or even German due to their morphology.

Predicates

For those who prefer to use the command line, mdfind can use predicates to express combinations of attributes, but those aren’t readily used in the same incremental way to narrow results down interactively. Another situation where predicates often come into play is when searching log entries and using the log show command, and that brings me on to LogUI, my other concern last week.

Searching the log

Let’s say you want to discover all the information RunningBoard gathers about an app, something you know is written in a log entry by the com.apple.runningboard subsystem shortly after that app starts its launch sequence. While you could search for all entries for that subsystem in the minute or so around the time you launched the app, there are likely to be thousands of hits.

To narrow down that search you have several options, including:

  • launch the app at a known time, and set that as the Start time, with a Period of just a couple of seconds;
  • set a one-off predicate to subsystem == "com.apple.launchservices" OR subsystem == "com.apple.runningboard";
  • search subsystems for com.apple.launchservices to identify the time that LaunchServices announces the app will be launched through RunningBoard;
  • search messages for constructed job description, RunningBoard’s log entry giving the details you’re looking for.

Those are ordered in increasing specificity, reducing numbers of hits, and increasing requirement for prior knowledge. That’s a general association, in that the more prior knowledge you have, the more specific you can make your criteria, and the fewer irrelevant hits you will see. As with Spotlight search, the more of these criteria you apply, the greater your chance of success, provided they all match the entry you’re looking for.

LogUI

To make LogUI more amenable to incremental search strategies, two additional features are needed. Instead of only exporting whole log extracts to Rich Text, the app needs to save and read formatted extracts. It also needs the ability to eliminate entries that don’t meet search criteria. Together those will enable use of a predicate to save an extract of reduced size, then application of search criteria, maybe saving an even smaller extract.

One way to combine multiple searches is to use multiple search bars, in a similar way to the Finder’s Find window. However, that tends to become overcomplicated, and I suspect is relatively little-used. If you do need a series of search criteria, then you also need different ways of combining them, including OR as well as AND, and that becomes a GUI predicate editor. I have yet to see any successful GUI predicate editor.

Next week, in the days prior to WWDC, I’m going to be focussing on search strategies for Spotlight, before turning to LogUI to implement these changes. This is an ideal time to let me know what you’d like to see, and how LogUI can support more successful search.

Can you trust times shown in the log?

By: hoakley
30 May 2025 at 14:30

Next to the order of entries in the log, their date and time stamps are one of the most important pieces of information they contain. In some cases, such as when you’re using the log to estimate performance, their accuracy is vital. This article reports the results from tests to validate the times given in log records provided by the log show command, and in my free log browsers LogUI and Ulbow.

Clock date and time

Dates and times given in log extracts invariably match those of the Mac’s system clock, the only catch here being adjustments for time zone and DST. The latter can become confusing if you look at the log when DST is changed, or from a different time zone. To cope with that you can use the --timezone local option in log show to express all times with uniform adjustment. Ulbow doesn’t use that, but LogUI does now synchronise all time and date stamps to the current time zone and DST.

Time differences

The log is an excellent tool for measuring time and performance, either using regular entries or Signposts that are intended for the purpose. Writing an entry into the log incurs minimal overhead, and is simple to perform from any code or script. If your favourite scripting language doesn’t give direct access to writing entries, then you can use my free command tool blowhole to do so. If you want to assess processes in macOS, then it’s usually straightforward to identify appropriate milestones that mark events and use those to calculate the period. These all depend on the times reported in log entries being sufficiently accurate.

Gold standard

Since Mac OS X, every Mac has had a high-precision internal clock within it (prior to that Time Manager could resolve times down to the microsecond but no further). This increments monotonically in ‘ticks’, an unsigned 64-bit integer, starting from an arbitrary value, and is referred to as Mach Absolute Time (MAT).

Intel Macs increment their ‘tick’ count once every nanosecond, so the difference between two readings of the clock represents the time interval in nanoseconds. Life isn’t as simple with Apple silicon Macs, as they tick three times every 125 nanoseconds, or once every 41.67 nanoseconds. Apple’s latest documentation on MAT, its units and use, comes in a Technical Q&A dated 2005.

Once correctly converted into nanoseconds, MAT is the closest available measurement of time to a gold standard.

I suspect that log entries are originally given a raw MAT as their time, and that can be made available using the log show command, or in Ulbow, as that uses log show to obtain log entries. LogUI reads the log directly, through the OSLog API in macOS, which currently doesn’t provide MAT values, instead giving a lower resolution Date value.

This validation therefore compares time intervals given by Ulbow from log entry timestamps, and those given in LogUI, against MAT intervals obtained in Ulbow. To increase the challenge, log entries used are from blowhole writing 25 log entries as fast as it can, a worst case scenario as that writes 2-3 entries each microsecond.

Comparisons

Log extracts obtained using log show in Ulbow and those estimated by LogUI were compared, and their timestamps were found to be identical.

On an Apple silicon Mac (M4 Pro), entries written by blowhole had raw MAT values that recorded intervals of 9 or 10 ticks between them, after the first three were made 73 and 15 ticks apart. From the third of the series of 25 log entries there was a strong linear relationship between recorded MAT in nanoseconds elapsed and loop number, as shown in the chart below.

The gradient of the regressed line shows that blowhole‘s log entries occurred at intervals of just under 405 nanoseconds.

Because LogUI (and regular timestamps in log show and Ulbow) only resolve to microseconds, the matching plot for LogUI’s times against loop number is stepped.

The gradient of this regression line is 0.4, indicating that the intervals occurred at 400 nanoseconds, almost identical to that found for the MAT.

Plotting times measured by LogUI (which also represents those for Ulbow and log show, as they’re identical) against that of MAT shows a good linear relationship with a gradient of just under 1.009, indicating that timestamps in log show, Ulbow and LogUI are accurate and reliable estimates of MAT.

Differences between pairs of time estimates obtained from MAT and LogUI ranged from -83 to +792 nanoseconds, with a median of +370 and quartiles of +83 to +583 nanoseconds.

Conclusion

  • Times given for log entries in LogUI, Ulbow and log show are reliable estimates of MAT to within +0.8 microseconds.
  • When nanosecond resolution is needed, the machTimestamp field from log show or Ulbow should be used, and converted into nanoseconds.

LogUI build 52 handles time zones and microseconds better

By: hoakley
27 May 2025 at 14:30

Last week’s deep dive into the precision of times in the log concluded that, with the data currently available, the highest they can aspire to are microseconds, 10^-6 seconds, and not the nanoseconds given in the last build of LogUI. The aims of this new build are to deliver correctly rounded microsecond time resolution, and to adopt consistency in time zones and DST corrections.

I described in detail yesterday how I arrived at conversion of log entry dates to yield the time in microseconds. Here I’ll consider how to treat time zones correctly.

When you enter a start time in LogUI, this is assumed to be given in the local time set on your Mac, including both its time zone and any DST correction. LogUI already takes those into account, and performs any necessary adjustments.

Now that I have completely overhauled how LogUI converts the date stored for each log entry, I have changed behaviour in comparison with the default option of the log show command, and Ulbow that accepts its timestamps without question. The best way to see that is to observe log entries when the Mac’s time zone is changed.

Ulbow, and by default the log show command, uses date and time stamps adjusted for the time zone and DST setting at the time each entry is written to the log. You should therefore be prepared to see abrupt discontinuities in its timestamps. This condensed sequence of log entries from Ulbow shows what happens when you change time zone from New York to the UK during DST:
10:50:00.729672-0400 com.apple.Settings /AppleInternal/Library/BuildRoots/ … obfuscated() obfuscate output: …
10:50:00.729687-0400 com.apple.xpc.alarm Setting timer for "com.apple. …
15:50:00.730675+0100 === system wallclock time adjusted
15:50:00.730733+0100 com.apple.mobiletimer.logging … rescheduling 0 alarms
15:50:00.730754+0100 com.apple.xpc.alarm Setting timer for "com.apple.mdmclient.timer.ManualCertRenewalCheck" in 86080 seconds.

Instead, LogUI adjusts all log entries to the current time zone for consistency in reading:
15:50:00.729672+0100 com.apple.Settings /AppleInternal/Library/BuildRoots/ … obfuscated() obfuscate output: …
15:50:00.729687+0100 com.apple.xpc.alarm Setting timer for "com.apple. …
15:50:00.730675+0100 Boundary === system wallclock time adjusted
15:50:00.730733+0100 com.apple.mobiletimer.logging … rescheduling 0 alarms
15:50:00.730754+0100 com.apple.xpc.alarm Setting timer for "com.apple.mdmclient.timer.ManualCertRenewalCheck" in 86080 seconds.

If you’re using log show, you can add the --timezone local option to adopt the same behaviour.

This also solves the dilemma when you’re browsing the log through a time zone change, for example when the clock has gone forward to DST, or the reverse. In LogUI the rule is simple: enter the current time, and all log entries will be adjusted to and shown in that single time zone.

I’ve previously explained some of the confusion that can arise with DST changes, in the autumn/fall, and again in the Spring. Hopefully LogUI won’t lead to any confusion now.

LogUI 1.0 build 52 is now available from here: logui152
and from its Product Page.

Enjoy!

Never work with children, animals or time: nailing the nanosecond

By: hoakley
26 May 2025 at 14:30

Quite unintentionally, last week became a saga about time, and a good demonstration of how you should do your utmost to avoid working with it. This all started with an irksome problem in my new log browser LogUI.

LogUI departs from my previous log browsers in accessing log entries through the macOS API added in Catalina. When it first arrived, I found it opaque, and its documentation too incomplete to support coding a competitive browser at that time. Since then I have revisited this on several occasions, and each time retreated to using the log show command to obtain log extracts. As far as time is concerned, that presents me with two alternatives: a formatted string containing a date and timestamp down to the microsecond (10^-6 second), and a Mach timestamp giving the ‘ticks’ from an arbitrary start time.

Although the latter can only give relative time, the timestamp provided suffices for most purposes, and comes already formatted as
2025-05-25 07:51:05.200099+0100
for example.

Milliseconds

When you use the macOS API, date and time don’t come formatted, but are supplied as a Date, an opaque structure that can be formatted using a DateFormatter
let dateFormatter = DateFormatter()
dateFormatter.dateFormat = "yyyy-MM-dd HH:mm:ss.SSSZ"
let dateString = dateFormatter.string(from: date)

to provide
2025-05-24 13:46:12.683+0100

That only gives time down to the millisecond (10^-3 second), which is inadequate for many purposes. But changing the formatting string to "yyyy-MM-dd HH:mm:ss.SSSSSSZ"
just returns
2025-05-24 13:46:12.683000+0100
with zeroed microseconds. As I can’t find any documentation that states the expected time resolution of Dates, it’s unclear whether this is a bug or feature, but either way a different approach is needed to resolve time beyond milliseconds.

Nanoseconds

The only method I can see to recover higher precision in the macOS API is using DateComponents to provide nanoseconds (10^-9 second).
Calendar.current.component(.nanosecond, from: date)
returns an integer ready to format into a string using
nanosecStr = String(format: "%09d", nanoSeconds)
to give all nine digits.

Inserting that into a formatted date is a quick and simple way to construct what we want,
2025-05-24 13:46:12.683746842+0100
down to the nanosecond.

It’s only when you come to examine more closely whether the numbers returned as nanoseconds match changes seen in Mach timestamp, that you realise they’re a fiction, and what’s given as nanoseconds is in fact microseconds with numerical decoration.

Microseconds

The answer then is to round what’s given as nanoseconds to the nearest microsecond, which then matches what’s shown in Mach timestamps
let nanoSeconds = Int((Double(Calendar.current.component(.nanosecond, from: date))/1000.0).rounded())
and that can be converted into a string using
nanosecStr = String(format: "%06d", nanoSeconds)

Rather than manually format the rest of the date and timestamp, you can splice microseconds into the @ position of the format string
"yyyy-MM-dd HH:mm:ss.@Z"
turning
2025-05-24 13:46:12.@+0100
into
2025-05-24 13:46:12.683747+0100

Unfortunately, that’s too simple. If you test that method using times, you’ll discover disconcerting anomalies arising from the fact that seconds and microseconds are rounded differently. This is reflected in a sequence such as
2025-05-24 13:46:12.994142+0100
2025-05-24 13:46:13.999865+0100
2025-05-24 13:46:13.000183+0100

where the second rounds up to the next second even though the microseconds component hasn’t yet rounded up. The only way to address that is to format all the individual components in the string using DateComponents. And that leaves a further problem: how to get the time zone in standard format like +0100?

Time zones

Current time zone is available as an opaque TimeZone structure, obtained as
TimeZone.current
Note that this doesn’t need to be obtained individually for each Date, as its components are obtained using current Calendar settings, not those at the time the Date was set in that log entry. This should have the beneficial side-effect of unifying times to the same time zone and DST setting.

But that doesn’t offer it in a format like +0100, so that has to be calculated and formatted as
let timeZone = (TimeZone.current.secondsFromGMT())/36
let tzStr = String(format: "%+05d", timeZone)

Solution

The complete solution is thus:
let timeZone = (TimeZone.current.secondsFromGMT())/36
let tzStr = String(format: "%+05d", timeZone)
let dateComponents = Calendar.current.dateComponents([.year, .month, .day, .hour, .minute, .second, .nanosecond, from: date)
let yearStr = String(format: "%04d", dateComponents.year ?? 0)
let monthStr = String(format: "%02d", dateComponents.month ?? 0)
let dayStr = String(format: "%02d", dateComponents.day ?? 0)
let hourStr = String(format: "%02d", dateComponents.hour ?? 0)
let minuteStr = String(format: "%02d", dateComponents.minute ?? 0)
let secondStr = String(format: "%02d", dateComponents.second ?? 0)
let nanoSeconds = Int((Double(dateComponents.nanosecond ?? 0)/1000.0).rounded())
let nanosecStr = String(format: "%06d", nanoSeconds)

then concatenate those together with punctuation marks as separators to deliver the string
2025-05-24 13:46:12.683746+0100

If you’re coding in Swift, you might instead consider using Date.FormatStyle, although its documentation only refers to handling milliseconds, so I suspect that might turn out to be another wild goose chase.

If you know of a better way of handling this explicitly, don’t hesitate to let my code therapist know.

A Dance to the Music of Time in Intel and Apple silicon logs

By: hoakley
20 May 2025 at 14:30

Now we’ve got LogUI to give us the times of log entries down to the nearest nanosecond, it’s time to see whether that’s any improvement over other tools. Given that Mach Absolute Time resolves to nanoseconds (10^-9 seconds) in Intel Macs, and just under 42 nanoseconds in Apple silicon Macs, can we now resolve times of events better than when using microseconds (10^-6 seconds)?

Methods

To test this out, I used my command tool blowhole that can run a tight loop writing entries in the log as fast as possible. To do this, it uses the code
for index in 1...number {
os_log("%d", log: Blowhole.gen_log, type: type, index)
}

I then wrote loops of 20 to the log of an iMac Pro (Intel Xeon W CPU), M3 Pro and M4 Pro, and extracted the resulting log entries using LogUI with its new nanosecond times.

Results

Plotting these times against loop number resulted in unexpected patterns.

In this graph, results from the iMac Pro are shown in black, those from the M3 Pro in blue, and the M4 Pro in red. Although less well-ordered in the first to fourth loops, from the fifth loop onwards there were linear relationships between time of log entries and loop number. Linear regression equations are shown in the legend, and demonstrate:

  • on the iMac Pro each loop takes 1.0 x 10^-6 seconds, i.e. 1 μs;
  • on the M3 Pro each loop takes 5.6 x 10^-7 seconds, i.e. 0.6 μs;
  • on the M4 Pro each loop takes 4.6 x 10^-7 seconds, i.e. 0.5 μs.

which perhaps isn’t surprising.

However, the patterns of individual points are quite different. Apart from loops 4 and 5, subsequent loops on the iMac Pro are evenly spaced in time. Those on the Apple silicon chips are grouped in pairs or, for loops 14-16 on the M4 Pro, in a triplet, where two or three loops are assigned the same time in the log.

Looking at time differences, a clear pattern emerges, that log times are incremented in steps of 954 ns. For the iMac Pro, each loop occurs one step later, while for the M3 Pro and M4 Pro steps between pairs and triplets are also 954 ns. In a few cases, the step difference is slightly greater at around 1192 ns instead of 954 ns. Apple silicon chips are faster on average because each step includes two or more loops, while the iMac Pro only manages one loop per step.

Explanation

If log entry times had been given in microseconds rather than nanoseconds, the same patterns would have been seen. But without the additional precision in their times, it wouldn’t have been clear that multiple log entries were being written with identical times, down to the nanosecond.

One likely explanation is that macOS only writes log entries approximately every microsecond, and the entry time recorded for each is that of that writing. Writing log entries must occur asynchronously for the M3 Pro and M4 Pro to be able to send pairs or triplets to be written, rather than having to wait for each writing process to complete.

Thus, the time resolution of log entries is approximately 1 μs, or 954 or 1192 ns to be more precise, and that’s the same regardless of whether macOS is running on a recent Intel Mac or the latest Apple silicon chips. Although a time resolution of 1 μs is sufficient for general purposes, if you want to dig deeper, as I have done here, access to the finer resolution provided in nanosecond times is essential.

Conclusions

  • Times written in log entries are incremented every 954 or 1192 ns on both Intel and Apple silicon.
  • Faster Apple silicon chips can write more than one entry in the same time increment.
  • Although expressing the time of log entries in microseconds is sufficient for general purposes, using nanoseconds can confirm which have occurred simultaneously.

The Music of Time

So what is a Dance to the Music of Time? It’s one of Nicolas Poussin’s most brilliant paintings, that inspired a series of twelve novels written by Anthony Powell. While I wouldn’t attempt to summarise those, here’s the painting to enjoy.

poussindancemusictime
Nicolas Poussin (1594–1665), A Dance to the Music of Time (c 1634-6), oil on canvas, 82.5 × 104 cm, The Wallace Collection, London. Wikimedia Commons.

Poussin’s Dance to the Music of Time (c 1634-6) shows four young people dancing, who are currently believed to be Poverty (male at the back, facing away), Labour (closest to Time and looking at him), Wealth (in golden skirt and sandals, also looking at Time), and Pleasure (blue and red clothes) who fixes the viewer with a very knowing smile. Opposite Pleasure is a small herm of Janus, whose two faces look to the past and the future. Father Time at the right is playing his lyre to provide the music, and an infant seated by him holds a sandglass, to measure time periods. Above them in the heavens, Aurora (goddess of the dawn) precedes Apollo’s sun chariot, on which the large ring represents the Zodiac, thus the passage of the months. Behind the chariot are the Horai, the four seasons of the year.

Resolve time better in LogUI build 48

By: hoakley
19 May 2025 at 14:30

Macs keep time exceedingly precisely, although there are important differences here between Intel and Apple silicon models. Their most precise record of time is given in Mach Absolute Time (MAT), the number of ‘ticks’ since an arbitrary start. In Intel Macs, each tick occurs every nanosecond (10^-9 second), providing high resolution, but ticks are less frequent in Apple silicon chips, occurring once every 41.666… nanoseconds instead.

You can test this on an Apple silicon Mac using my free utility Mints, which has a convenient button to display Mach timebase information. Run Mints in native mode, the default as it’s a Universal App, and it reports the Arm values; force it to launch as an app translated by Rosetta, and it will give the same timebase as an Intel Mac.

time01

time02

Although entries in the log are recorded in MAT’s high resolution, most methods of accessing log entries lose much of that precision. The datestamps provided by the log show command, for example, round time to the nearest microsecond (10^-6 second), although it’s capable of delivering a field in MAT’s nanoseconds. The bundled Console app is similar, but lacks any option to display MAT. My Ulbow app can display both datestamps with microseconds and MAT, but until now LogUI has been limited to displaying only time in milliseconds (10^-3 second).

To put these into context, in each microsecond the P core in the CPU of an M4 chip can complete execution of over 1,000 instructions, and in a millisecond that becomes more than a million instructions.

LogUI has been constrained by the formatted output available using Date and DateFormatter in the macOS API, which appear to be incapable of generating time any more precisely than milliseconds. After several earlier unsuccessful attempts, I’m now able to obtain time in nanoseconds, using Calendar and DateComponents in the API. For example, to obtain a formatted string containing the nanosecond component of a Date variable named date:
let nanoSeconds = Calendar.current.component(.nanosecond, from: date)
let nsTime = String(format: "%09d", nanoSeconds)

The string nsTime can then be spliced into a formatted date string.

I have incorporated this into a new build of LogUI, which also has extended information about the log display in its Help book. LogUI 1.0 build 48 is now available from here: logui148
and from its Product Page.

Tomorrow I’ll consider whether these more precise times are of use, and what we can learn from them.

Use Writing Tools to understand the log in LogUI build 46

By: hoakley
12 May 2025 at 14:30

I’ll be the first to admit that I’m sceptical of AI, and seldom use ChatGPT or Writing Tools. One of the conditions imposed by the magazines that I write for is that none of my contributions use AI in any way, either to research topics or to manipulate the text. Besides, I’d far rather all the mistakes I make are mine, and not introduced by AI. But I am impressed by Writing Tools, and think you might find them useful when trying to extract information from and understand the log, when using LogUI.

I’m therefore delighted to announce a new build of LogUI that gives access to summarisation features in Writing Tools to analyse and clarify log entries.

Most obviously, this build reworks the interface by promoting the button commands to its toolbar. From the left, these are:

  • Get log extract (circular arrows).
  • Gloss (magnifying glass on document page).
  • Save as Rich Text (downward arrow and box).

Following those is the popup menu to select the field to be used for search, and at the right end the Search box itself.

A more subtle change is aimed at making it less confusing when using multiple windows and search criteria on log extracts from the same time. The title shown in each window now appends any search term in use. That’s shown in the window, and in the Window menu, but isn’t included in the default file name if you save the extract in Rich Text.

Currently, LogUI supports two ways of moving log extracts to other apps: you can save the whole extract as a formatted Rich Text file, or copy the most important fields in selected entries as text. Build 46 adds a third as the bridge to Writing Tools, in what I term a gloss. This is generally used for words added to a text, either in between its lines or in the margin, that explain words in the main body of that text, and can be gathered together in a glossary. In LogUI this functions as a special pasteboard and plain text editor, the Gloss window.

The message field of some log entries is very large, containing a lot of information some of which may be of importance. The example I use here gives the registration details of an app being launched through RunningBoard. To copy those into a Gloss, select that log entry and click on the Gloss button in the toolbar. The contents of the selected message field(s) are then displayed in the Gloss window, a basic text editor, where you can manually format them if you wish, copy and paste the contents into a text document in another app. This works fully on all Macs running macOS 14.6 or later.

As this window contains a SwiftUI TextEditor view, you can also use Writing Tools on any selection you make within its text (Apple silicon Macs only). Select all using Command-A, hover the pointer over the selected text and you’ll see the Writing Tools blue button appear to the left of the window. Click on that, or use the contextual menu on the selected text, and you can now apply any of those Writing Tools to the contents.

If you try to use a Writing Tool that can’t cope with the text contents, you’ll see the error Writing Tools Unavailable.

In that case, open the contextual menu and try a different tool that can cope. Some log messages don’t contain much English, and in those cases Writing Tools might try another language such as German before reporting that the language isn’t recognised or supported.

Text in that Gloss window persists, and is saved into LogUI’s preferences. Only one Gloss window is available, and it contains the text from those entries selected the last time you clicked on the Gloss button. When you do that, the new gloss replaces the old. If you want to save the previous gloss, copy and paste it before clicking on the Gloss button.

Writing Tools can’t interpret log entries or diagnose problems from the log, but its summaries can make complex lists more comprehensible, and sometimes provide additional information that can be helpful. Always check its output against the original, as it can make mistakes.

To illustrate how this might help, here are examples taken from an original RunningBoard registration for the Pages app, starting
'app<application.com.apple.iWork.Pages.6871230.6871236(501)>' Constructed job description:
<dictionary: 0x910d117a0> { count = 23, transaction: 0, voucher = 0x0, contents =
"Platform" => <int64: 0x94ab1b6b9872cd77>: 1
"ProcessType" => <string: 0x910c2dc20> { length = 3, contents = "App" }
"EnableTransactions" => <bool: 0x1fb02aba0>: false

and running on for many more lines after those.

Writing Tools’ Summary reads:
The job description for the Pages application is provided. It includes details about the platform, process type, environment variables, and more. The description also specifies the program arguments and the path to the Pages executable.

Key Points start:

  • Application Name: com.apple.iWork.Pages
  • Application Bundle Identifier: com.apple.iWork.Pages
  • Application Platform: 1
  • Session Types: “Aqua”, “LoginWindow”
  • Initial Task Role: 2
  • Environment Variables: Includes variables like `__CF_USER_TEXT_ENCODING`, `TMPDIR`, `SHELL`, `HOME`, `SSH_AUTH_SOCK`, `LOGNAME`.
  • User Information: USER: hoakley, HOME: /Users/hoakley

List starts:

  • The job description is for a constructed application.
  • The application is identified as ‘app<application.com.apple.iWork.Pages.6871230.6871236(501)>’.
  • The application is running on a platform with an ID of 1.
  • The process type is “App”.
  • Transactions are not enabled for the application.
  • The application is managed by “com.apple.runningboard”.
  • The bundle identifier for the application is “com.apple.iWork.Pages”.
  • The application is part of a resource coalition with an ID of “app<application.com.apple.iWork.Pages.6871230.6871236(501)>”.
  • Pointer authentication is disabled for the application.

I think the first item there is a minor misreading, as I would understand that the text reports that a job description has been constructed for the application, not that the application is somehow constructed. However, other items listed appear to be faithful to the contents of the original message.

In some cases I have seen Writing Tools spell out an abbreviation, and in most it lays out the contents of long lists and dictionaries more accessibly. Try it out and see what you think.

LogUI 1.0 build 46 is now available from here: logui146
and from its Product Page.

Enjoy!

Last Week on My Mac: Who’s afraid of changing interface?

By: hoakley
11 May 2025 at 15:00

With Apple’s annual Worldwide Developers Conference less than a month away, speculation about what’s coming in macOS 16 is starting to warm up. So far that has concentrated on increasing consistency in interfaces across the different platforms, which could mean almost anything. As far as macOS is concerned, that’s largely up to AppKit and SwiftUI, its two major interface libraries.

AppKit remains widely used, and is still the more complete of the two. Descended from the UI framework in NeXTSTEP, it was in the core of Mac OS X at the start, and has been the mainstay for the Finder and Apple’s own apps for the last 25 years. It has a close relative in UIKit for iOS and iPadOS, although they are less comprehensive in their features.

SwiftUI is an interesting experience for the macOS developer, and is currently an archipelago of delights in a sea of disappointment. Some of its features are powerful, but a great deal is still lacking. Support for views and features widely used in modern iOS and iPadOS apps is impressive, and it opens up features such as the List View that I praised recently. But when it comes to essentials that are confined to macOS, such as menus, a great deal of work remains as it comes up to its sixth birthday on 3 June.

This is demonstrated in one of the best tutorials I’ve seen on using SwiftUI for macOS, in this case to develop a Markdown editor, written by Sam Rowlands of Ohanaware. No sooner has he set up a split view to accommodate both the Markdown source and its preview in the same window, than he writes: “The TextEditor in SwiftUI ticks the box of offering a way to edit a large volume of text, but that’s about all it does. Apple have a much more powerful text editor already in the macOS as part of their AppKit framework, so we’re going to wrap that instead.”

This was my experience a while ago when I looked at a range of document formats. Open the Help book in LogUI and what you see there is cast not in SwiftUI, which still doesn’t offer a PDF view, but reaches back to AppKit. While creating a useful Rich Text editor using AppKit is amazingly quick and simple, even plain text editing in SwiftUI is feeble. There are plenty of experts who will advise you “SwiftUI’s text editor is very limited. It doesn’t support much more than entering large amounts of plain text. If you want rich text editing, you will have to use either NSTextView or UITextView.”

These are fundamental features that should by now be easy going for any macOS interface library that’s six years old.

Continuing dependence on both AppKit and SwiftUI presents Apple with the problem of having to update both to reflect changes it intends making to improve interface consistency, then for iOS there’s also UIKit. Not only that, but all three libraries have to integrate and work together.

SwiftUI has undergone constant change over those six years. One of its most substantial changes has been the move from the Observable Object protocol to the Observable macro. Apple describes how to migrate in this article, complete with sample code. But that poses the developer a problem, as adopting the latter is only possible in apps written for macOS 14 or iOS 17 or later. That’s why LogUI requires a minimum of macOS 14.6, as do many of the better SwiftUI apps. Writing SwiftUI apps to support macOS older than Sonoma and Sequoia is thus a serious undertaking, and whatever macOS 16 and its new version of SwiftUI bring, you can be sure they’ll make backward compatibility even more impractical.

Documentation for SwiftUI is also broken. Apple seems to have stopped writing conceptual explanations about ten years ago, and structured guides have been replaced by terse and usually uninformative references to individual functions and other details of the macOS API. The only way to try to gain understanding of SwiftUI is to turn to third-parties, who are more interested in the lucrative iOS market rather than macOS, and think a series of example projects are a substitute for a systematic guide.

If there’s one sound investment for the future that Apple could make from its much-vaunted half trillion dollar investment in the US, it would be to hire a large team of technical authors and catch up with its ten-year backlog of documentation.

Whether you gasp with horror or delight when Apple reveals what’s coming in macOS 16 next month, spare a thought for all the changes that have to take place in AppKit, UIKit and SwiftUI, all the documentation that won’t get written, and how code is going to struggle to be compatible with macOS 16 and Sequoia or earlier. Then for good measure throw in the inevitable load of new bugs. So you still want to beta-test macOS 16?

Reducing noise by searching LogUI’s views

By: hoakley
8 May 2025 at 14:30

App architectures can enable or constrain. My previous log browsers, Consolation and Ulbow, have been document-based, so each window represents a different log extract. As there seemed little reason to open two document windows on a single extract from the log, I’ve normally tweaked and fiddled with each window to display the entries I want to browse, an inevitable compromise that usually leaves me scrolling through thousands of entries.

LogUI is lighter in weight and not based on documents, merely windows and views. Although they’re backed by the data of a log extract, there’s no reason that you shouldn’t open several windows on the same data if that makes analysis easier. And it does, particularly when used with Search. Here’s an example.

Over the last couple of weeks, I’ve been looking at many log extracts covering app launch, one of the busiest events in macOS. In the first few seconds following a double-click to run an app, the log can accumulate well over 25,000 entries. No matter how experienced you are in dealing with them, or how efficiently you can look for milestones marking progress, it can take hours to read the launch process thoroughly in the log. This is partly because of the sheer volume of entries, but most of all because so many subsystems in macOS are involved. Any given period of tens of milliseconds can have long volleys in TCC, interspersed with a series of RunningBoard assertions, and occasional progress reports from LaunchServices. They’ll suddenly be interrupted by DAS dispatching an unrelated background activity, Wi-Fi updates, and other everyday tasks.

Try this instead.

Watch your Mac’s clock until it’s about to change minute. Just as the seconds count changes to 00, double-click the app and take your hands away from mouse/trackpad and keyboard. Once the clock reaches 10 seconds, assuming the app launch is complete, quit that app and start up LogUI. Its new window should show the time when you launched the app, so ensure its time period is correct, say anything between 5 and 30 seconds, and allow it to collect up to the 5-10 seconds required. When that’s ready, click on its Get Log button and check that it contains all the entries you require. Open second, third, fourth, and fifth windows likewise, with the same start times and settings. Once they’re all open, Get Log in each of them, and check that the number of entries is identical, indicating that each has the same log entries.

In my case, launching Pages brought over 40,000 log entries in the first 5 seconds, ending with the app running and prompting me to open a document. Even if you speed-read those at one entry every second, that would take you nearly 12 hours to work through. Let’s reduce that to a few minutes to see each of its important phases.

In a second window, type sendaction: into the Search box at the top right and press Return. That will find all entries marking the clicks/taps you triggered the launch with.

There are two paired entries 0.237 seconds apart, representing my double-tap. So we now know that we can safely ignore everything in the log that happened before the time 11:55:00.767. Leave that window open with just those entries showing, as a reminder.

Normally the first subsystem on the scene to handle those actions is LaunchServices. In the third window, change the search field 🔍 popup menu to Subsystems, type launchservices in the Search box, and press Return.

Sure enough, from a time of 00.779 seconds, only 0.012 seconds after the second tap, LaunchServices reports that it’s getting ready to launch Pages through RunningBoard, and constructs its EnvironmentDictionary for the purpose. This is the cue to move onto the fourth window, where we set the popup menu to Subsystems again, enter runningboard into the Search box, and press Return.

This details the launch request being handled by RunningBoard, which a few moments later constructs and reports an extensive job description for Pages. Another early arrival during the launch process is TCC to check the new app’s privacy access. In the fifth window, set Subsystems again, and search on tcc.

So far we’ve ignored another group of subsystems and processes that are more interesting than the drudgery of TCC, security. For a first look at how this is checked, switch the popup to Processes and search for amfid, the service for Apple Mobile File Integrity (AMFI) checking.

This shows its check entering first the path to the main executable at 00.805 seconds, two immediate security checks being called, then entering the path for one of the frameworks inside the Pages app bundle 0.05 seconds later. We can readily trace each framework check through the rest of the launch process in this view.

A more general summary of security checking milestones is provided by com.apple.syspolicy.exec, so switch the popup to Subsystems, and search on syspolicy.

This reveals how syspolicyd called a Gatekeeper process assessment on Pages, showed that the code had already been evaluated (despite it not having been run previously in this session), and allowed the launch to proceed without any further checks like an XProtect scan being made.

Finally, for a permanent record of this launch, in any of the windows click on the Save button to write all 41,712 log entries to a Rich Text file. That turned out to be 9.3 MB in size, so I’m glad I’m not still trawling through that trying to make sense of its contents.

To do this, LogUI will require a little more memory: in this case, working with five windows, each with over 40,000 log entries, LogUI took 520 MB. I think the convenience is worth that small cost, but I am going to return to Xcode to see if that can’t be managed better and reduced in size.

At the moment, LogUI doesn’t use any tricks to share a single log extract across different windows, and I’m wondering why and how that could be improved. One approach might be to obtain a single log extract as a Project, from which you can open individual windows for different searches. Although that shouldn’t be difficult to code, it would make LogUI more complex to use, and limit the flexibility of each window. Please try this out yourselves and let me know what you think. For now, I’m surprised at how useful search can be across several open windows.

Search your log extracts with LogUI build 42

By: hoakley
6 May 2025 at 14:30

The biggest shortcoming of the first versions of LogUI has been their lack of search or find. If you needed to look for anything, the best approach was to save an extract as Rich Text and search through that. I’m delighted to offer a solution in LogUI 1.0 build 42.

Ulbow already supports Find for its log extracts, but that just searches the text contents regardless of which field the text appears in. Sometimes that works well, but if you want to look for specific field entries it’s highly inefficient. When working with its Lists, SwiftUI is different, and its regular Search doesn’t just find text, but only displays those items in the list that contain the text in a given field.

What I’ve attempted to do here is follow the SwiftUI model, so search returns only those log entries that contain the search text, but provide support for searching four different fields:

  • the contents of the message,
  • the process name responsible,
  • the name of the sender,
  • the subsystem.

All searches are performed as case-insensitive for simplicity and speed.

The best way to see how this works is to try it.

Here I’ve simply obtained a 20 second period of recent log, with Max entries set to accommodate them, a total of over 13,000 entries, far too many to search through manually.

I left the search field, in the popup menu next to the magnifying glass symbol 🔍, set to Messages, then typed cfprefsd into the search box at the top right, and pressed the Return key to initiate the search. This returns all the entries in that log excerpt that contain the text cfprefsd in their message field.

SwiftUI can perform live incremental search, so that as you type characters into the search box, the search is performed. While that can be impressive on shorter lists, and minimises the number of characters you have to type in for a useful result, it’s costly when performed on large lists, and with log extracts can be quite distracting. If you want to see live search in action, I’ve used that in AppexIndexer, where it only has to deal with a few hundred rows at a time.

I then select one of those.

Having found all those entries containing cfprefsd in the messages, I switch the popup menu to Processes and press the Return key again. If the search box has lost the focus, the Mac will ‘beep’, so all you do is click on the search box and press Return to perform the search.

Now the window contains all those log entries containing cfprefsd in their process name. Note how the previously selected entry is still highlighted: selections in log entries should be preserved throughout searches.

For the final search I set the popup menu to Senders, and press the Return key.

This time there are no log entries that meet the search criterion, and the window informs you of that.

To return to the full log extract at any time, empty the search box, perhaps using its 🅧 tool, and press Return.

When you save a log extract in the midst of searching, the file should still contain the whole of the extract, not just what’s currently visible in the search. You should be able to copy only selected entries from a search, though.

As it stands, LogUI now has a toolbar containing the search box and two rows of settings and controls below that. I’m open to suggestions as to how that could be changed or reordered, ideally to reduce it to two rows without increasing minimum window width.

LogUI 1.0 build 42 is now available from here: logui142
and from its Product Page.

I hope you find it useful and more productive.

预言在应验:五年前所讨论的未来人机交互的新范式_6.ylog

By: Steven
16 June 2024 at 22:58

从 2024 年的今天,回望 2019 年的 Apple 和 Ive 团队,我们会发现有些变化和趋势似乎是早已注定的。在过往的观察和分析中,我们所预言的事情正在成为现实和主流。常言道以史为镜可以知兴替,今天再看当时的 Apple 和 Ive 团队,关于产品的演进思路和设计策略的变化都早有端倪,也能预见在 AI 席卷的浪潮下,Apple 将会如何应对。

在这一期,你会听到:

—- 二十年前的专利文件:通体透光的 iPhone

—- 国产厂商和 Apple 在设计上的差异

—- 成功的设计:AirPods 只是剪掉线的 EarPods

—- 塑料手机的设计巅峰:iPhone 5c

—- 刘海与机器视觉:早早布局的 AI 伏笔

—- 未来十年的人机交互:人和人之间怎么交互?

—- 设计策略上的「S型曲线」体现在哪里?

—- 产品路径上迷路的 iPad

—- 光洁的划痕:是矫情还是哲学?

—- 史上最佳手机壳:iPhone 5c 的多彩硅胶壳

—- 拟物化的残党,现在理解扁平化的先进性了吗?

|相关图片|

首款 Unibody 设计于 2008 年 10 月发布
截图来自:Designed by Apple in California

查看更多图片和设计讨论:Mac Pro 2019

|拓展阅读|

如何评价 iPhone X 的工业设计?

交互的王,时代的狂!万字详解灵动岛的今生来世!

十年轮回?经典进化!工业设计师深入解读 iPhone12!

从技术寿命 S 曲线,看阳极氧化铝的设计

抽象的产品,用户「界面」的设计

如何看待 Evans Hankey 从 Apple 设计团队离职?

注定会离职的 Jonathan Ive 和科技产品的设计趋势

|登场人物|

苏志斌:工业设计师,车联网智能硬件产品经理 / 联创,《设以观复》作者

王汉洋:AI 行业从业者,多档播客主播,《拯救东北1910》《山有虎》作者

|相关链接|

若你所使用的播客客户端未能完整显示插图,或遇网络问题未能正常播放,请访问:

荒野楼阁 WildloG 的地址:https://suithink.me/zlink/podcast/

阅读设计相关的各类文章:https://suithink.me/zlink/idea/

|其他社交网络媒体|

苏志斌 @ 知乎|SUiTHiNK @ 即刻 / 微博

苏志斌SUiTHiNK @ Bilibili / YouTube / 小红书

|联络邮箱|

suithink.su@gmail.com

欢迎在 小宇宙、Spotify、YouTube、Apple Podcast 收听本节目,期待你的留言。

面向产品设计的 Web 前端分享会(分享会记录)

最近听说部门里面的产品或本地化运营对 Web 前端相关的内容比较感兴趣,正好我有相关的实践经验,所以在公司做了一个 Web 前端相关的分享会。分享内容包含:

  1. 使用 Devtools:介绍 Chrome 浏览器内的模拟、编辑和审查工具;
  2. 网页和部署:介绍 HTML, CSS, JavaScript, React,以及网站的部署和托管;
  3. 网页性能指标:介绍网页性能常用指标和测量工具;
  4. 资源分享:分享浏览器插件、网站和课程推荐。

与以往不同的是,这次分享会中加入了互动环节。我做了一个代码 Playground,尝试帮助观众了解 React,以及 React Props 的概念,并留了两个小任务,给观众尝试去实践对 React 项目进行编码。

完整的分享内容内容请继续浏览本文。

使用 Devtools

这个章节主要介绍 Chrome Devtools 一些可能不为人知的功能,来帮助我们提高日常工作中的效率和解决一些问题。先介绍 Devtool 里面「模拟」相关的功能。

模拟设备和屏幕尺寸

在 Devtool 里打开设备工具栏,在这里除了能够自由调整网页宽高,还能够模拟各种主流设备的屏幕。

甚至还能读取到网页里面的断点样式,提供快捷切换各种断点的方式。

需要注意的是,这里模拟的设备是会带上 UA 的,所以如果想在电脑里调试一些做了移动端特化处理的网站(比如访问主域名时,判断到是手机设备,则会跳到移动端的专门网站),是需要用到这个功能的。

模拟伪类

Devtools 还可以帮助我们排查各种交互状态下的样式问题,最常用的是,比如说我们想仔细排查某个元素的悬停和按下状态的样式,则可以在选中元素之后,勾选对应的伪类选项。

模拟媒体

在渲染面板(需要手动开启,浏览器默认是没有打开这个面板的)能够模拟部分系统设置,比如亮暗模式、打印模式、高对比度和减少动态效果等。

与之对应地,可以扩展一个概念叫做 CSS 的媒体查询,CSS 还可以探测到很多用户设备的属性或者设置,比如设备指针精度、视窗比例、当前是否全屏模式、设备方向等…

能探测的内容很多,但实际能用起来的可能只有寥寥数个,最全面的信息可以取 MDN 上查看。

编辑网页文字样式

Devtools 还提供了一个新的字体编辑器,能够让我们实时更改网页中的字体家族、字体大小、字重等属性。

编辑网页内容

我们在 Devtools 控制台里面执行代码document.designMode = 'on' 后,就可以实时在本地修改网页文字内容了,就跟平常打字一样。很适合用在测试文案长度的场景。最后也会分享一个浏览器插件,能够对网页做更多的编辑。

审查 React 组件

最后介绍一个审查 React 组件的方法,有时候我们想看某个元素是不是用的组件库,或者这个组件包含了什么属性之类的,可以下载 React Developer Tools,然后点选网页中的任意元素,进行审查。

网页和部署

接下来我介绍一下网页构成和网站部署相关的内容。

通常来说,HTML, CSS, JavaScript 是构成网站的三个要素。其中:

  • HTML 用来用于定义网页的结构和内容,可以用来创建网站的各个部分,比如标题、段落、图片、链接等。
  • CSS 用来定义网页的样式和布局,这个可能会是咱们设计师比较熟悉的部分,我们能够利用 CSS 来定义 HTML 元素的各种样式,控制它们的布局和位置。
  • JavaScript 用来实现各种功能逻辑和操作交互。比如响应点击事件、动态修改网页内容,根据条件执行动画效果或展示特定内容等。

CSS 预处理器

上述的三种语言,都有各自对应的语法规则。而 CSS 预处理器,则改进了原有的 CSS 语法,使我们能使用更复杂的逻辑语法,比如使用变量、代码嵌套和继承等。

简单来说,CSS 预处理器能让我们写样式代码的过程更顺畅,使代码有更良好的可读性和扩展性,帮助我们更好地维护代码。

举个简单的例子,比如原本的 CSS 语法中要求我们给每一个元素写样式时,必须以花括号开始和结尾,而且每一条样式规则直接都要以分号隔开,而 Stylus 则能够让我们跳出这个限制。直接用换行和缩进来代替。

CSS 框架

另一个值得一提的概念是 CSS 框架。CSS 框架则提供了一套预设样式,比如颜色板、字体梯度,布局和断点设定等;以及一些常用组件,如导航栏、对话框和页脚等。

简单来说,就是提供了一批开箱即用的样式,便于开发者快速启动项目,同时也会保留高度自定义的空间,用于支持各种各样的需求。通常 CSS 框架都会包含使用某个 CSS 预处理器,甚至内置了一些图标库,主打一个 “开箱即用”。

这里稍微介绍一下一个 CSS 框架:Tailwind CSS。是一个高度定制化的 CSS 框架,通过大量的预定义类名,使开发人员快速构建和设计网页界面。

与其他 CSS 框架相比,有一个显著的特点是 Tailwind CSS 本身不会包装一个组件出来,比如按钮、输入框的样式,没有预设好的。取而代之的是,Tailwind CSS 将各种原子级的 CSS 类名包装起来,比如:

  • 设置左右两边的 Padding,用 px-[...] 类名来实现;
  • 设置一个元素为块级元素, 用block 类名来实现…

如果想要在 TailwindCSS 中,使用打包好的组件,达到开箱即用的效果,可以通过各种官方/非官方的模版或组件生态来进行。比如:

React

接下来介绍另一个概念:React。这是一个用于构建 Web 和原生交互界面的库(是的,它能够用来做 App,不仅仅是网页)。而且引入了 JSX 语法,将 HTML 和 JS 结合起来,以一种更直观和易于理解的方式描述界面的结构和内容。

React 有一点和我们的设计稿很像,就是它的组件思维。在构建用户界面时,React 主张先把内容分解成一个个可以复用的组件(把具体的交互、功能逻辑写在组件里面)。然后在页面中将各个组件连接起来,使数据流经它们。

下图引用了官网中的一个例子,其中:

  1. 完整的应用,可以理解为由多个组件拼接成的完成网页;
  2. 搜索组件,用来获取用户输入;
  3. 数据列表,会根据用户搜索来过滤和展示内容;
  4. 每个列表的表头;
  5. 表格内每条数据。

现在我们用一个具体例子来简单介绍下 React 的组件。

在上图中,展示了一个页面页面 App.jsx 包含了 Profile、Gallery 和 FAQ 组件,以及 Profile.jsx 组件的代码。右侧是输出页面,展示了三个组件拼接而成的页面效果示意图,其中 Profile 组件模块里展示的内容,是和 Profile.jsx 文件内代码一一对应的。

上述的组件只是将一个模块包装起来,使其能够被其他地方复用。但组件内容是固定的。接下来会为大家展示如何向组件传递 Props,实现上文提到的一句话 “使数据流经他们” 。

在上图中,我们先将一些 Props 传递给组件 Profile(比如这里传递了图片的地址、人物姓名和描述),然后在 Profile 组件内接收这些 Props,并在组件代码内使用这些数据。

现在,我们就做出了一个可以复用的组件了,可以根据不同的内容来展示相关的人物信息。

大家有没有觉得这种做法有点熟悉?是的,在 Figma 中,我们的组件里面也有类似的做法。Figma 组件同样同样传递字符串、布尔和组件等内容。

实际上 React 组件可以传递的参数不仅仅只是上面例子中的字符串和布尔值,还能传递数值、函数、对象、Node 类型甚至另一个组件等。

我做了一个简单的 Playground,提前封装好了一个 Profile 组件,会传递一些字符串、布尔值(是否展示网站标签)以及数值(圆角大小),帮助大家更好地理解。

🛝 Playground

我做了一个 🛝 Playground ,大家可以在里面看到这个组件的具体的情况,实际看一遍代码可能会帮助理解 React 的组建和 Props 概念。

同时我也写了两个小任务给到大家去尝试,大家可以在上面的编辑器中自由尝试。

发布网站

到了这里,相信大家对构建一个网站已经有了初步的认识,接下来我为大家介绍下如何将构建好的网站发布的互联网当中,能够真正地被世界各地的人们浏览。

方法一:部署到服务器

这是比较传统的方法,先将项目相关的文件放进服务器里面(比如阿里云 ECS,或轻量服务器等)。然后在服务器内安装 NGINX,索引到项目文件夹,定义好首页、端口、404 等场景,最后将域名解析到服务器 IP。之后我们的网站就能在互联网上被人们访问了。

方法二:托管到服务商

这种是相对省心的方法,将我们项目所在的 GitHub 仓库,链接到服务商的托管服务当中。等于是由服务商来帮我们部署、发布项目,不用自己来配置服务器的各种内容了。下图列举了几种常见的网站托管服务商,分别是:Vercel,Github Pages 和 Netlify。

以 Vercel 来举例,除了能够托管网站之外,对每一次发布进行管理,甚至能够是对不同代码分支进行独立发布,还能收集网站访问数据等。

网页性能

接下来为大家介绍网页性能相关的内容。通常一个网站性能好不好,我们能够在体验时主观地感受到,比如打开时很慢、滚动时卡顿,或者点击按钮后很久才响应等等。但如果要准确地判断到网页的性能到底如何,是需要依赖具体指标的。

下面介绍三个常用的指标,分别是:FCP(首次内容绘制)、LCP(最大内容绘制)以及 CLS(积累布局偏移)。

FCP(首次内容绘制)

FCP 是一个关键指标,用来测量页面从开始加载到第一个页面内容在屏幕上完成渲染的时间。越快的 FCP 时间能够让用户感知到网页有在正常运行,而不是停滞、无响应。

这里提到的 “内容” ,指的是文本、图像(包括背景图像)、<svg>元素或非白色的<canvas>元素。如下图所示,FCP 出现在第二帧。

LCP(最大内容绘制)

LCP 指的从页面开始加载到可视区域内可见的「最大图像」或「文本块」完成渲染的时间。

这里提到的「最大图像」或「文本块」,具体来说是包含<img>元素、内嵌在<svg>元素内的<image>元素、块级文本等。

而测量方式,则是在页面加载过程中,记录视窗内的元素的渲染大小,取尺寸最大的元素,回溯这个元素被完整渲染的时间。注意,如果元素的有一部分在视窗外,在视窗外的部分不会参与到尺寸比较当中。

如下图所示,LCP 发生在第二帧,因为这个时候渲染尺寸最大的文本块被渲染出来了。后续帧当中,可能渲染出了一些图片,但尺寸都比文本块小,所以文本块依然是这个视窗内的最大元素。

CLS(积累布局偏移)

CLS 是指可视区域内发生的最大布局偏移分数。简单来说就是测量页面在加载时,元素的位置出现意外的偏移情况,如果元素尺寸大,而且位置偏移比较远,那么 CLS 分数就会显著增高。

这个指标会跟实际的用户操作或者体验有直接相关,所以应该也会是咱们设计师需要重点关注的内容,因为有时候布局偏移,是会比较影响用户获取信息、或者进行操作,甚至引发一些不可挽回的损失。

然后我来介绍一下测量网页性能的工具吧。我自己用过这两个,发现其实没啥差别,大家看喜好使用即可:

两个工具都能模拟桌面设备或者移动设备,记录多项关键指标的数据,并给出改进建议。

观察页面性能情况,不仅仅是前端技术人员要做的事情,了解到设计师也是可以参与到其中的。

比如 Guillaume Granger,他会比较想控制页面中 JavaScript 的数量,所以它提到,他会将所有用了 JavaScript 相关信息记录在表格当中。之后每次在网页中使用 JavaScript 时,都会跟之前的记录进行比对,判断重要性,决定是否在这个位置上使用 JavaScript。

开发者 Thomas Kelly 则提出了当意识到页面性能出现瓶颈时,需要做的事情,比如:

  • 制定一个目标,团队一起往这个目标前进;
  • 高频收集页面性能数据;
  • 尝试用不同方式来解决同一个问题;
  • 与同伴分享对性能的一些新发现…

资源分享

最后来分享一下相关的资源吧,包含两个插件、三个学习网站以及一个 React 课程。

插件:VisBug

介绍一个谷歌官方出品的插件:VisBug,主要用来帮助用户在浏览网页时进行调试和设计,包括编辑和可视化页面的 CSS,尺寸和字体等元素。

插件:Motion DevTools

Motion DevTools 是一个检查网页动效的插件,可视化和分析用户交互设计中的滚动、动画效果,并支持实时编辑、预览或导出等功能。

网站推荐

接下来介绍三个在国内外拥有较高知名度和影响力的设计师和开发人员。他们的观点、经验分享往往能给我带来一些新的启发。尤其是他们对钻研新技术的热情,是非常强烈的。

课程推荐

最后强烈推荐一门 React 课程——The Joy of React,这个课程我在年初的文章也有提到过,是以互动式课程的形式,由浅入深地讲解 React。从基础的组件 props 和 JSX 知识,到 Hooks、API 设计等等,讲述非常清晰,强烈推荐。

分享会感想

分享完之后感觉效果可能还不错,大家都有各自的收获。而且分享会中也不时有人提出相关问题,我也一一进行解答了。

或者也有对我分享内容的一些补充,比如我在分享完 Devtools 环节的时候,有同事也分享了一个在 Application — Cookie 面板里快速切换网页语言的方法。

后面了解到大家对于 CSS 和 React 那块听的比较迷糊,因为原本没有实践过的话,会对这些没有什么概念。而且大家好像对 🛝Playground 没有什么兴趣,并没有人对里面的内容有什么提问和看法之类的,可能到这一步都比较迷糊?🤔

指标那块倒是有不少同事关心,问了几个问题,比如有哪些方法来去改进几个指标的数据,或者在设计过程中是否可以提前避免性能问题等等。

总体来说和之前的分享会相比,这次分享会的参与度比较不错。

MIUI稳定版12.0直升12.5开发版方法

By: fengooge
27 March 2021 at 11:30
从网络反馈来看,最新的 MIUI 12.5 无论是在系统流畅性上还是隐私保护上,都有非常明显的提升,我在升级之后的第一感受就是系统真的很流畅,比我上一个 MIUI 12.0.7 稳定版有非常大的提升。MIUI 12.5 虽然是测试版系统,但是稳定性和完成度上都很高,推荐大家都升级。关于 MIUI 12.5 的官方介绍页面:https://home.miui.com/MIUI 测试版系统的常规升级方法,是需要去官方申请内测或公测名额。但是现在官方内测和公测通道都已经关闭,想借用别人已经有权限的小米账号,又有隐私泄露的风险。这里就介绍一个非常规方法,也被很多人戏称为替换安装包的「偷渡法」。【方法及步骤简介】1、下载好可以升级的 MIUI 12.5 内测版安装包(A包);这是小米官方 MIUI 安装包的 GitHub 下载页面:https://github.com/mooseIre/

❌
❌